Hazel Green, AL Map & Demographics
Hazel Green Map
Hazel Green Overview
$28,249
PER CAPITA INCOME
$80,966
AVG FAMILY INCOME
$75,625
AVG HOUSEHOLD INCOME
41.4%
WAGE / INCOME GAP [ % ]
58.6¢/ $1
WAGE / INCOME GAP [ $ ]
$10,519
FAMILY INCOME DEFICIT
0.33
INEQUALITY / GINI INDEX
3,971
TOTAL POPULATION
1,901
MALE POPULATION
2,070
FEMALE POPULATION
91.84
MALES / 100 FEMALES
108.89
FEMALES / 100 MALES
37.7
MEDIAN AGE
3.0
AVG FAMILY SIZE
2.7
AVG HOUSEHOLD SIZE
1,996
LABOR FORCE [ PEOPLE ]
66.2%
PERCENT IN LABOR FORCE
11.4%
UNEMPLOYMENT RATE
Hazel Green Zip Codes
Hazel Green Area Codes
Income in Hazel Green
Income Overview in Hazel Green
Per Capita Income in Hazel Green is $28,249, while median incomes of families and households are $80,966 and $75,625 respectively.
| Characteristic | Number | Measure |
| Per Capita Income | 3,971 | $28,249 |
| Median Family Income | 1,173 | $80,966 |
| Mean Family Income | 1,173 | $81,174 |
| Median Household Income | 1,448 | $75,625 |
| Mean Household Income | 1,448 | $75,467 |
| Income Deficit | 1,173 | $10,519 |
| Wage / Income Gap (%) | 3,971 | 41.43% |
| Wage / Income Gap ($) | 3,971 | 58.57¢ per $1 |
| Gini / Inequality Index | 3,971 | 0.33 |
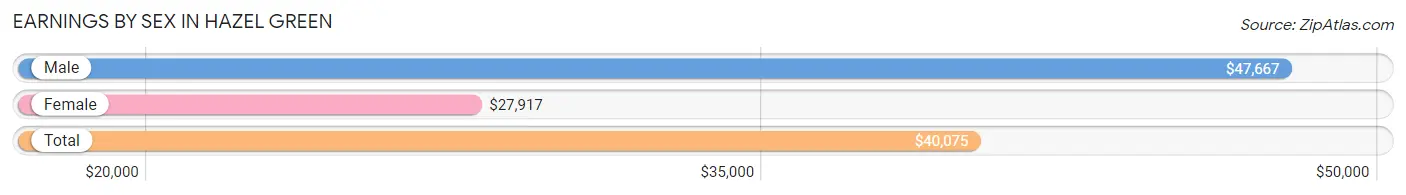
Earnings by Sex in Hazel Green
Average Earnings in Hazel Green are $40,075, $47,667 for men and $27,917 for women, a difference of 41.4%.
| Sex | Number | Average Earnings |
| Male | 920 (47.8%) | $47,667 |
| Female | 1,006 (52.2%) | $27,917 |
| Total | 1,926 (100.0%) | $40,075 |
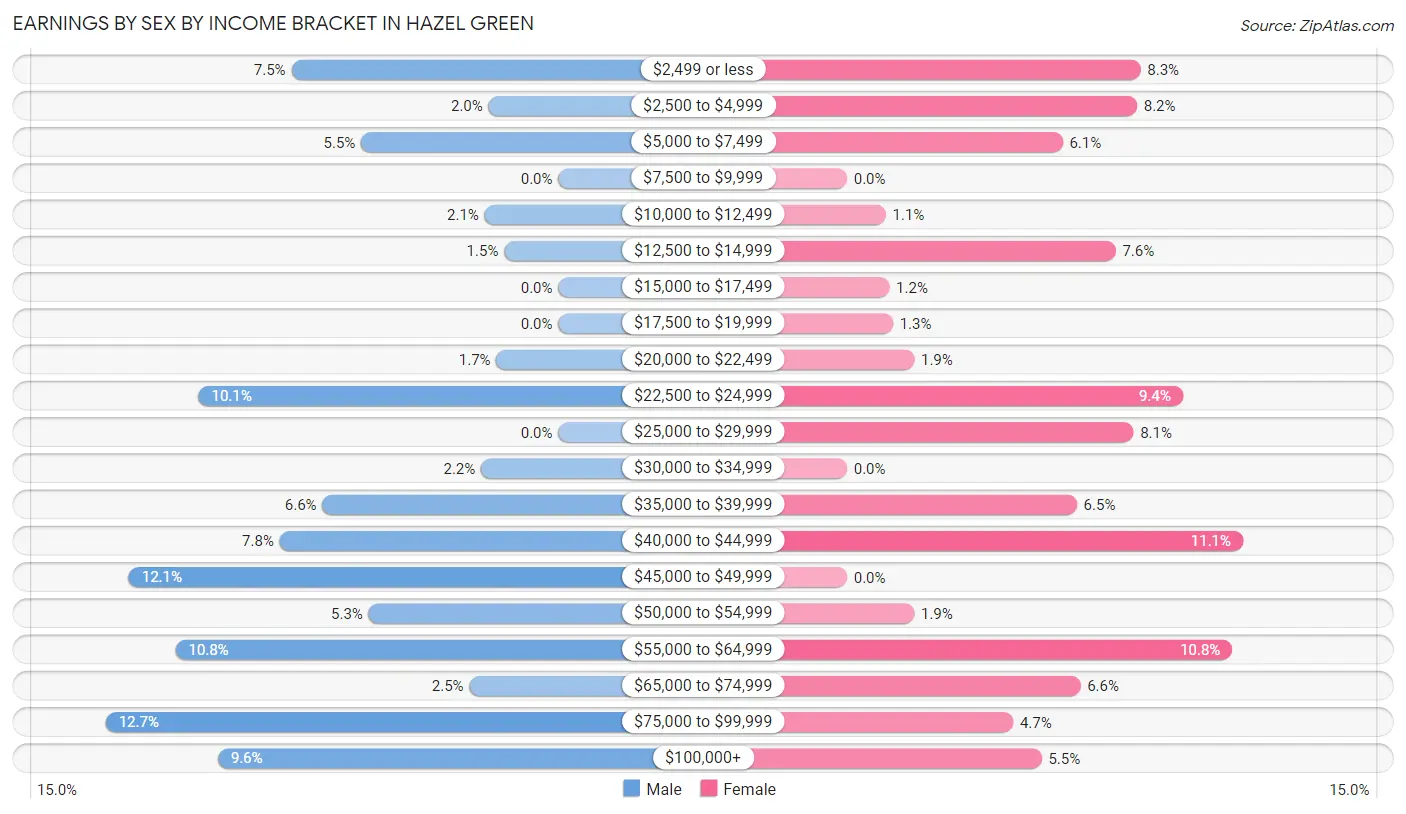
Earnings by Sex by Income Bracket in Hazel Green
The most common earnings brackets in Hazel Green are $75,000 to $99,999 for men (117 | 12.7%) and $40,000 to $44,999 for women (112 | 11.1%).
| Income | Male | Female |
| $2,499 or less | 69 (7.5%) | 83 (8.3%) |
| $2,500 to $4,999 | 18 (2.0%) | 82 (8.2%) |
| $5,000 to $7,499 | 51 (5.5%) | 61 (6.1%) |
| $7,500 to $9,999 | 0 (0.0%) | 0 (0.0%) |
| $10,000 to $12,499 | 19 (2.1%) | 11 (1.1%) |
| $12,500 to $14,999 | 14 (1.5%) | 76 (7.5%) |
| $15,000 to $17,499 | 0 (0.0%) | 12 (1.2%) |
| $17,500 to $19,999 | 0 (0.0%) | 13 (1.3%) |
| $20,000 to $22,499 | 16 (1.7%) | 19 (1.9%) |
| $22,500 to $24,999 | 93 (10.1%) | 95 (9.4%) |
| $25,000 to $29,999 | 0 (0.0%) | 81 (8.1%) |
| $30,000 to $34,999 | 20 (2.2%) | 0 (0.0%) |
| $35,000 to $39,999 | 61 (6.6%) | 65 (6.5%) |
| $40,000 to $44,999 | 72 (7.8%) | 112 (11.1%) |
| $45,000 to $49,999 | 111 (12.1%) | 0 (0.0%) |
| $50,000 to $54,999 | 49 (5.3%) | 19 (1.9%) |
| $55,000 to $64,999 | 99 (10.8%) | 109 (10.8%) |
| $65,000 to $74,999 | 23 (2.5%) | 66 (6.6%) |
| $75,000 to $99,999 | 117 (12.7%) | 47 (4.7%) |
| $100,000+ | 88 (9.6%) | 55 (5.5%) |
| Total | 920 (100.0%) | 1,006 (100.0%) |
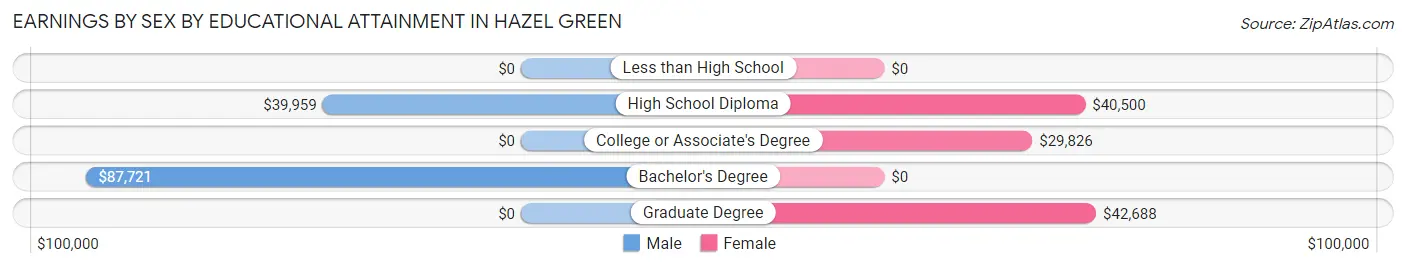
Earnings by Sex by Educational Attainment in Hazel Green
Average earnings in Hazel Green are $49,403 for men and $38,884 for women, a difference of 21.3%. Men with an educational attainment of bachelor's degree enjoy the highest average annual earnings of $87,721, while those with high school diploma education earn the least with $39,959. Women with an educational attainment of graduate degree earn the most with the average annual earnings of $42,688, while those with college or associate's degree education have the smallest earnings of $29,826.
| Educational Attainment | Male Income | Female Income |
| Less than High School | - | - |
| High School Diploma | $39,959 | $40,500 |
| College or Associate's Degree | - | - |
| Bachelor's Degree | $87,721 | $0 |
| Graduate Degree | - | - |
| Total | $49,403 | $38,884 |
Family Income in Hazel Green
Family Income Brackets in Hazel Green
According to the Hazel Green family income data, there are 293 families falling into the $100,000 to $149,999 income range, which is the most common income bracket and makes up 25.0% of all families.
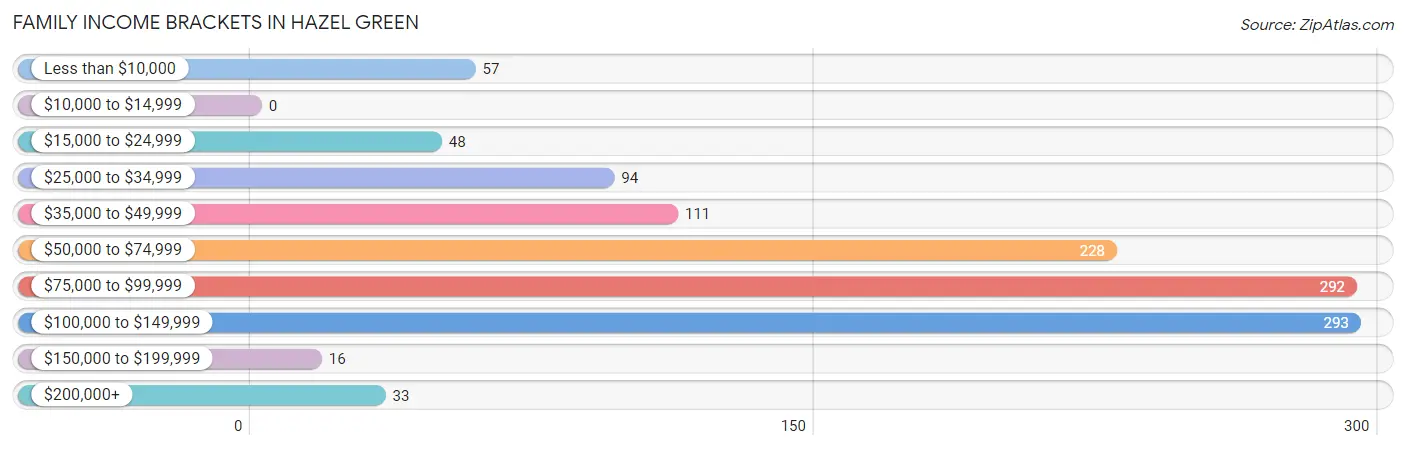
| Income Bracket | # Families | % Families |
| Less than $10,000 | 57 | 4.9% |
| $10,000 to $14,999 | 0 | 0.0% |
| $15,000 to $24,999 | 48 | 4.1% |
| $25,000 to $34,999 | 94 | 8.0% |
| $35,000 to $49,999 | 111 | 9.5% |
| $50,000 to $74,999 | 228 | 19.4% |
| $75,000 to $99,999 | 292 | 24.9% |
| $100,000 to $149,999 | 293 | 25.0% |
| $150,000 to $199,999 | 16 | 1.4% |
| $200,000+ | 33 | 2.8% |
Family Income by Famaliy Size in Hazel Green
4-person families (129 | 11.0%) account for the highest median family income in Hazel Green with $114,250 per family, while 2-person families (624 | 53.2%) have the highest median income of $35,556 per family member.
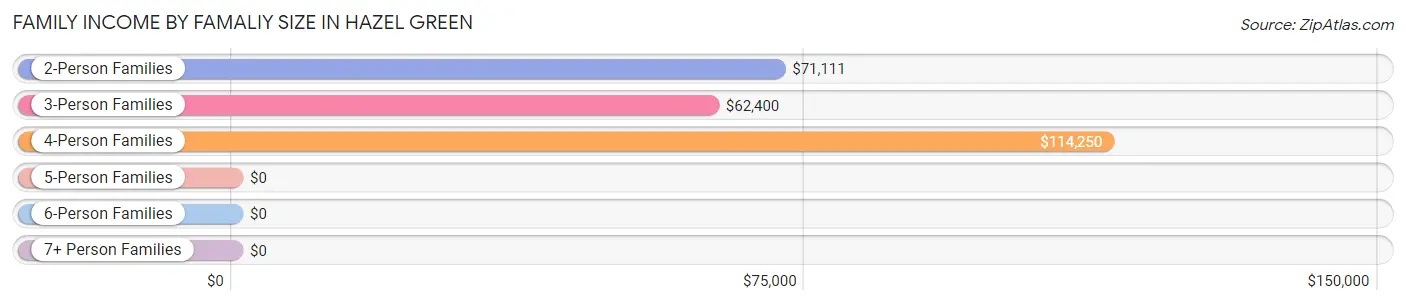
| Income Bracket | # Families | Median Income |
| 2-Person Families | 624 (53.2%) | $71,111 |
| 3-Person Families | 302 (25.8%) | $62,400 |
| 4-Person Families | 129 (11.0%) | $114,250 |
| 5-Person Families | 118 (10.1%) | $0 |
| 6-Person Families | 0 (0.0%) | $0 |
| 7+ Person Families | 0 (0.0%) | $0 |
| Total | 1,173 (100.0%) | $80,966 |
Family Income by Number of Earners in Hazel Green
The median family income in Hazel Green is $80,966, with families comprising 3+ earners (62) having the highest median family income of $133,971, while families with 1 earner (472) have the lowest median family income of $69,508, accounting for 5.3% and 40.2% of families, respectively.
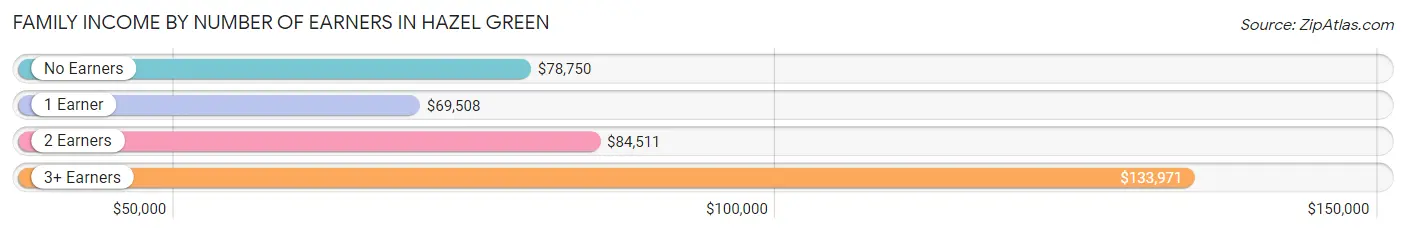
| Number of Earners | # Families | Median Income |
| No Earners | 168 (14.3%) | $78,750 |
| 1 Earner | 472 (40.2%) | $69,508 |
| 2 Earners | 471 (40.2%) | $84,511 |
| 3+ Earners | 62 (5.3%) | $133,971 |
| Total | 1,173 (100.0%) | $80,966 |
Household Income in Hazel Green
Household Income Brackets in Hazel Green
With 359 households falling in the category, the $100,000 to $149,999 income range is the most frequent in Hazel Green, accounting for 24.8% of all households.
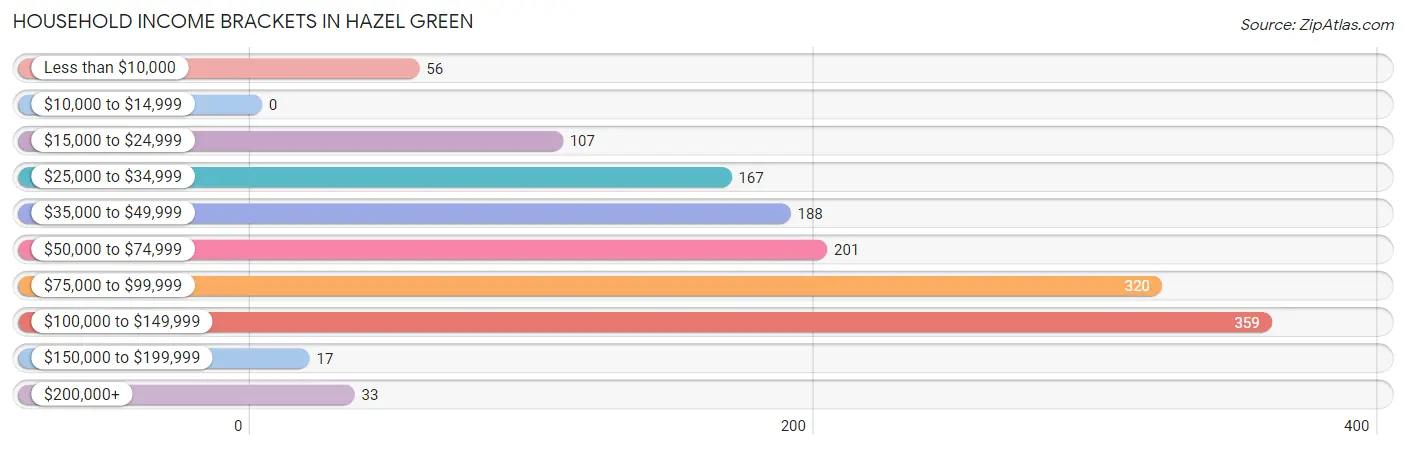
| Income Bracket | # Households | % Households |
| Less than $10,000 | 56 | 3.9% |
| $10,000 to $14,999 | 0 | 0.0% |
| $15,000 to $24,999 | 107 | 7.4% |
| $25,000 to $34,999 | 167 | 11.5% |
| $35,000 to $49,999 | 188 | 13.0% |
| $50,000 to $74,999 | 201 | 13.9% |
| $75,000 to $99,999 | 320 | 22.1% |
| $100,000 to $149,999 | 359 | 24.8% |
| $150,000 to $199,999 | 17 | 1.2% |
| $200,000+ | 33 | 2.3% |
Household Income by Householder Age in Hazel Green
The median household income in Hazel Green is $75,625, with the highest median household income of $88,178 found in the 25 to 44 years age bracket for the primary householder. A total of 558 households (38.5%) fall into this category. Meanwhile, the 15 to 24 years age bracket for the primary householder has the lowest median household income of $0, with 19 households (1.3%) in this group.
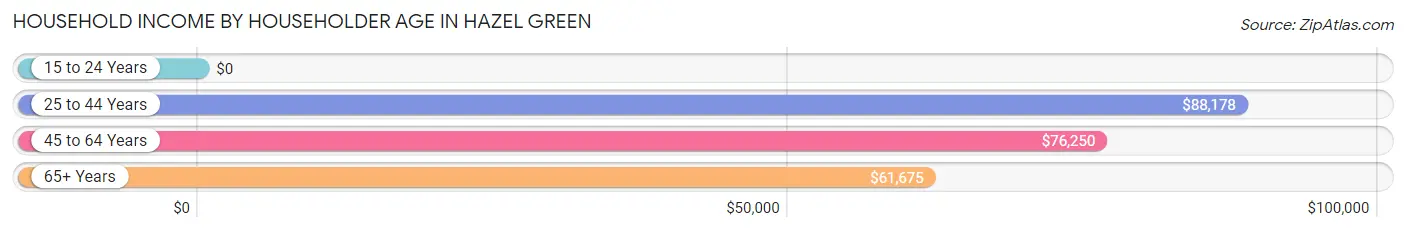
| Income Bracket | # Households | Median Income |
| 15 to 24 Years | 19 (1.3%) | $0 |
| 25 to 44 Years | 558 (38.5%) | $88,178 |
| 45 to 64 Years | 478 (33.0%) | $76,250 |
| 65+ Years | 393 (27.1%) | $61,675 |
| Total | 1,448 (100.0%) | $75,625 |
Poverty in Hazel Green
Income Below Poverty by Sex and Age in Hazel Green
With 4.7% poverty level for males and 9.3% for females among the residents of Hazel Green, 16 and 17 year old males and 6 to 11 year old females are the most vulnerable to poverty, with 71 males (100.0%) and 25 females (56.8%) in their respective age groups living below the poverty level.
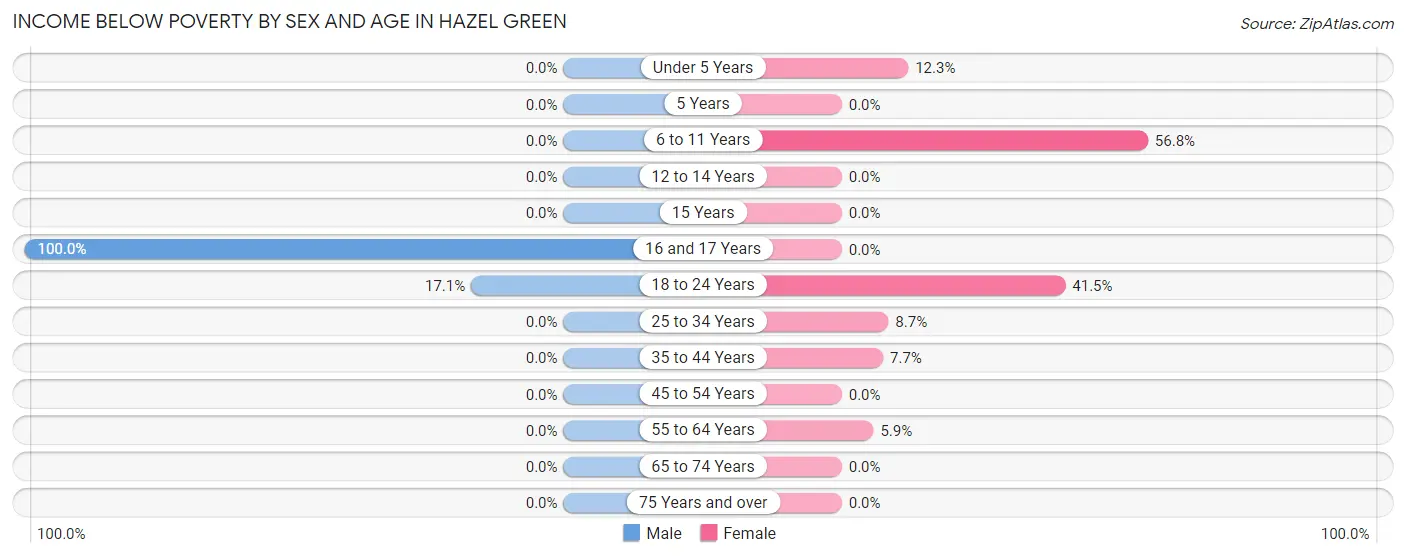
| Age Bracket | Male | Female |
| Under 5 Years | 0 (0.0%) | 27 (12.3%) |
| 5 Years | 0 (0.0%) | 0 (0.0%) |
| 6 to 11 Years | 0 (0.0%) | 25 (56.8%) |
| 12 to 14 Years | 0 (0.0%) | 0 (0.0%) |
| 15 Years | 0 (0.0%) | 0 (0.0%) |
| 16 and 17 Years | 71 (100.0%) | 0 (0.0%) |
| 18 to 24 Years | 18 (17.1%) | 61 (41.5%) |
| 25 to 34 Years | 0 (0.0%) | 27 (8.6%) |
| 35 to 44 Years | 0 (0.0%) | 30 (7.7%) |
| 45 to 54 Years | 0 (0.0%) | 0 (0.0%) |
| 55 to 64 Years | 0 (0.0%) | 20 (5.9%) |
| 65 to 74 Years | 0 (0.0%) | 0 (0.0%) |
| 75 Years and over | 0 (0.0%) | 0 (0.0%) |
| Total | 89 (4.7%) | 190 (9.3%) |
Income Above Poverty by Sex and Age in Hazel Green
According to the poverty statistics in Hazel Green, males aged under 5 years and females aged 5 years are the age groups that are most secure financially, with 100.0% of males and 100.0% of females in these age groups living above the poverty line.
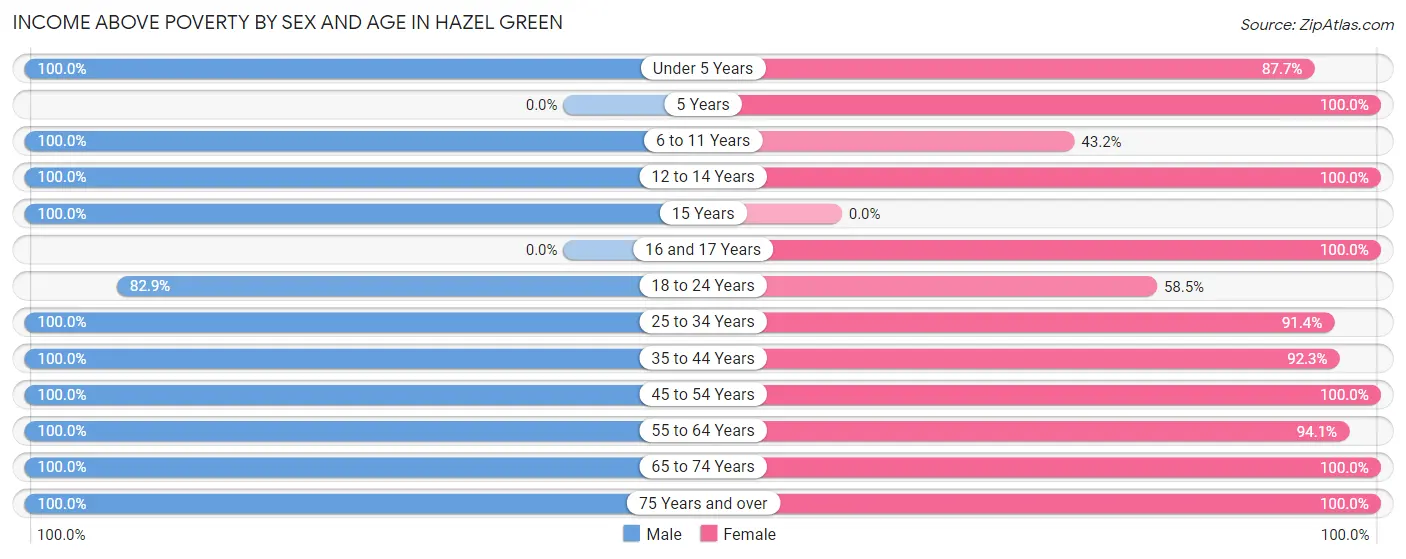
| Age Bracket | Male | Female |
| Under 5 Years | 353 (100.0%) | 192 (87.7%) |
| 5 Years | 0 (0.0%) | 30 (100.0%) |
| 6 to 11 Years | 110 (100.0%) | 19 (43.2%) |
| 12 to 14 Years | 10 (100.0%) | 153 (100.0%) |
| 15 Years | 37 (100.0%) | 0 (0.0%) |
| 16 and 17 Years | 0 (0.0%) | 18 (100.0%) |
| 18 to 24 Years | 87 (82.9%) | 86 (58.5%) |
| 25 to 34 Years | 213 (100.0%) | 285 (91.3%) |
| 35 to 44 Years | 300 (100.0%) | 361 (92.3%) |
| 45 to 54 Years | 108 (100.0%) | 88 (100.0%) |
| 55 to 64 Years | 260 (100.0%) | 320 (94.1%) |
| 65 to 74 Years | 139 (100.0%) | 175 (100.0%) |
| 75 Years and over | 174 (100.0%) | 114 (100.0%) |
| Total | 1,791 (95.3%) | 1,841 (90.6%) |
Income Below Poverty Among Married-Couple Families in Hazel Green
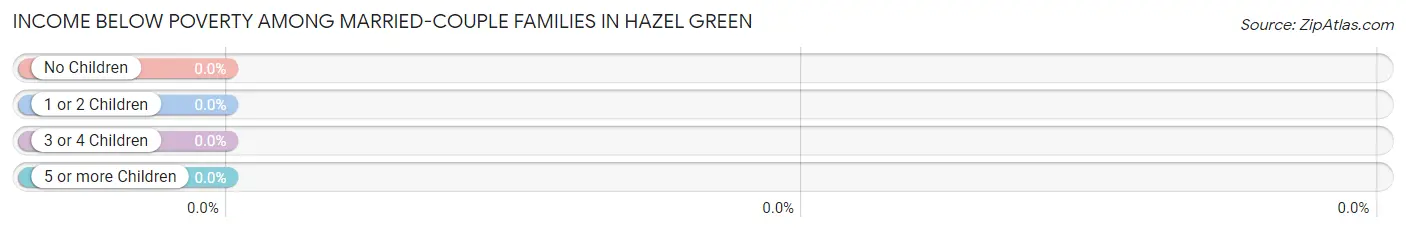
| Children | Above Poverty | Below Poverty |
| No Children | 507 (100.0%) | 0 (0.0%) |
| 1 or 2 Children | 143 (100.0%) | 0 (0.0%) |
| 3 or 4 Children | 108 (100.0%) | 0 (0.0%) |
| 5 or more Children | 0 (0.0%) | 0 (0.0%) |
| Total | 758 (100.0%) | 0 (0.0%) |
Income Below Poverty Among Single-Parent Households in Hazel Green
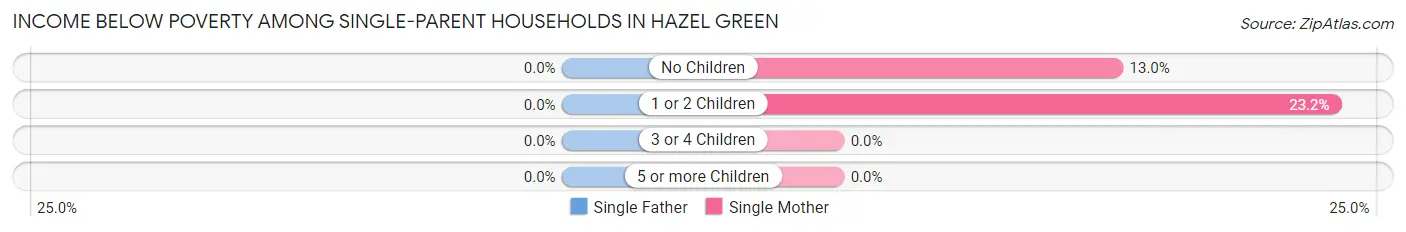
| Children | Single Father | Single Mother |
| No Children | 0 (0.0%) | 20 (13.0%) |
| 1 or 2 Children | 0 (0.0%) | 57 (23.2%) |
| 3 or 4 Children | 0 (0.0%) | 0 (0.0%) |
| 5 or more Children | 0 (0.0%) | 0 (0.0%) |
| Total | 0 (0.0%) | 77 (19.3%) |
Income Below Poverty Among Married-Couple vs Single-Parent Households in Hazel Green
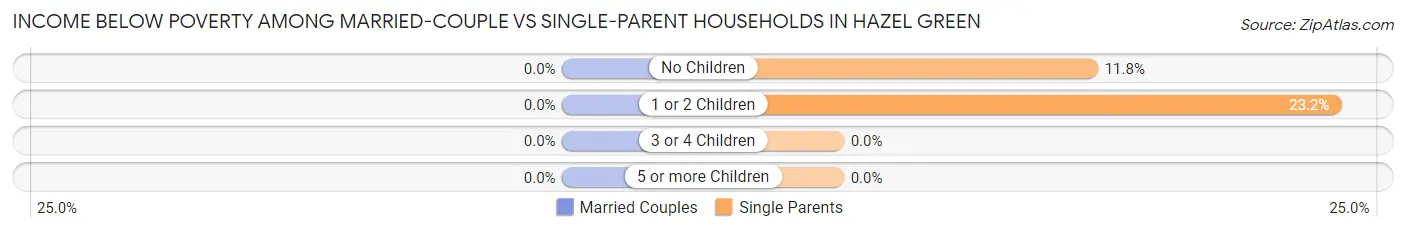
| Children | Married-Couple Families | Single-Parent Households |
| No Children | 0 (0.0%) | 20 (11.8%) |
| 1 or 2 Children | 0 (0.0%) | 57 (23.2%) |
| 3 or 4 Children | 0 (0.0%) | 0 (0.0%) |
| 5 or more Children | 0 (0.0%) | 0 (0.0%) |
| Total | 0 (0.0%) | 77 (18.5%) |
Race in Hazel Green
The most populous races in Hazel Green are White / Caucasian (3,109 | 78.3%), Black / African American (647 | 16.3%), and Two or more Races (215 | 5.4%).
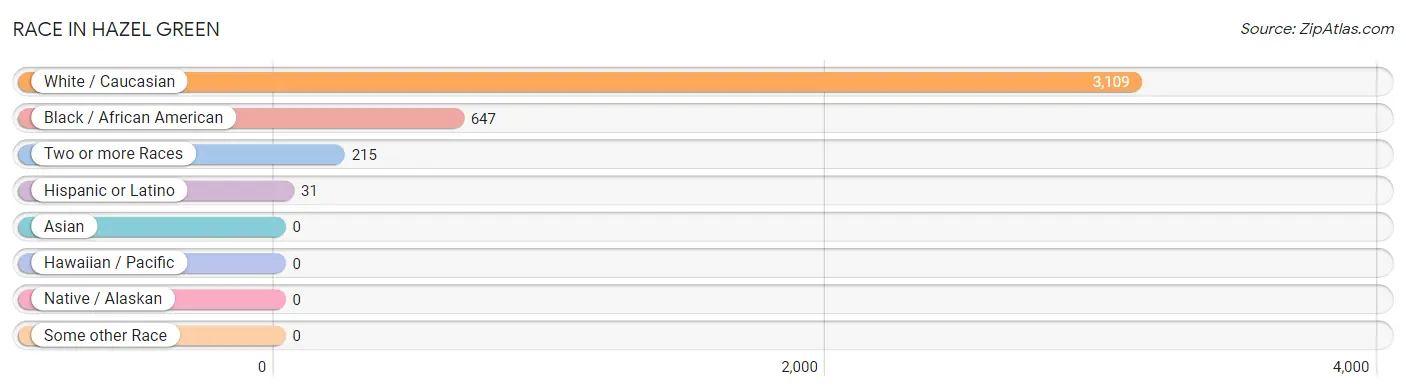
| Race | # Population | % Population |
| Asian | 0 | 0.0% |
| Black / African American | 647 | 16.3% |
| Hawaiian / Pacific | 0 | 0.0% |
| Hispanic or Latino | 31 | 0.8% |
| Native / Alaskan | 0 | 0.0% |
| White / Caucasian | 3,109 | 78.3% |
| Two or more Races | 215 | 5.4% |
| Some other Race | 0 | 0.0% |
| Total | 3,971 | 100.0% |
Ancestry in Hazel Green
The most populous ancestries reported in Hazel Green are German (493 | 12.4%), Irish (444 | 11.2%), American (264 | 6.7%), English (229 | 5.8%), and Italian (205 | 5.2%), together accounting for 41.2% of all Hazel Green residents.
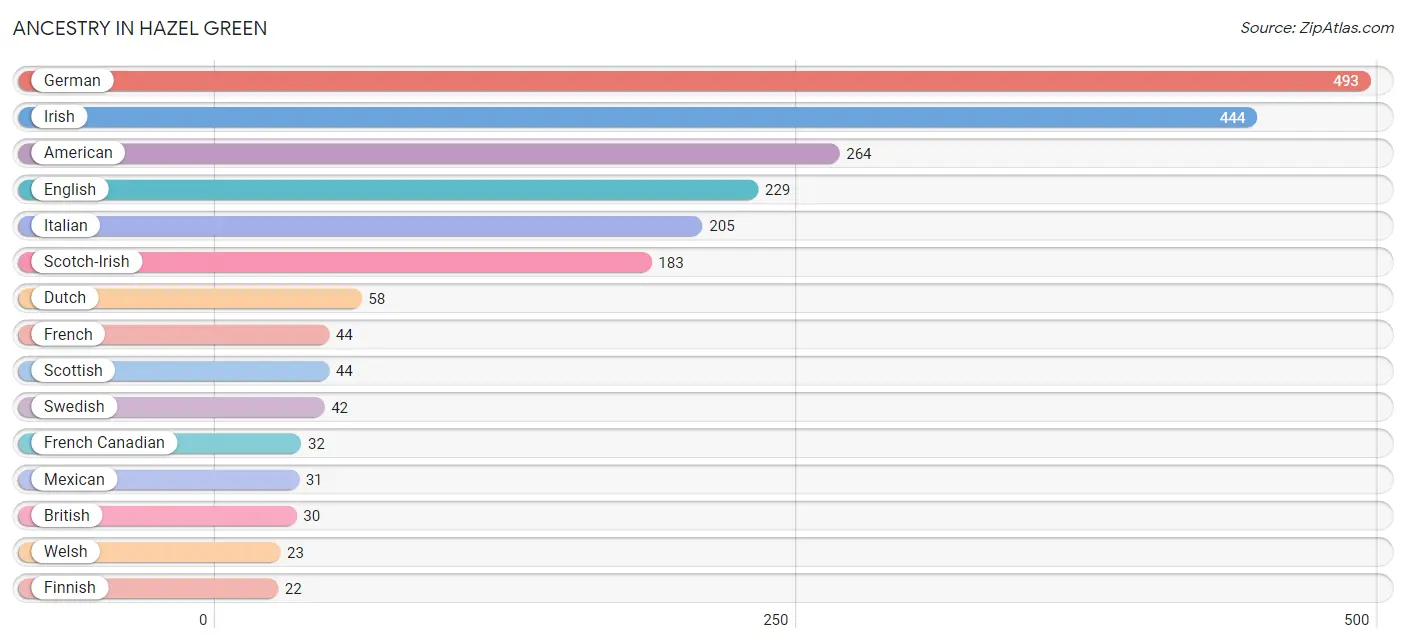
| Ancestry | # Population | % Population |
| American | 264 | 6.7% |
| Belgian | 19 | 0.5% |
| British | 30 | 0.8% |
| Dutch | 58 | 1.5% |
| English | 229 | 5.8% |
| Finnish | 22 | 0.5% |
| French | 44 | 1.1% |
| French Canadian | 32 | 0.8% |
| German | 493 | 12.4% |
| Irish | 444 | 11.2% |
| Italian | 205 | 5.2% |
| Mexican | 31 | 0.8% |
| Scotch-Irish | 183 | 4.6% |
| Scottish | 44 | 1.1% |
| Swedish | 42 | 1.1% |
| Swiss | 9 | 0.2% |
| Welsh | 23 | 0.6% | View All 17 Rows |
Immigrants in Hazel Green
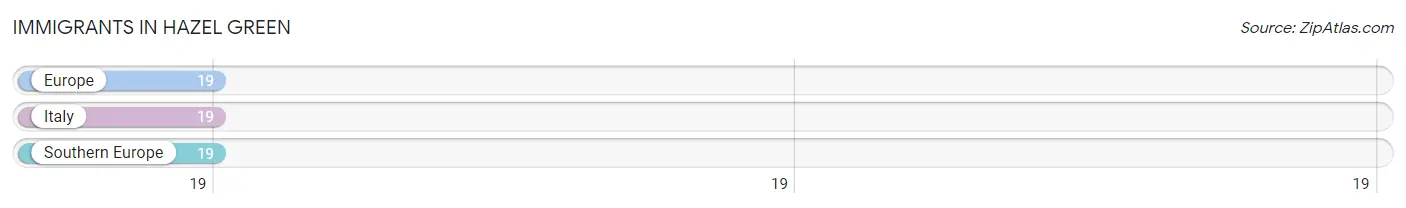
The most numerous immigrant groups reported in Hazel Green came from Europe (19 | 0.5%), Italy (19 | 0.5%), and Southern Europe (19 | 0.5%), together accounting for 1.4% of all Hazel Green residents.
| Immigration Origin | # Population | % Population |
| Europe | 19 | 0.5% |
| Italy | 19 | 0.5% |
| Southern Europe | 19 | 0.5% | View All 3 Rows |
Sex and Age in Hazel Green
Sex and Age in Hazel Green
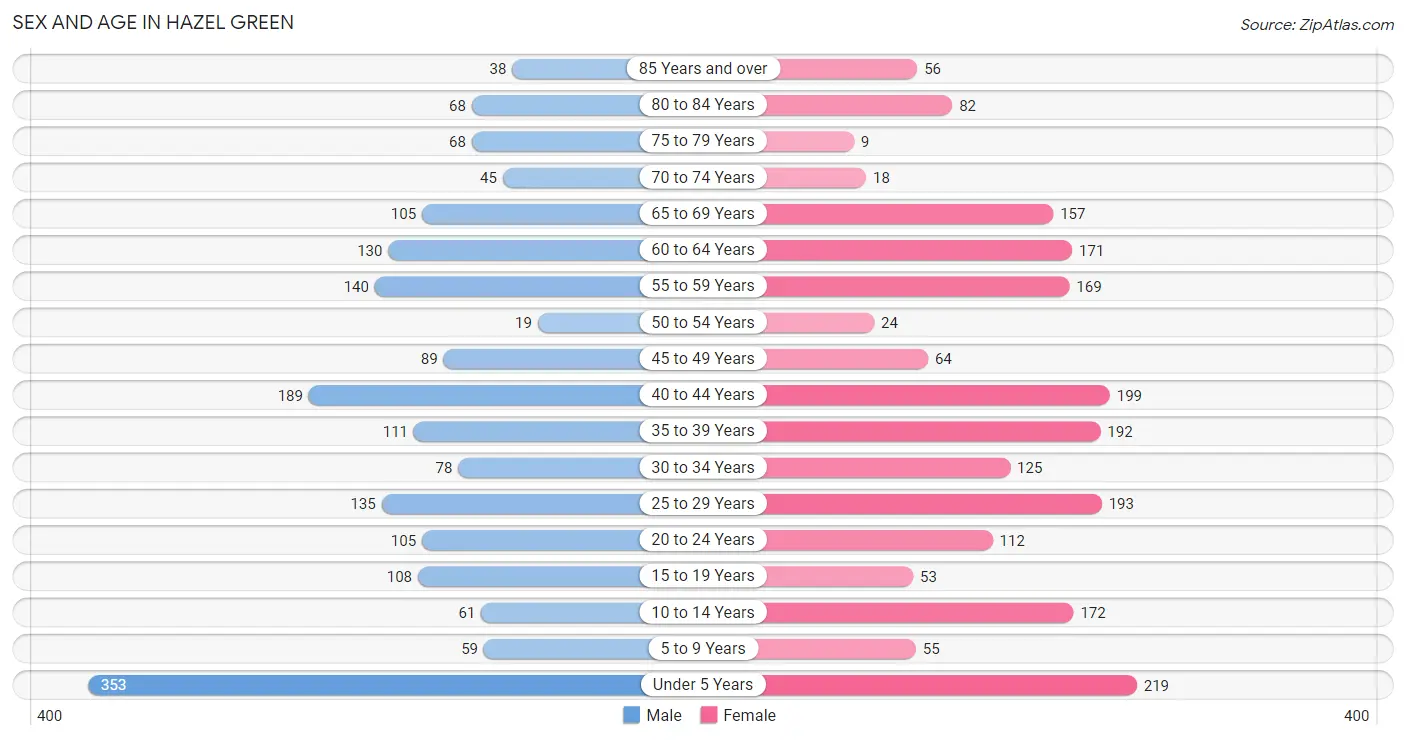
The most populous age groups in Hazel Green are Under 5 Years (353 | 18.6%) for men and Under 5 Years (219 | 10.6%) for women.
| Age Bracket | Male | Female |
| Under 5 Years | 353 (18.6%) | 219 (10.6%) |
| 5 to 9 Years | 59 (3.1%) | 55 (2.7%) |
| 10 to 14 Years | 61 (3.2%) | 172 (8.3%) |
| 15 to 19 Years | 108 (5.7%) | 53 (2.6%) |
| 20 to 24 Years | 105 (5.5%) | 112 (5.4%) |
| 25 to 29 Years | 135 (7.1%) | 193 (9.3%) |
| 30 to 34 Years | 78 (4.1%) | 125 (6.0%) |
| 35 to 39 Years | 111 (5.8%) | 192 (9.3%) |
| 40 to 44 Years | 189 (9.9%) | 199 (9.6%) |
| 45 to 49 Years | 89 (4.7%) | 64 (3.1%) |
| 50 to 54 Years | 19 (1.0%) | 24 (1.2%) |
| 55 to 59 Years | 140 (7.4%) | 169 (8.2%) |
| 60 to 64 Years | 130 (6.8%) | 171 (8.3%) |
| 65 to 69 Years | 105 (5.5%) | 157 (7.6%) |
| 70 to 74 Years | 45 (2.4%) | 18 (0.9%) |
| 75 to 79 Years | 68 (3.6%) | 9 (0.4%) |
| 80 to 84 Years | 68 (3.6%) | 82 (4.0%) |
| 85 Years and over | 38 (2.0%) | 56 (2.7%) |
| Total | 1,901 (100.0%) | 2,070 (100.0%) |
Families and Households in Hazel Green
Median Family Size in Hazel Green
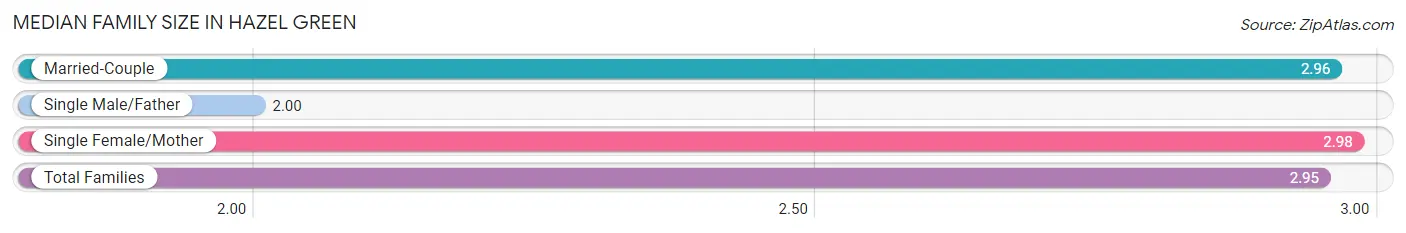
The median family size in Hazel Green is 2.95 persons per family, with single female/mother families (400 | 34.1%) accounting for the largest median family size of 2.98 persons per family. On the other hand, single male/father families (15 | 1.3%) represent the smallest median family size with 2.00 persons per family.
| Family Type | # Families | Family Size |
| Married-Couple | 758 (64.6%) | 2.96 |
| Single Male/Father | 15 (1.3%) | 2.00 |
| Single Female/Mother | 400 (34.1%) | 2.98 |
| Total Families | 1,173 (100.0%) | 2.95 |
Median Household Size in Hazel Green
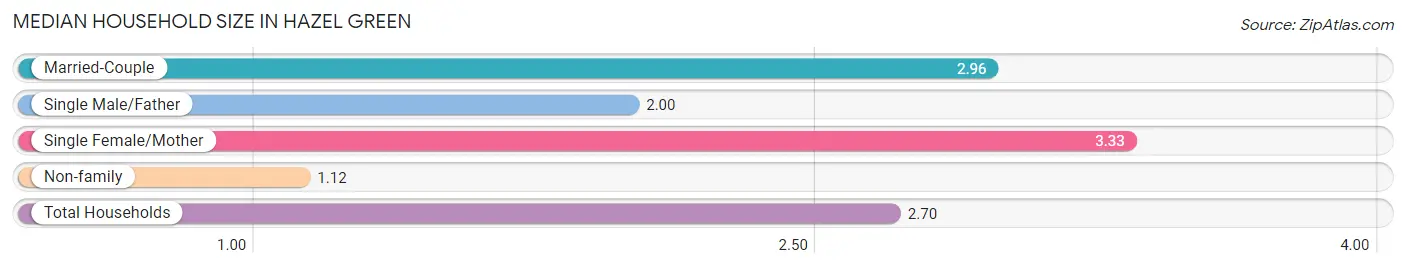
The median household size in Hazel Green is 2.70 persons per household, with single female/mother households (400 | 27.6%) accounting for the largest median household size of 3.33 persons per household. non-family households (275 | 19.0%) represent the smallest median household size with 1.12 persons per household.
| Household Type | # Households | Household Size |
| Married-Couple | 758 (52.3%) | 2.96 |
| Single Male/Father | 15 (1.0%) | 2.00 |
| Single Female/Mother | 400 (27.6%) | 3.33 |
| Non-family | 275 (19.0%) | 1.12 |
| Total Households | 1,448 (100.0%) | 2.70 |
Household Size by Marriage Status in Hazel Green
Out of a total of 1,448 households in Hazel Green, 1,173 (81.0%) are family households, while 275 (19.0%) are nonfamily households. The most numerous type of family households are 2-person households, comprising 500, and the most common type of nonfamily households are 1-person households, comprising 243.
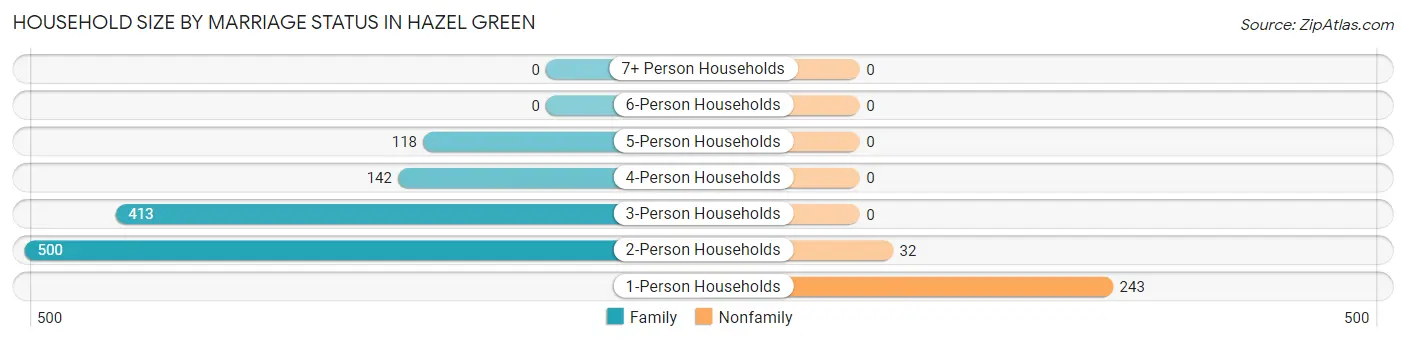
| Household Size | Family Households | Nonfamily Households |
| 1-Person Households | - | 243 (16.8%) |
| 2-Person Households | 500 (34.5%) | 32 (2.2%) |
| 3-Person Households | 413 (28.5%) | 0 (0.0%) |
| 4-Person Households | 142 (9.8%) | 0 (0.0%) |
| 5-Person Households | 118 (8.2%) | 0 (0.0%) |
| 6-Person Households | 0 (0.0%) | 0 (0.0%) |
| 7+ Person Households | 0 (0.0%) | 0 (0.0%) |
| Total | 1,173 (81.0%) | 275 (19.0%) |
Female Fertility in Hazel Green
Fertility by Age in Hazel Green
Average fertility rate in Hazel Green is 199.0 births per 1,000 women. Women in the age bracket of 20 to 34 years have the highest fertility rate with 281.0 births per 1,000 women. Women in the age bracket of 20 to 34 years acount for 64.7% of all women with births.
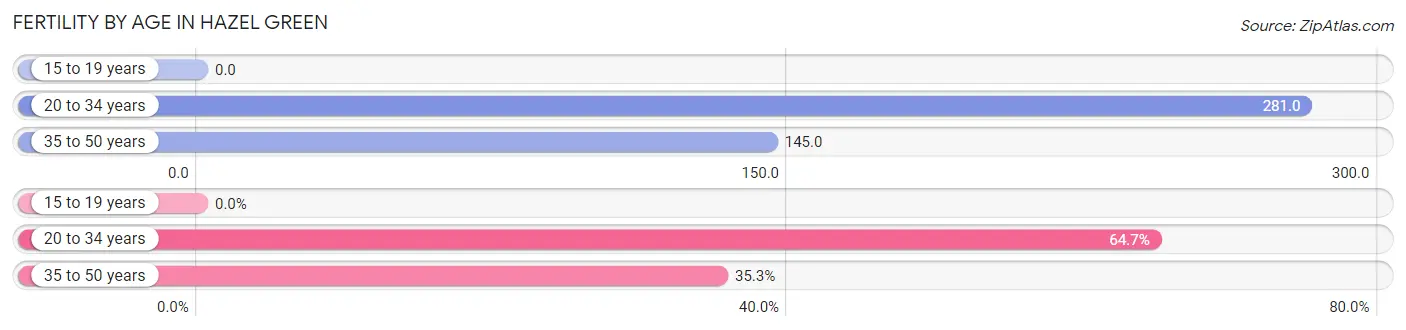
| Age Bracket | Women with Births | Births / 1,000 Women |
| 15 to 19 years | 0 (0.0%) | 0.0 |
| 20 to 34 years | 121 (64.7%) | 281.0 |
| 35 to 50 years | 66 (35.3%) | 145.0 |
| Total | 187 (100.0%) | 199.0 |
Fertility by Age by Marriage Status in Hazel Green
64.7% of women with births (187) in Hazel Green are married. The highest percentage of unmarried women with births falls into 35 to 50 years age bracket with 100.0% of them unmarried at the time of birth, while the lowest percentage of unmarried women with births belong to 20 to 34 years age bracket with 0.0% of them unmarried.
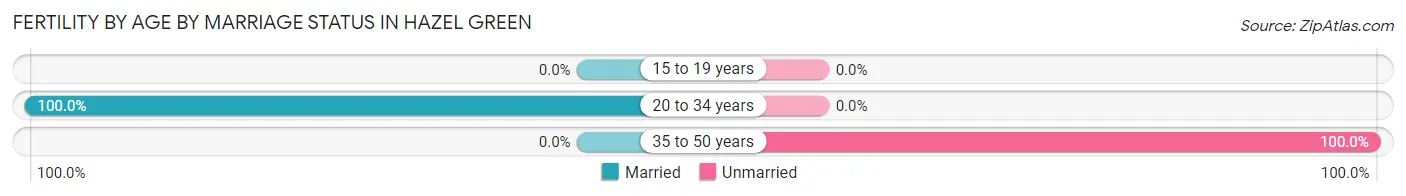
| Age Bracket | Married | Unmarried |
| 15 to 19 years | 0 (0.0%) | 0 (0.0%) |
| 20 to 34 years | 121 (100.0%) | 0 (0.0%) |
| 35 to 50 years | 0 (0.0%) | 66 (100.0%) |
| Total | 121 (64.7%) | 66 (35.3%) |
Fertility by Education in Hazel Green
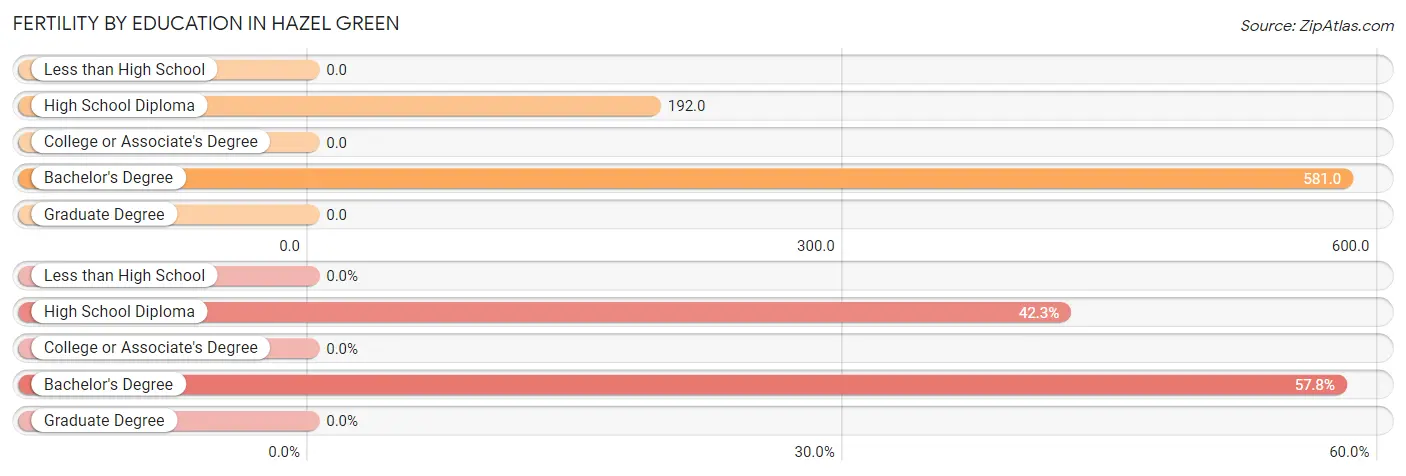
| Educational Attainment | Women with Births | Births / 1,000 Women |
| Less than High School | 0 (0.0%) | 0.0 |
| High School Diploma | 79 (42.2%) | 192.0 |
| College or Associate's Degree | 0 (0.0%) | 0.0 |
| Bachelor's Degree | 108 (57.8%) | 581.0 |
| Graduate Degree | 0 (0.0%) | 0.0 |
| Total | 187 (100.0%) | 199.0 |
Fertility by Education by Marriage Status in Hazel Green
35.3% of women with births in Hazel Green are unmarried. Women with the educational attainment of bachelor's degree are most likely to be married with 100.0% of them married at childbirth, while women with the educational attainment of high school diploma are least likely to be married with 83.5% of them unmarried at childbirth.
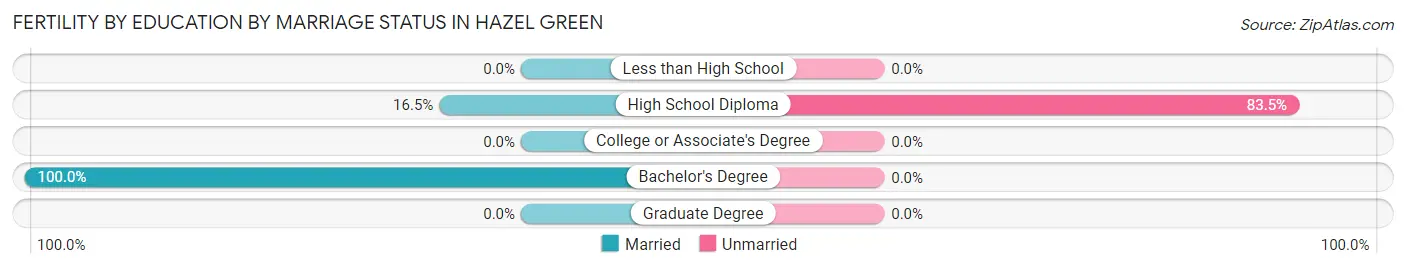
| Educational Attainment | Married | Unmarried |
| Less than High School | 0 (0.0%) | 0 (0.0%) |
| High School Diploma | 13 (16.5%) | 66 (83.5%) |
| College or Associate's Degree | 0 (0.0%) | 0 (0.0%) |
| Bachelor's Degree | 108 (100.0%) | 0 (0.0%) |
| Graduate Degree | 0 (0.0%) | 0 (0.0%) |
| Total | 121 (64.7%) | 66 (35.3%) |
Employment Characteristics in Hazel Green
Employment by Class of Employer in Hazel Green
Among the 1,739 employed individuals in Hazel Green, private company employees (1,192 | 68.5%), state government employees (142 | 8.2%), and local government employees (125 | 7.2%) make up the most common classes of employment.
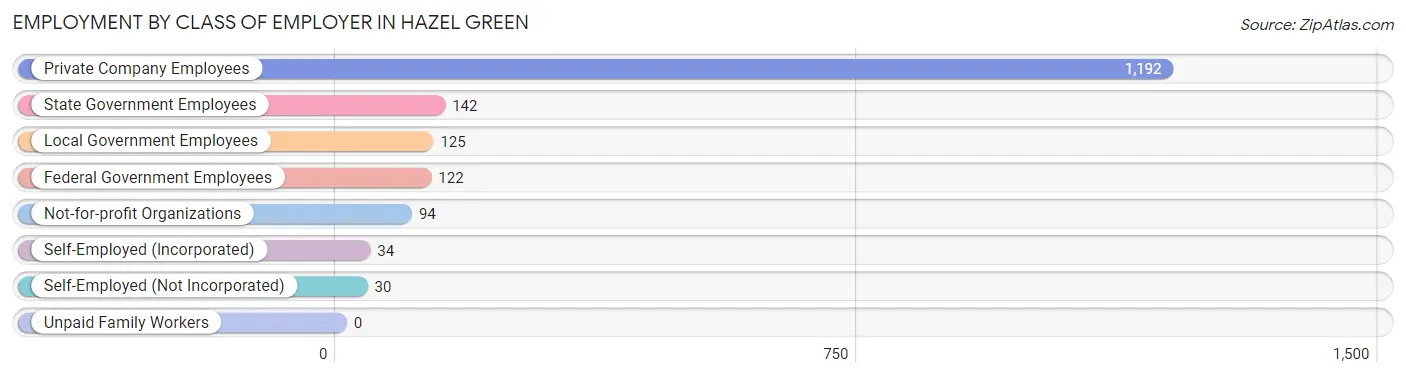
| Employer Class | # Employees | % Employees |
| Private Company Employees | 1,192 | 68.5% |
| Self-Employed (Incorporated) | 34 | 2.0% |
| Self-Employed (Not Incorporated) | 30 | 1.7% |
| Not-for-profit Organizations | 94 | 5.4% |
| Local Government Employees | 125 | 7.2% |
| State Government Employees | 142 | 8.2% |
| Federal Government Employees | 122 | 7.0% |
| Unpaid Family Workers | 0 | 0.0% |
| Total | 1,739 | 100.0% |
Employment Status by Age in Hazel Green
According to the labor force statistics for Hazel Green, out of the total population over 16 years of age (3,015), 66.2% or 1,996 individuals are in the labor force, with 11.4% or 228 of them unemployed. The age group with the highest labor force participation rate is 20 to 24 years, with 100.0% or 217 individuals in the labor force. Within the labor force, the 25 to 29 years age range has the highest percentage of unemployed individuals, with 41.2% or 135 of them being unemployed.
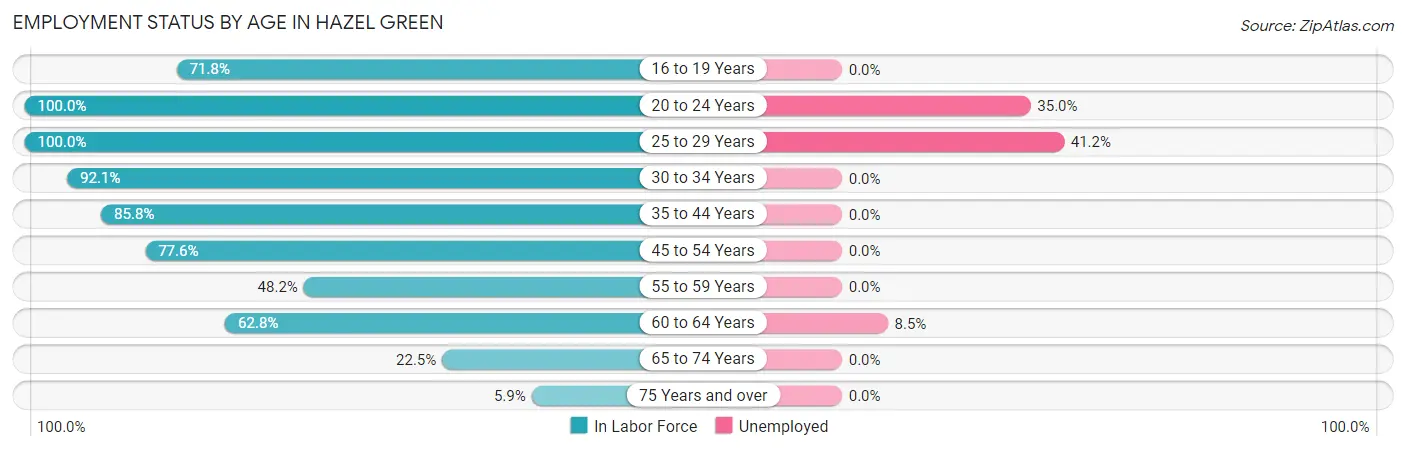
| Age Bracket | In Labor Force | Unemployed |
| 16 to 19 Years | 89 (71.8%) | 0 (0.0%) |
| 20 to 24 Years | 217 (100.0%) | 76 (35.0%) |
| 25 to 29 Years | 328 (100.0%) | 135 (41.2%) |
| 30 to 34 Years | 187 (92.1%) | 0 (0.0%) |
| 35 to 44 Years | 593 (85.8%) | 0 (0.0%) |
| 45 to 54 Years | 152 (77.6%) | 0 (0.0%) |
| 55 to 59 Years | 149 (48.2%) | 0 (0.0%) |
| 60 to 64 Years | 189 (62.8%) | 16 (8.5%) |
| 65 to 74 Years | 73 (22.5%) | 0 (0.0%) |
| 75 Years and over | 19 (5.9%) | 0 (0.0%) |
| Total | 1,996 (66.2%) | 228 (11.4%) |
Employment Status by Educational Attainment in Hazel Green
According to labor force statistics for Hazel Green, 78.8% of individuals (1,598) out of the total population between 25 and 64 years of age (2,028) are in the labor force, with 9.4% or 150 of them being unemployed. The group with the highest labor force participation rate are those with the educational attainment of bachelor's degree or higher, with 90.7% or 714 individuals in the labor force. Within the labor force, individuals with less than high school education have the highest percentage of unemployment, with 32.0% or 16 of them being unemployed.
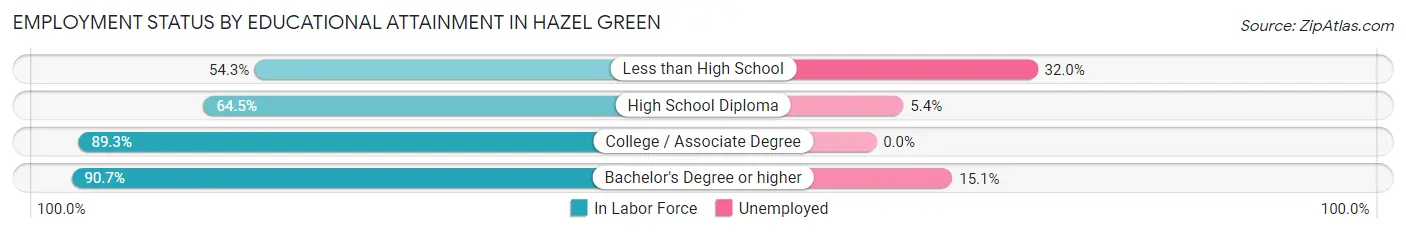
| Educational Attainment | In Labor Force | Unemployed |
| Less than High School | 50 (54.3%) | 29 (32.0%) |
| High School Diploma | 499 (64.5%) | 42 (5.4%) |
| College / Associate Degree | 335 (89.3%) | 0 (0.0%) |
| Bachelor's Degree or higher | 714 (90.7%) | 119 (15.1%) |
| Total | 1,598 (78.8%) | 191 (9.4%) |
Employment Occupations by Sex in Hazel Green
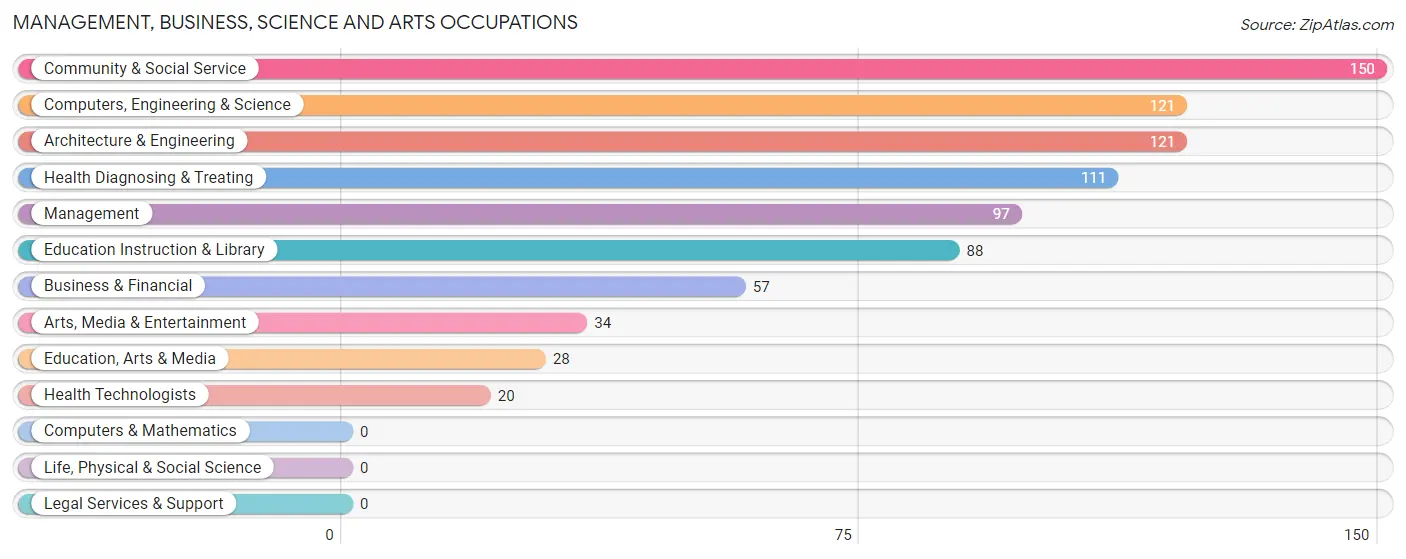
Management, Business, Science and Arts Occupations
The most common Management, Business, Science and Arts occupations in Hazel Green are Community & Social Service (150 | 8.5%), Computers, Engineering & Science (121 | 6.8%), Architecture & Engineering (121 | 6.8%), Health Diagnosing & Treating (111 | 6.3%), and Management (97 | 5.5%).
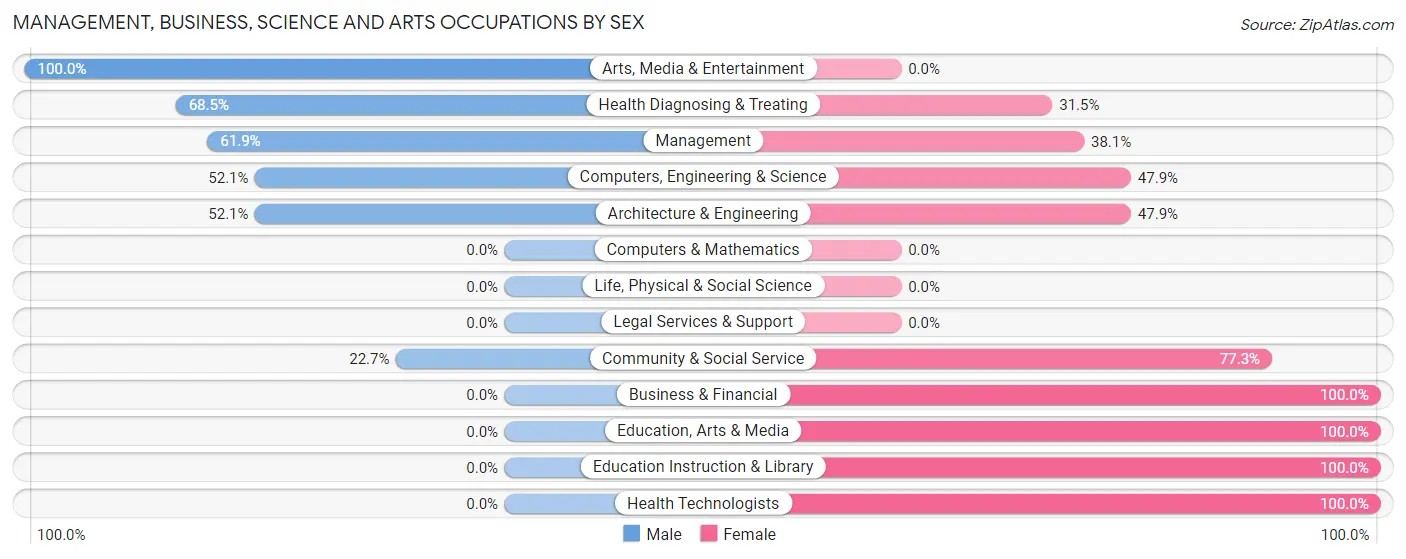
Management, Business, Science and Arts Occupations by Sex
Within the Management, Business, Science and Arts occupations in Hazel Green, the most male-oriented occupations are Arts, Media & Entertainment (100.0%), Health Diagnosing & Treating (68.5%), and Management (61.9%), while the most female-oriented occupations are Business & Financial (100.0%), Education, Arts & Media (100.0%), and Education Instruction & Library (100.0%).
| Occupation | Male | Female |
| Management | 60 (61.9%) | 37 (38.1%) |
| Business & Financial | 0 (0.0%) | 57 (100.0%) |
| Computers, Engineering & Science | 63 (52.1%) | 58 (47.9%) |
| Computers & Mathematics | 0 (0.0%) | 0 (0.0%) |
| Architecture & Engineering | 63 (52.1%) | 58 (47.9%) |
| Life, Physical & Social Science | 0 (0.0%) | 0 (0.0%) |
| Community & Social Service | 34 (22.7%) | 116 (77.3%) |
| Education, Arts & Media | 0 (0.0%) | 28 (100.0%) |
| Legal Services & Support | 0 (0.0%) | 0 (0.0%) |
| Education Instruction & Library | 0 (0.0%) | 88 (100.0%) |
| Arts, Media & Entertainment | 34 (100.0%) | 0 (0.0%) |
| Health Diagnosing & Treating | 76 (68.5%) | 35 (31.5%) |
| Health Technologists | 0 (0.0%) | 20 (100.0%) |
| Total (Category) | 233 (43.5%) | 303 (56.5%) |
| Total (Overall) | 852 (48.2%) | 917 (51.8%) |
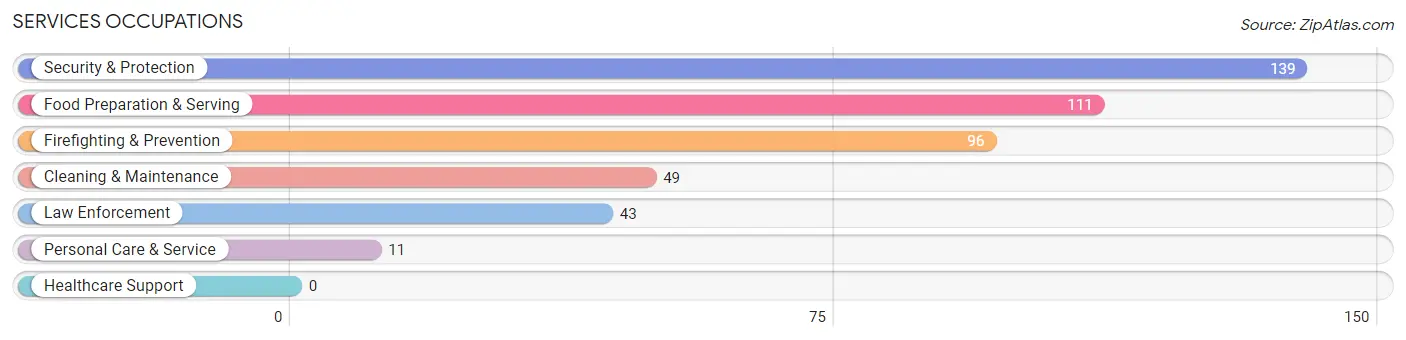
Services Occupations
The most common Services occupations in Hazel Green are Security & Protection (139 | 7.9%), Food Preparation & Serving (111 | 6.3%), Firefighting & Prevention (96 | 5.4%), Cleaning & Maintenance (49 | 2.8%), and Law Enforcement (43 | 2.4%).
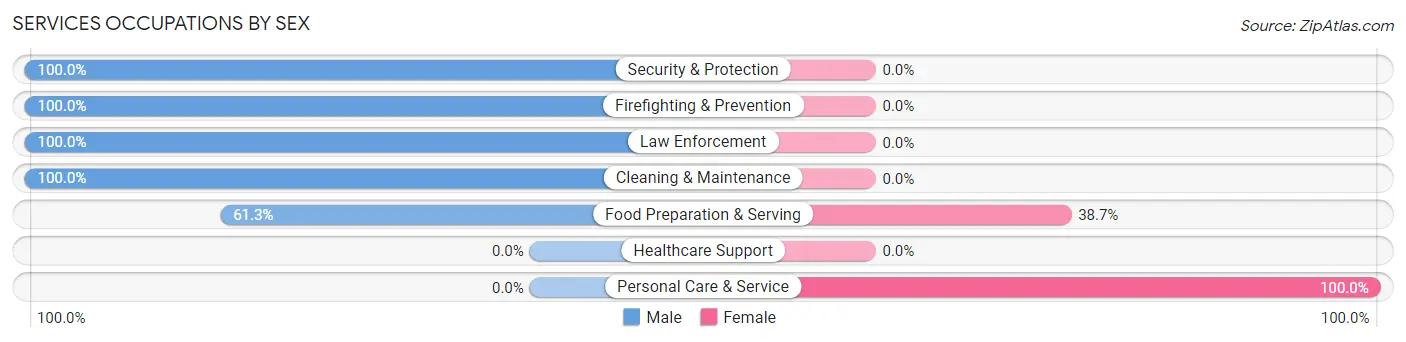
Services Occupations by Sex
Within the Services occupations in Hazel Green, the most male-oriented occupations are Security & Protection (100.0%), Firefighting & Prevention (100.0%), and Law Enforcement (100.0%), while the most female-oriented occupations are Personal Care & Service (100.0%), and Food Preparation & Serving (38.7%).
| Occupation | Male | Female |
| Healthcare Support | 0 (0.0%) | 0 (0.0%) |
| Security & Protection | 139 (100.0%) | 0 (0.0%) |
| Firefighting & Prevention | 96 (100.0%) | 0 (0.0%) |
| Law Enforcement | 43 (100.0%) | 0 (0.0%) |
| Food Preparation & Serving | 68 (61.3%) | 43 (38.7%) |
| Cleaning & Maintenance | 49 (100.0%) | 0 (0.0%) |
| Personal Care & Service | 0 (0.0%) | 11 (100.0%) |
| Total (Category) | 256 (82.6%) | 54 (17.4%) |
| Total (Overall) | 852 (48.2%) | 917 (51.8%) |
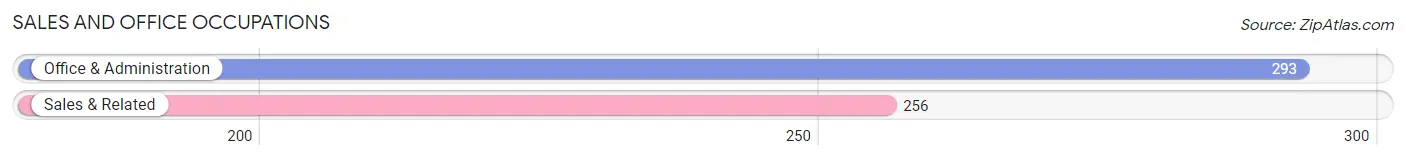
Sales and Office Occupations
The most common Sales and Office occupations in Hazel Green are Office & Administration (293 | 16.6%), and Sales & Related (256 | 14.5%).
Sales and Office Occupations by Sex
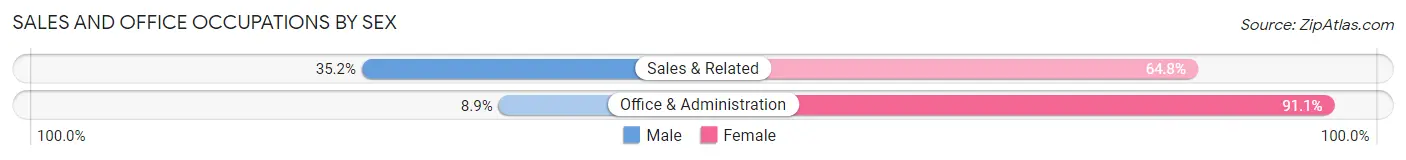
| Occupation | Male | Female |
| Sales & Related | 90 (35.2%) | 166 (64.8%) |
| Office & Administration | 26 (8.9%) | 267 (91.1%) |
| Total (Category) | 116 (21.1%) | 433 (78.9%) |
| Total (Overall) | 852 (48.2%) | 917 (51.8%) |
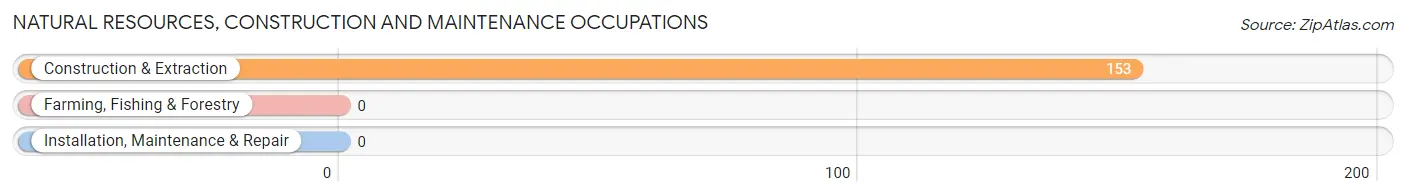
Natural Resources, Construction and Maintenance Occupations
The most common Natural Resources, Construction and Maintenance occupations in Hazel Green are , and Construction & Extraction (153 | 8.6%).
Natural Resources, Construction and Maintenance Occupations by Sex
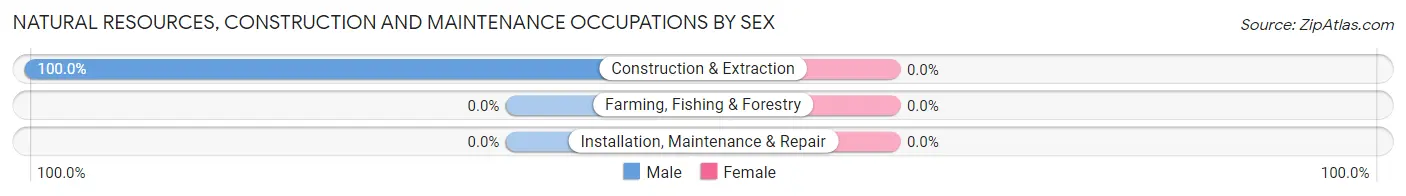
| Occupation | Male | Female |
| Farming, Fishing & Forestry | 0 (0.0%) | 0 (0.0%) |
| Construction & Extraction | 153 (100.0%) | 0 (0.0%) |
| Installation, Maintenance & Repair | 0 (0.0%) | 0 (0.0%) |
| Total (Category) | 153 (100.0%) | 0 (0.0%) |
| Total (Overall) | 852 (48.2%) | 917 (51.8%) |
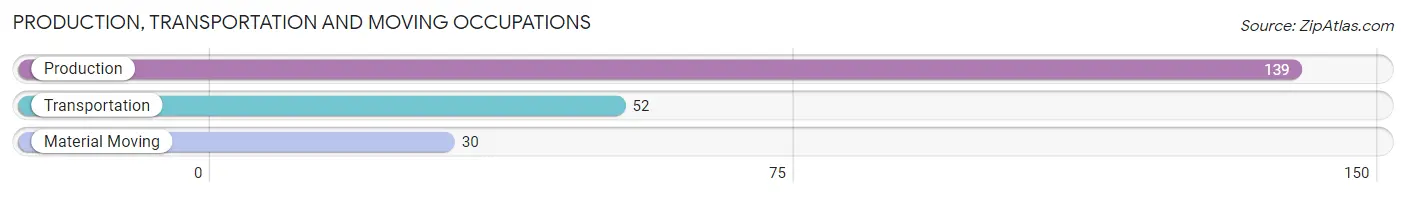
Production, Transportation and Moving Occupations
The most common Production, Transportation and Moving occupations in Hazel Green are Production (139 | 7.9%), Transportation (52 | 2.9%), and Material Moving (30 | 1.7%).
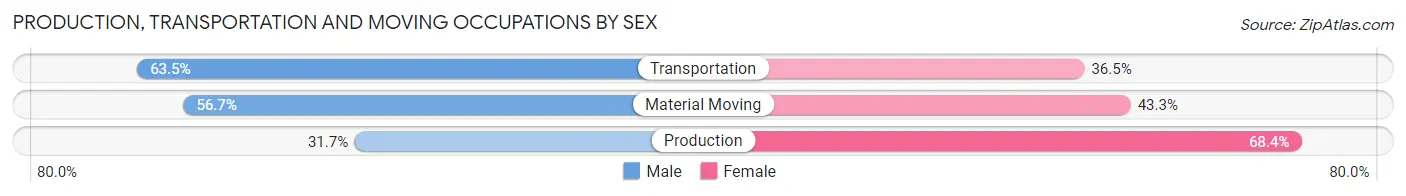
Production, Transportation and Moving Occupations by Sex
| Occupation | Male | Female |
| Production | 44 (31.7%) | 95 (68.3%) |
| Transportation | 33 (63.5%) | 19 (36.5%) |
| Material Moving | 17 (56.7%) | 13 (43.3%) |
| Total (Category) | 94 (42.5%) | 127 (57.5%) |
| Total (Overall) | 852 (48.2%) | 917 (51.8%) |
Employment Industries by Sex in Hazel Green
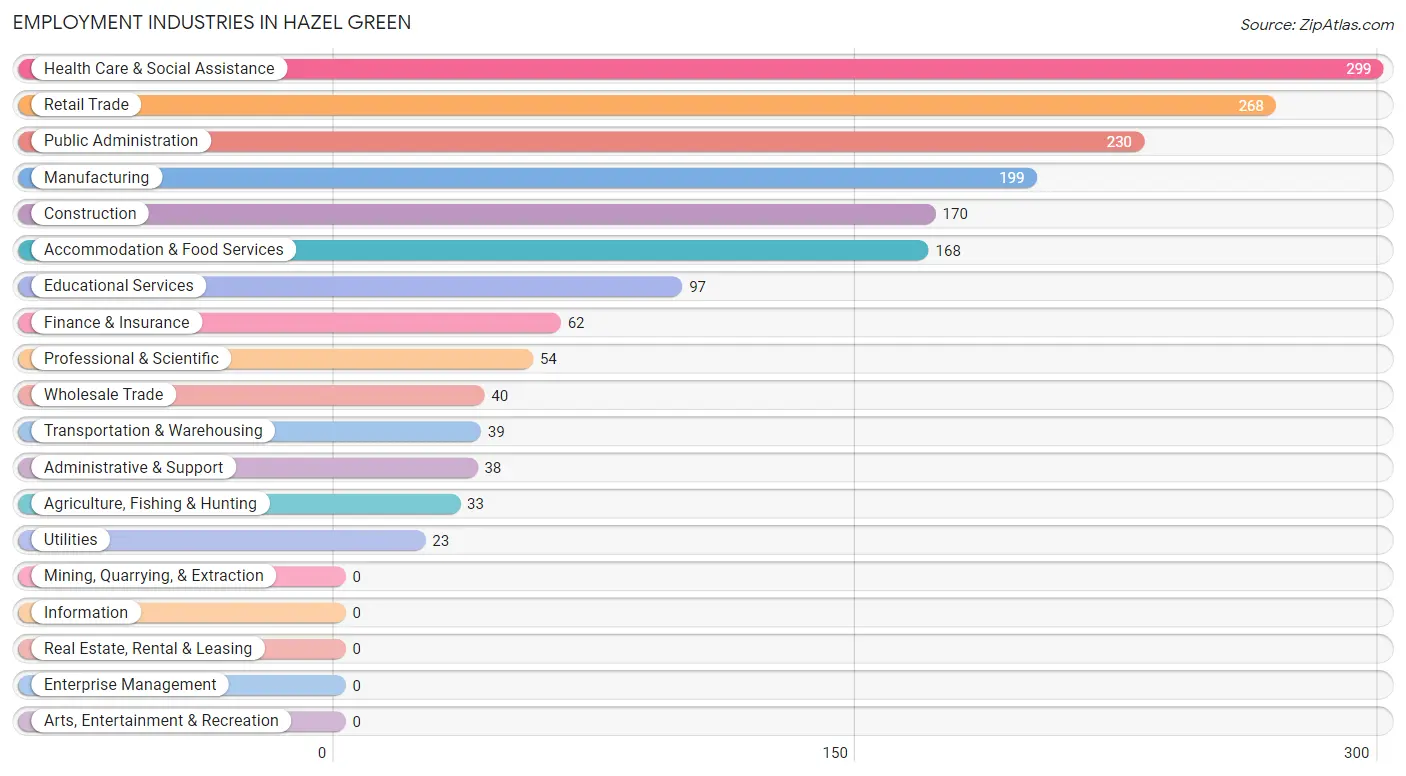
Employment Industries in Hazel Green
The major employment industries in Hazel Green include Health Care & Social Assistance (299 | 16.9%), Retail Trade (268 | 15.1%), Public Administration (230 | 13.0%), Manufacturing (199 | 11.3%), and Construction (170 | 9.6%).
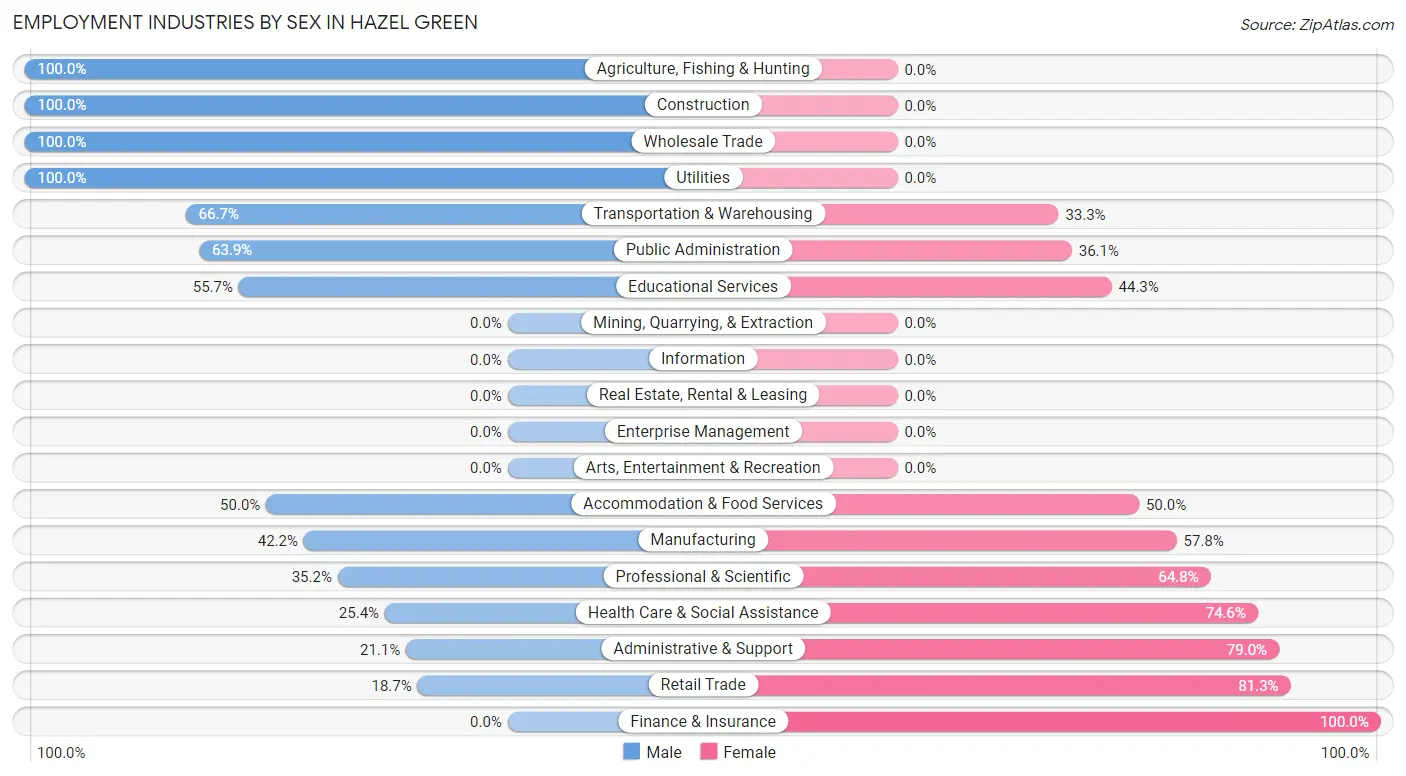
Employment Industries by Sex in Hazel Green
The Hazel Green industries that see more men than women are Agriculture, Fishing & Hunting (100.0%), Construction (100.0%), and Wholesale Trade (100.0%), whereas the industries that tend to have a higher number of women are Finance & Insurance (100.0%), Retail Trade (81.3%), and Administrative & Support (78.9%).
| Industry | Male | Female |
| Agriculture, Fishing & Hunting | 33 (100.0%) | 0 (0.0%) |
| Mining, Quarrying, & Extraction | 0 (0.0%) | 0 (0.0%) |
| Construction | 170 (100.0%) | 0 (0.0%) |
| Manufacturing | 84 (42.2%) | 115 (57.8%) |
| Wholesale Trade | 40 (100.0%) | 0 (0.0%) |
| Retail Trade | 50 (18.7%) | 218 (81.3%) |
| Transportation & Warehousing | 26 (66.7%) | 13 (33.3%) |
| Utilities | 23 (100.0%) | 0 (0.0%) |
| Information | 0 (0.0%) | 0 (0.0%) |
| Finance & Insurance | 0 (0.0%) | 62 (100.0%) |
| Real Estate, Rental & Leasing | 0 (0.0%) | 0 (0.0%) |
| Professional & Scientific | 19 (35.2%) | 35 (64.8%) |
| Enterprise Management | 0 (0.0%) | 0 (0.0%) |
| Administrative & Support | 8 (21.0%) | 30 (78.9%) |
| Educational Services | 54 (55.7%) | 43 (44.3%) |
| Health Care & Social Assistance | 76 (25.4%) | 223 (74.6%) |
| Arts, Entertainment & Recreation | 0 (0.0%) | 0 (0.0%) |
| Accommodation & Food Services | 84 (50.0%) | 84 (50.0%) |
| Public Administration | 147 (63.9%) | 83 (36.1%) |
| Total | 852 (48.2%) | 917 (51.8%) |
Education in Hazel Green
School Enrollment in Hazel Green
The most common levels of schooling among the 613 students in Hazel Green are middle school (182 | 29.7%), high school (161 | 26.3%), and college / undergraduate (105 | 17.1%).
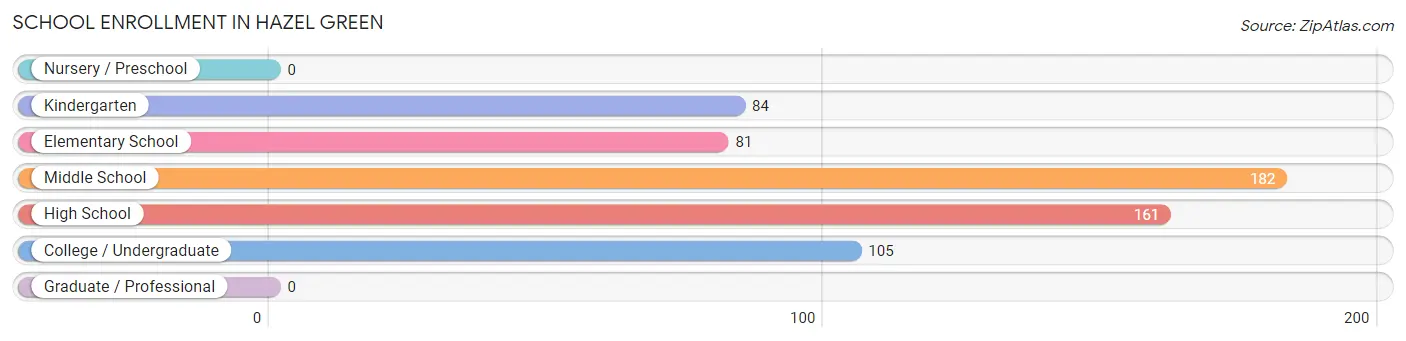
| School Level | # Students | % Students |
| Nursery / Preschool | 0 | 0.0% |
| Kindergarten | 84 | 13.7% |
| Elementary School | 81 | 13.2% |
| Middle School | 182 | 29.7% |
| High School | 161 | 26.3% |
| College / Undergraduate | 105 | 17.1% |
| Graduate / Professional | 0 | 0.0% |
| Total | 613 | 100.0% |
School Enrollment by Age by Funding Source in Hazel Green
Out of a total of 613 students who are enrolled in schools in Hazel Green, 19 (3.1%) attend a private institution, while the remaining 594 (96.9%) are enrolled in public schools. The age group of 20 to 24 year olds has the highest likelihood of being enrolled in private schools, with 19 (28.4% in the age bracket) enrolled. Conversely, the age group of 5 to 9 year old has the lowest likelihood of being enrolled in a private school, with 114 (100.0% in the age bracket) attending a public institution.
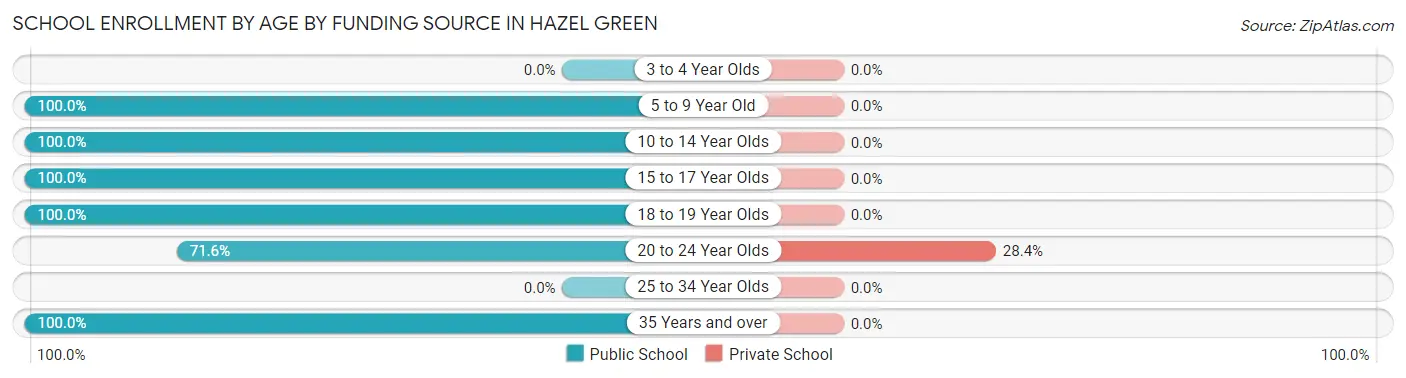
| Age Bracket | Public School | Private School |
| 3 to 4 Year Olds | 0 (0.0%) | 0 (0.0%) |
| 5 to 9 Year Old | 114 (100.0%) | 0 (0.0%) |
| 10 to 14 Year Olds | 233 (100.0%) | 0 (0.0%) |
| 15 to 17 Year Olds | 126 (100.0%) | 0 (0.0%) |
| 18 to 19 Year Olds | 35 (100.0%) | 0 (0.0%) |
| 20 to 24 Year Olds | 48 (71.6%) | 19 (28.4%) |
| 25 to 34 Year Olds | 0 (0.0%) | 0 (0.0%) |
| 35 Years and over | 38 (100.0%) | 0 (0.0%) |
| Total | 594 (96.9%) | 19 (3.1%) |
Educational Attainment by Field of Study in Hazel Green
Engineering (186 | 18.1%), arts & humanities (185 | 18.0%), business (180 | 17.5%), science & technology (97 | 9.5%), and bio, nature & agricultural (83 | 8.1%) are the most common fields of study among 1,026 individuals in Hazel Green who have obtained a bachelor's degree or higher.
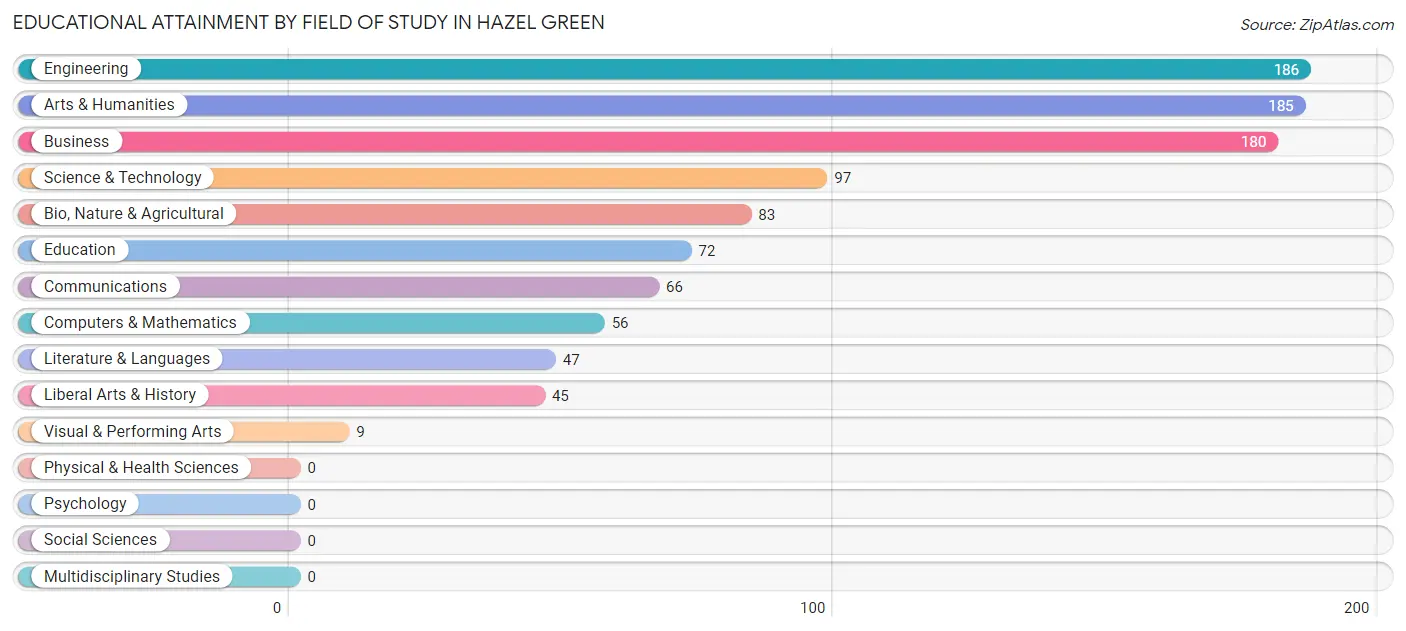
| Field of Study | # Graduates | % Graduates |
| Computers & Mathematics | 56 | 5.5% |
| Bio, Nature & Agricultural | 83 | 8.1% |
| Physical & Health Sciences | 0 | 0.0% |
| Psychology | 0 | 0.0% |
| Social Sciences | 0 | 0.0% |
| Engineering | 186 | 18.1% |
| Multidisciplinary Studies | 0 | 0.0% |
| Science & Technology | 97 | 9.5% |
| Business | 180 | 17.5% |
| Education | 72 | 7.0% |
| Literature & Languages | 47 | 4.6% |
| Liberal Arts & History | 45 | 4.4% |
| Visual & Performing Arts | 9 | 0.9% |
| Communications | 66 | 6.4% |
| Arts & Humanities | 185 | 18.0% |
| Total | 1,026 | 100.0% |
Transportation & Commute in Hazel Green
Vehicle Availability by Sex in Hazel Green
The most prevalent vehicle ownership categories in Hazel Green are males with 2 vehicles (461, accounting for 54.1%) and females with 2 vehicles (381, making up 52.0%).
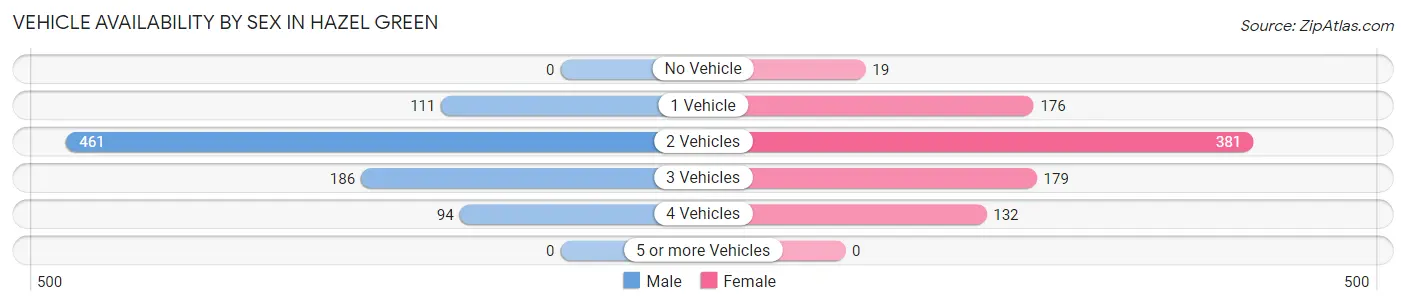
| Vehicles Available | Male | Female |
| No Vehicle | 0 (0.0%) | 19 (2.1%) |
| 1 Vehicle | 111 (13.0%) | 176 (19.8%) |
| 2 Vehicles | 461 (54.1%) | 381 (42.9%) |
| 3 Vehicles | 186 (21.8%) | 179 (20.2%) |
| 4 Vehicles | 94 (11.0%) | 132 (14.9%) |
| 5 or more Vehicles | 0 (0.0%) | 0 (0.0%) |
| Total | 852 (100.0%) | 887 (100.0%) |
Commute Time in Hazel Green
The most frequently occuring commute durations in Hazel Green are 30 to 34 minutes (520 commuters, 31.7%), 20 to 24 minutes (222 commuters, 13.5%), and 35 to 39 minutes (153 commuters, 9.3%).
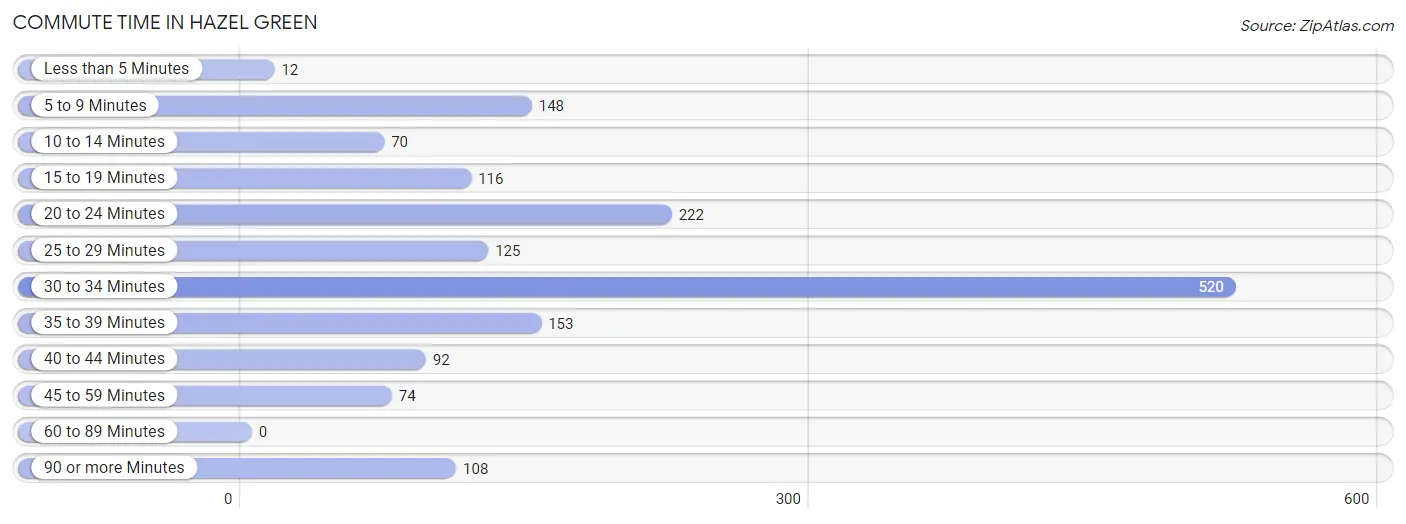
| Commute Time | # Commuters | % Commuters |
| Less than 5 Minutes | 12 | 0.7% |
| 5 to 9 Minutes | 148 | 9.0% |
| 10 to 14 Minutes | 70 | 4.3% |
| 15 to 19 Minutes | 116 | 7.1% |
| 20 to 24 Minutes | 222 | 13.5% |
| 25 to 29 Minutes | 125 | 7.6% |
| 30 to 34 Minutes | 520 | 31.7% |
| 35 to 39 Minutes | 153 | 9.3% |
| 40 to 44 Minutes | 92 | 5.6% |
| 45 to 59 Minutes | 74 | 4.5% |
| 60 to 89 Minutes | 0 | 0.0% |
| 90 or more Minutes | 108 | 6.6% |
Commute Time by Sex in Hazel Green
The most common commute times in Hazel Green are 30 to 34 minutes (349 commuters, 42.5%) for males and 20 to 24 minutes (173 commuters, 21.1%) for females.
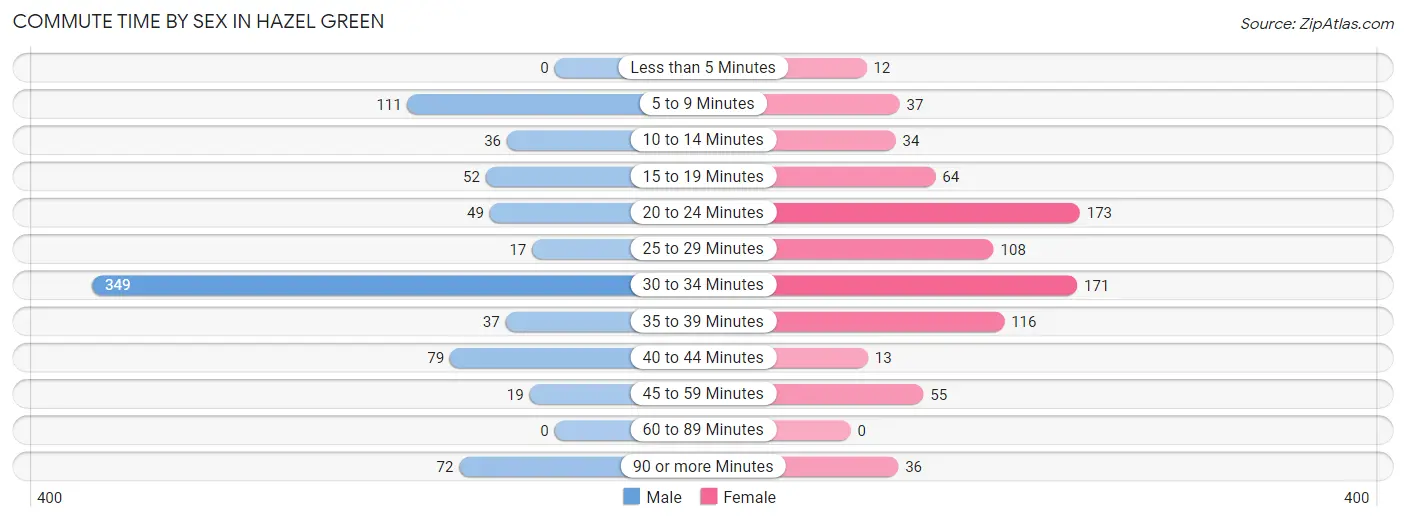
| Commute Time | Male | Female |
| Less than 5 Minutes | 0 (0.0%) | 12 (1.5%) |
| 5 to 9 Minutes | 111 (13.5%) | 37 (4.5%) |
| 10 to 14 Minutes | 36 (4.4%) | 34 (4.2%) |
| 15 to 19 Minutes | 52 (6.3%) | 64 (7.8%) |
| 20 to 24 Minutes | 49 (6.0%) | 173 (21.1%) |
| 25 to 29 Minutes | 17 (2.1%) | 108 (13.2%) |
| 30 to 34 Minutes | 349 (42.5%) | 171 (20.9%) |
| 35 to 39 Minutes | 37 (4.5%) | 116 (14.2%) |
| 40 to 44 Minutes | 79 (9.6%) | 13 (1.6%) |
| 45 to 59 Minutes | 19 (2.3%) | 55 (6.7%) |
| 60 to 89 Minutes | 0 (0.0%) | 0 (0.0%) |
| 90 or more Minutes | 72 (8.8%) | 36 (4.4%) |
Time of Departure to Work by Sex in Hazel Green
The most frequent times of departure to work in Hazel Green are 7:30 AM to 7:59 AM (181, 22.1%) for males and 7:00 AM to 7:29 AM (238, 29.1%) for females.
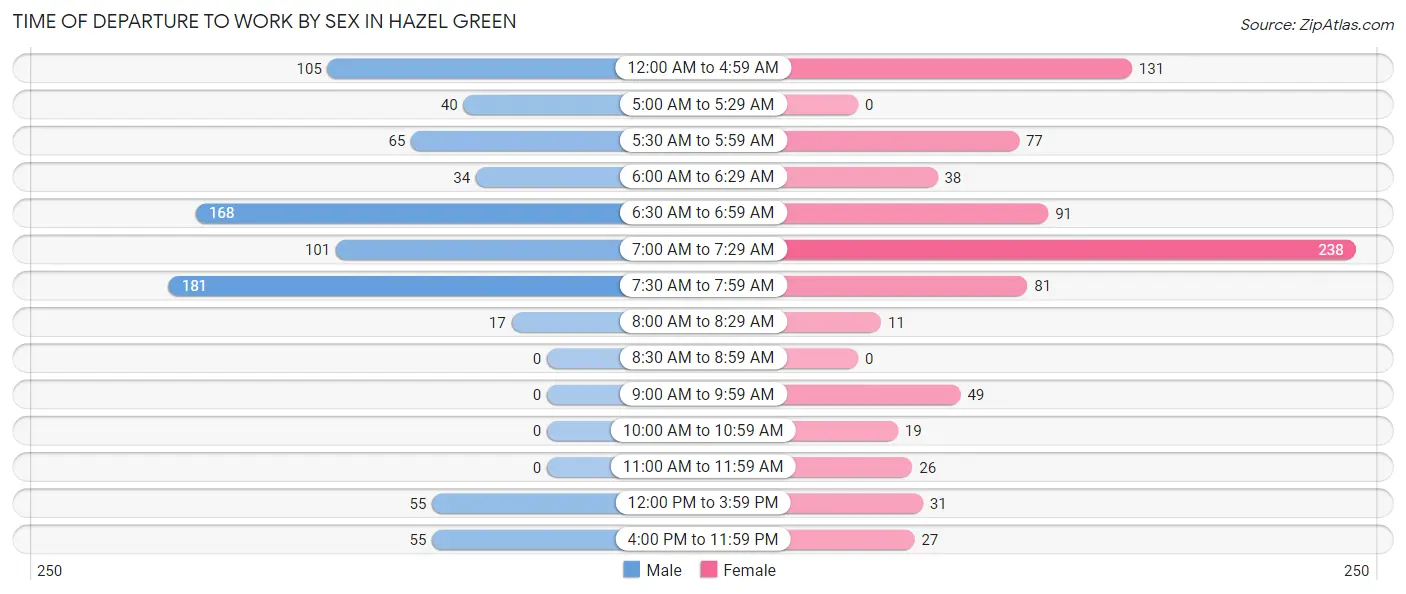
| Time of Departure | Male | Female |
| 12:00 AM to 4:59 AM | 105 (12.8%) | 131 (16.0%) |
| 5:00 AM to 5:29 AM | 40 (4.9%) | 0 (0.0%) |
| 5:30 AM to 5:59 AM | 65 (7.9%) | 77 (9.4%) |
| 6:00 AM to 6:29 AM | 34 (4.1%) | 38 (4.6%) |
| 6:30 AM to 6:59 AM | 168 (20.5%) | 91 (11.1%) |
| 7:00 AM to 7:29 AM | 101 (12.3%) | 238 (29.1%) |
| 7:30 AM to 7:59 AM | 181 (22.1%) | 81 (9.9%) |
| 8:00 AM to 8:29 AM | 17 (2.1%) | 11 (1.3%) |
| 8:30 AM to 8:59 AM | 0 (0.0%) | 0 (0.0%) |
| 9:00 AM to 9:59 AM | 0 (0.0%) | 49 (6.0%) |
| 10:00 AM to 10:59 AM | 0 (0.0%) | 19 (2.3%) |
| 11:00 AM to 11:59 AM | 0 (0.0%) | 26 (3.2%) |
| 12:00 PM to 3:59 PM | 55 (6.7%) | 31 (3.8%) |
| 4:00 PM to 11:59 PM | 55 (6.7%) | 27 (3.3%) |
| Total | 821 (100.0%) | 819 (100.0%) |
Housing Occupancy in Hazel Green
Occupancy by Ownership in Hazel Green
Of the total 1,448 dwellings in Hazel Green, owner-occupied units account for 1,094 (75.5%), while renter-occupied units make up 354 (24.4%).
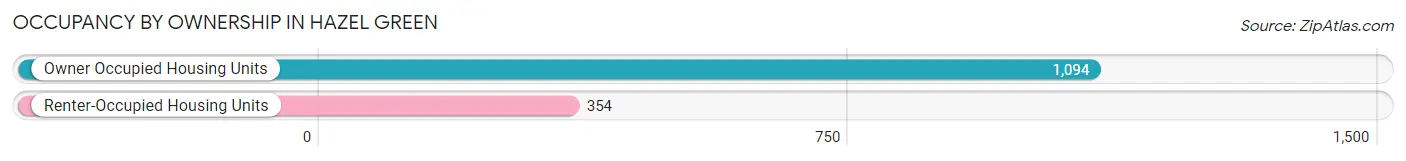
| Occupancy | # Housing Units | % Housing Units |
| Owner Occupied Housing Units | 1,094 | 75.5% |
| Renter-Occupied Housing Units | 354 | 24.4% |
| Total Occupied Housing Units | 1,448 | 100.0% |
Occupancy by Household Size in Hazel Green
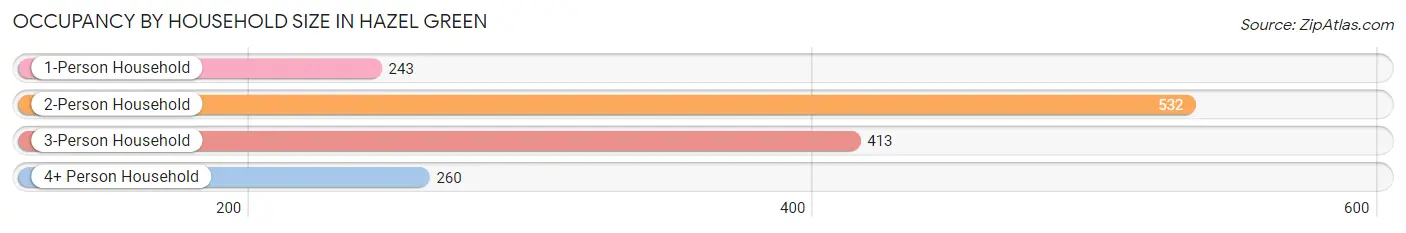
| Household Size | # Housing Units | % Housing Units |
| 1-Person Household | 243 | 16.8% |
| 2-Person Household | 532 | 36.7% |
| 3-Person Household | 413 | 28.5% |
| 4+ Person Household | 260 | 18.0% |
| Total Housing Units | 1,448 | 100.0% |
Occupancy by Ownership by Household Size in Hazel Green
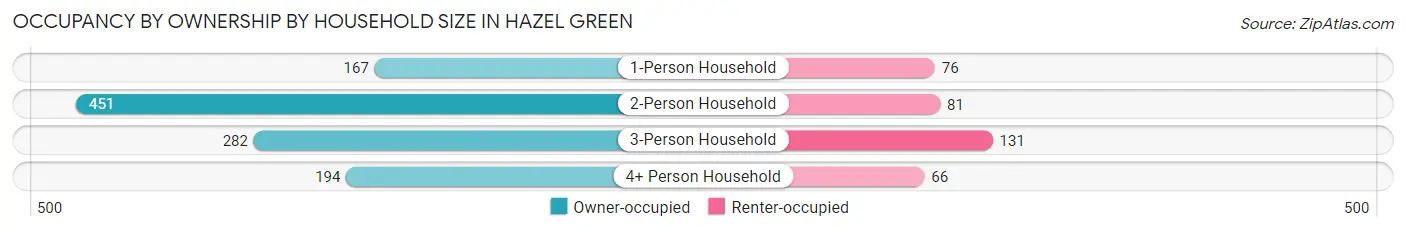
| Household Size | Owner-occupied | Renter-occupied |
| 1-Person Household | 167 (68.7%) | 76 (31.3%) |
| 2-Person Household | 451 (84.8%) | 81 (15.2%) |
| 3-Person Household | 282 (68.3%) | 131 (31.7%) |
| 4+ Person Household | 194 (74.6%) | 66 (25.4%) |
| Total Housing Units | 1,094 (75.5%) | 354 (24.4%) |
Occupancy by Educational Attainment in Hazel Green
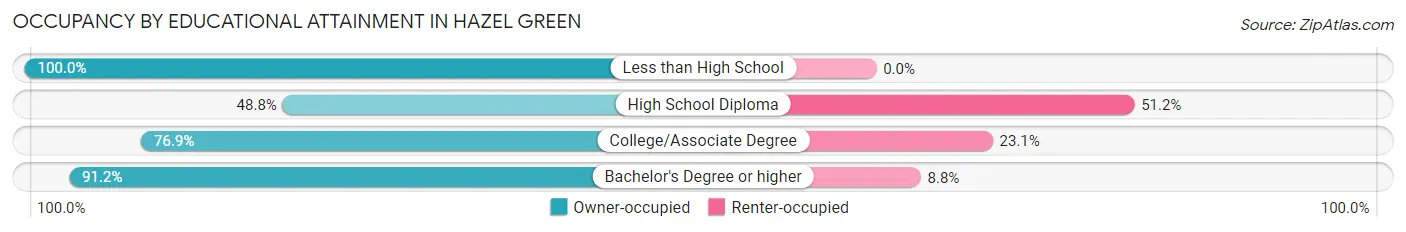
| Household Size | Owner-occupied | Renter-occupied |
| Less than High School | 75 (100.0%) | 0 (0.0%) |
| High School Diploma | 211 (48.8%) | 221 (51.2%) |
| College/Associate Degree | 270 (76.9%) | 81 (23.1%) |
| Bachelor's Degree or higher | 538 (91.2%) | 52 (8.8%) |
Occupancy by Age of Householder in Hazel Green
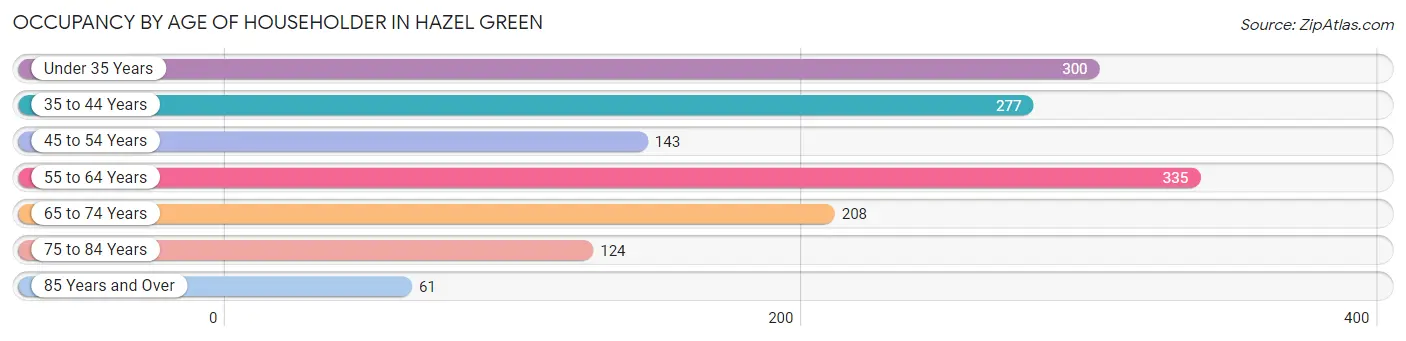
| Age Bracket | # Households | % Households |
| Under 35 Years | 300 | 20.7% |
| 35 to 44 Years | 277 | 19.1% |
| 45 to 54 Years | 143 | 9.9% |
| 55 to 64 Years | 335 | 23.1% |
| 65 to 74 Years | 208 | 14.4% |
| 75 to 84 Years | 124 | 8.6% |
| 85 Years and Over | 61 | 4.2% |
| Total | 1,448 | 100.0% |
Housing Finances in Hazel Green
Median Income by Occupancy in Hazel Green
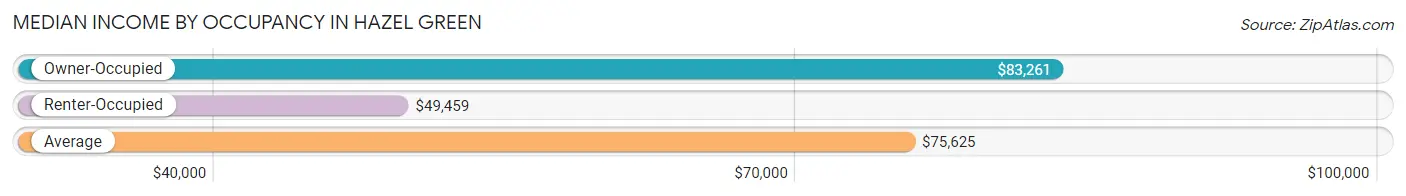
| Occupancy Type | # Households | Median Income |
| Owner-Occupied | 1,094 (75.5%) | $83,261 |
| Renter-Occupied | 354 (24.4%) | $49,459 |
| Average | 1,448 (100.0%) | $75,625 |
Occupancy by Householder Income Bracket in Hazel Green
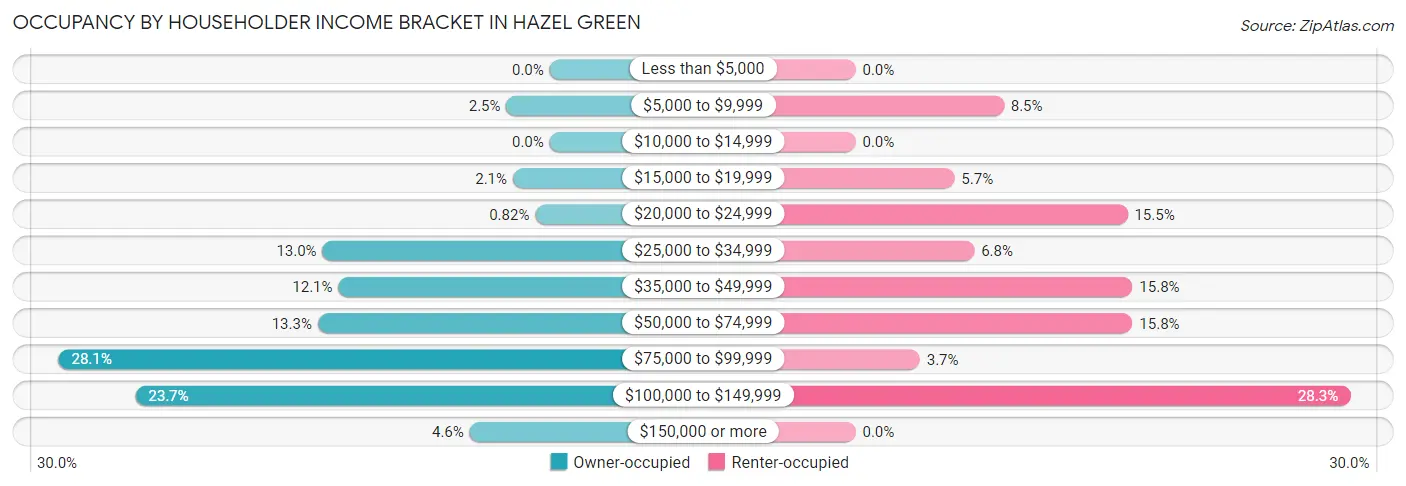
| Income Bracket | Owner-occupied | Renter-occupied |
| Less than $5,000 | 0 (0.0%) | 0 (0.0%) |
| $5,000 to $9,999 | 27 (2.5%) | 30 (8.5%) |
| $10,000 to $14,999 | 0 (0.0%) | 0 (0.0%) |
| $15,000 to $19,999 | 23 (2.1%) | 20 (5.7%) |
| $20,000 to $24,999 | 9 (0.8%) | 55 (15.5%) |
| $25,000 to $34,999 | 142 (13.0%) | 24 (6.8%) |
| $35,000 to $49,999 | 132 (12.1%) | 56 (15.8%) |
| $50,000 to $74,999 | 145 (13.3%) | 56 (15.8%) |
| $75,000 to $99,999 | 307 (28.1%) | 13 (3.7%) |
| $100,000 to $149,999 | 259 (23.7%) | 100 (28.2%) |
| $150,000 or more | 50 (4.6%) | 0 (0.0%) |
| Total | 1,094 (100.0%) | 354 (100.0%) |
Monthly Housing Cost Tiers in Hazel Green
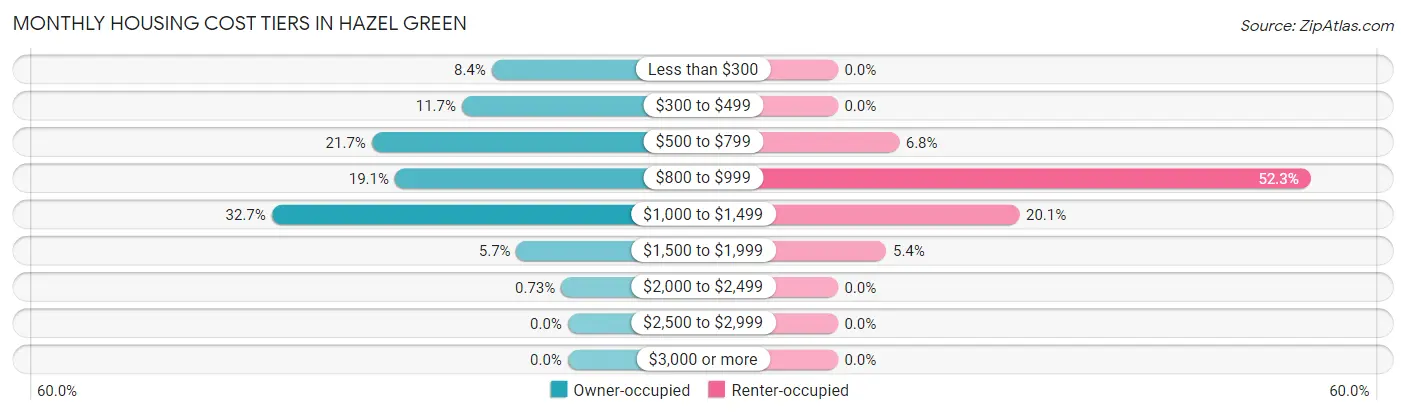
| Monthly Cost | Owner-occupied | Renter-occupied |
| Less than $300 | 92 (8.4%) | 0 (0.0%) |
| $300 to $499 | 128 (11.7%) | 0 (0.0%) |
| $500 to $799 | 237 (21.7%) | 24 (6.8%) |
| $800 to $999 | 209 (19.1%) | 185 (52.3%) |
| $1,000 to $1,499 | 358 (32.7%) | 71 (20.1%) |
| $1,500 to $1,999 | 62 (5.7%) | 19 (5.4%) |
| $2,000 to $2,499 | 8 (0.7%) | 0 (0.0%) |
| $2,500 to $2,999 | 0 (0.0%) | 0 (0.0%) |
| $3,000 or more | 0 (0.0%) | 0 (0.0%) |
| Total | 1,094 (100.0%) | 354 (100.0%) |
Physical Housing Characteristics in Hazel Green
Housing Structures in Hazel Green
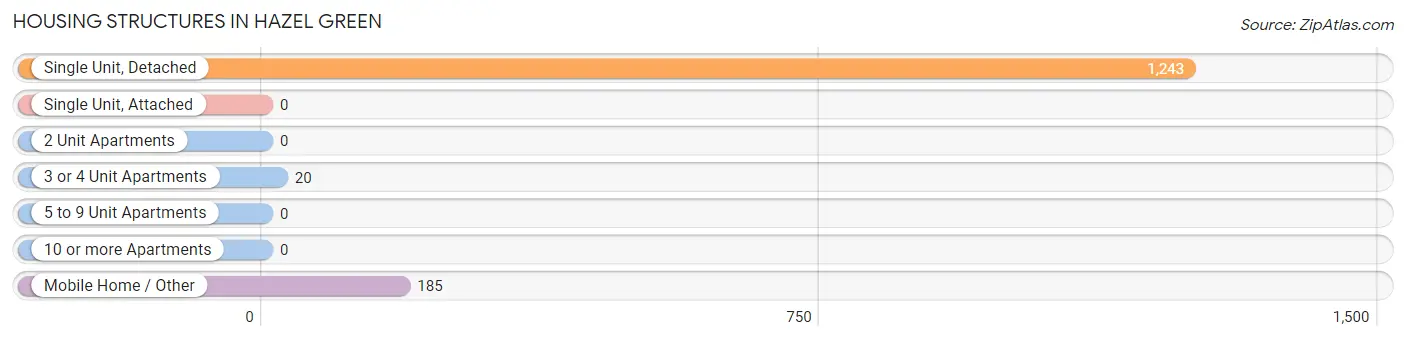
| Structure Type | # Housing Units | % Housing Units |
| Single Unit, Detached | 1,243 | 85.8% |
| Single Unit, Attached | 0 | 0.0% |
| 2 Unit Apartments | 0 | 0.0% |
| 3 or 4 Unit Apartments | 20 | 1.4% |
| 5 to 9 Unit Apartments | 0 | 0.0% |
| 10 or more Apartments | 0 | 0.0% |
| Mobile Home / Other | 185 | 12.8% |
| Total | 1,448 | 100.0% |
Housing Structures by Occupancy in Hazel Green
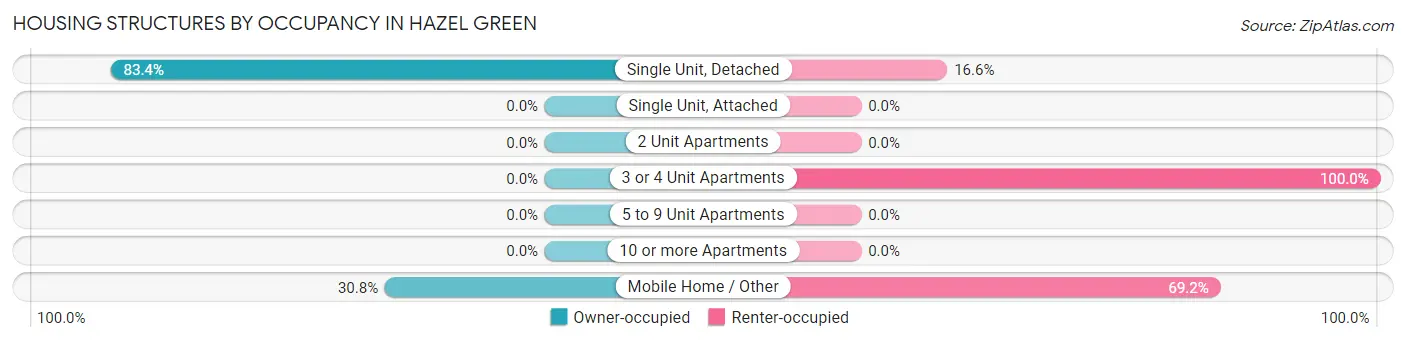
| Structure Type | Owner-occupied | Renter-occupied |
| Single Unit, Detached | 1,037 (83.4%) | 206 (16.6%) |
| Single Unit, Attached | 0 (0.0%) | 0 (0.0%) |
| 2 Unit Apartments | 0 (0.0%) | 0 (0.0%) |
| 3 or 4 Unit Apartments | 0 (0.0%) | 20 (100.0%) |
| 5 to 9 Unit Apartments | 0 (0.0%) | 0 (0.0%) |
| 10 or more Apartments | 0 (0.0%) | 0 (0.0%) |
| Mobile Home / Other | 57 (30.8%) | 128 (69.2%) |
| Total | 1,094 (75.5%) | 354 (24.4%) |
Housing Structures by Number of Rooms in Hazel Green
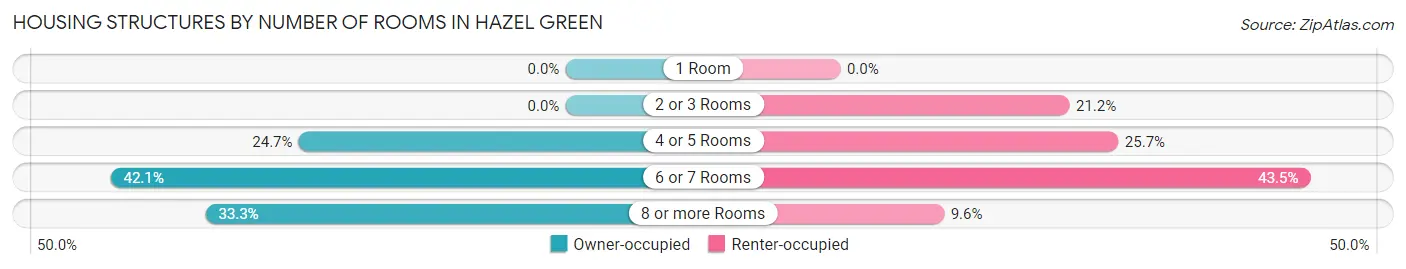
| Number of Rooms | Owner-occupied | Renter-occupied |
| 1 Room | 0 (0.0%) | 0 (0.0%) |
| 2 or 3 Rooms | 0 (0.0%) | 75 (21.2%) |
| 4 or 5 Rooms | 270 (24.7%) | 91 (25.7%) |
| 6 or 7 Rooms | 460 (42.0%) | 154 (43.5%) |
| 8 or more Rooms | 364 (33.3%) | 34 (9.6%) |
| Total | 1,094 (100.0%) | 354 (100.0%) |
Housing Structure by Heating Type in Hazel Green
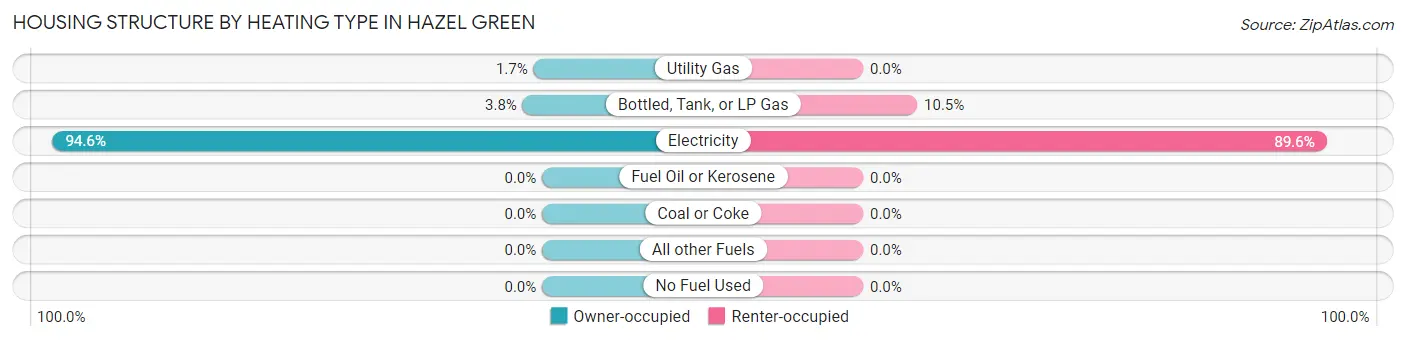
| Heating Type | Owner-occupied | Renter-occupied |
| Utility Gas | 18 (1.7%) | 0 (0.0%) |
| Bottled, Tank, or LP Gas | 41 (3.7%) | 37 (10.4%) |
| Electricity | 1,035 (94.6%) | 317 (89.5%) |
| Fuel Oil or Kerosene | 0 (0.0%) | 0 (0.0%) |
| Coal or Coke | 0 (0.0%) | 0 (0.0%) |
| All other Fuels | 0 (0.0%) | 0 (0.0%) |
| No Fuel Used | 0 (0.0%) | 0 (0.0%) |
| Total | 1,094 (100.0%) | 354 (100.0%) |
Household Vehicle Usage in Hazel Green
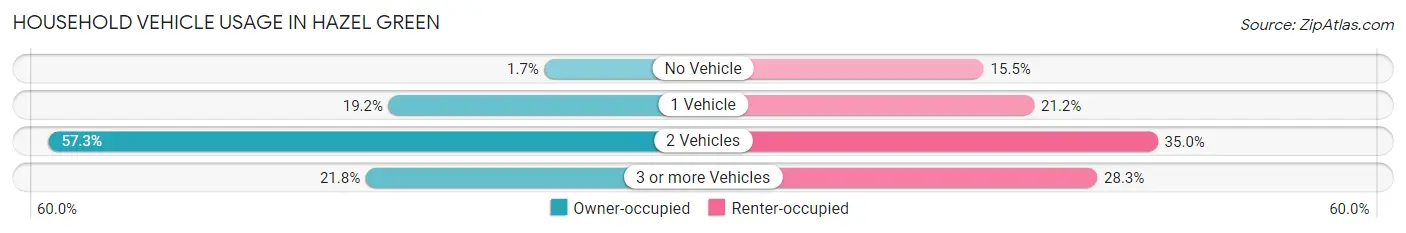
| Vehicles per Household | Owner-occupied | Renter-occupied |
| No Vehicle | 19 (1.7%) | 55 (15.5%) |
| 1 Vehicle | 210 (19.2%) | 75 (21.2%) |
| 2 Vehicles | 627 (57.3%) | 124 (35.0%) |
| 3 or more Vehicles | 238 (21.8%) | 100 (28.2%) |
| Total | 1,094 (100.0%) | 354 (100.0%) |
Real Estate & Mortgages in Hazel Green
Real Estate and Mortgage Overview in Hazel Green
| Characteristic | Without Mortgage | With Mortgage |
| Housing Units | 313 | 781 |
| Median Property Value | $154,300 | $164,600 |
| Median Household Income | $77,396 | $29 |
| Monthly Housing Costs | $470 | $0 |
| Real Estate Taxes | $539 | $73 |
Property Value by Mortgage Status in Hazel Green
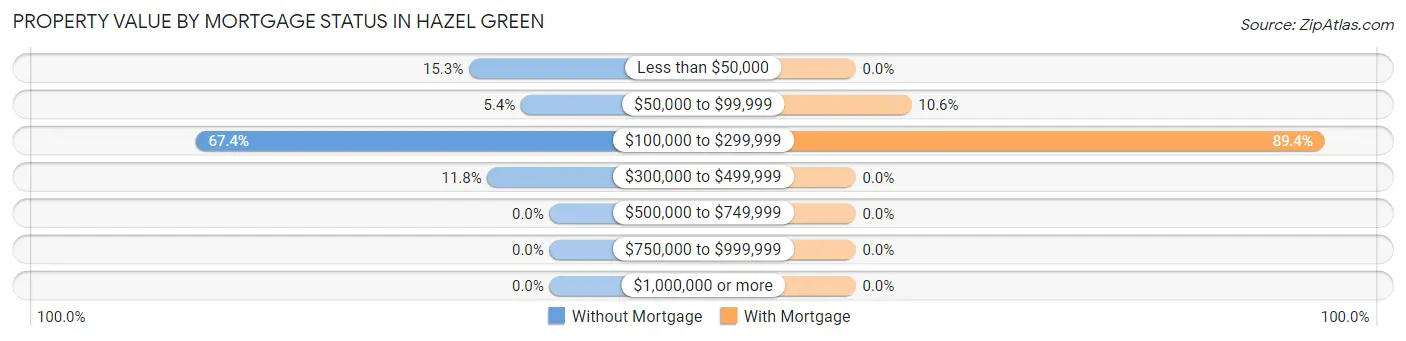
| Property Value | Without Mortgage | With Mortgage |
| Less than $50,000 | 48 (15.3%) | 0 (0.0%) |
| $50,000 to $99,999 | 17 (5.4%) | 83 (10.6%) |
| $100,000 to $299,999 | 211 (67.4%) | 698 (89.4%) |
| $300,000 to $499,999 | 37 (11.8%) | 0 (0.0%) |
| $500,000 to $749,999 | 0 (0.0%) | 0 (0.0%) |
| $750,000 to $999,999 | 0 (0.0%) | 0 (0.0%) |
| $1,000,000 or more | 0 (0.0%) | 0 (0.0%) |
| Total | 313 (100.0%) | 781 (100.0%) |
Household Income by Mortgage Status in Hazel Green
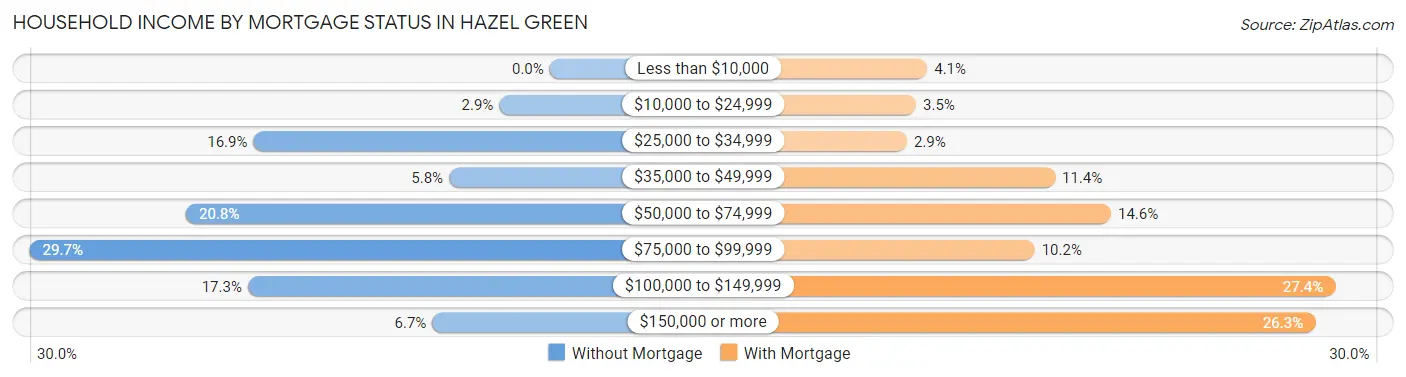
| Household Income | Without Mortgage | With Mortgage |
| Less than $10,000 | 0 (0.0%) | 32 (4.1%) |
| $10,000 to $24,999 | 9 (2.9%) | 27 (3.5%) |
| $25,000 to $34,999 | 53 (16.9%) | 23 (2.9%) |
| $35,000 to $49,999 | 18 (5.8%) | 89 (11.4%) |
| $50,000 to $74,999 | 65 (20.8%) | 114 (14.6%) |
| $75,000 to $99,999 | 93 (29.7%) | 80 (10.2%) |
| $100,000 to $149,999 | 54 (17.2%) | 214 (27.4%) |
| $150,000 or more | 21 (6.7%) | 205 (26.3%) |
| Total | 313 (100.0%) | 781 (100.0%) |
Property Value to Household Income Ratio in Hazel Green
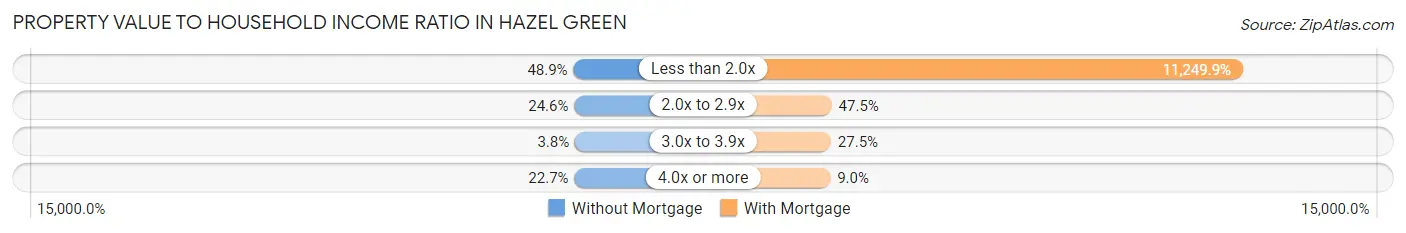
| Value-to-Income Ratio | Without Mortgage | With Mortgage |
| Less than 2.0x | 153 (48.9%) | 87,862 (11,249.9%) |
| 2.0x to 2.9x | 77 (24.6%) | 371 (47.5%) |
| 3.0x to 3.9x | 12 (3.8%) | 215 (27.5%) |
| 4.0x or more | 71 (22.7%) | 70 (9.0%) |
| Total | 313 (100.0%) | 781 (100.0%) |
Real Estate Taxes by Mortgage Status in Hazel Green
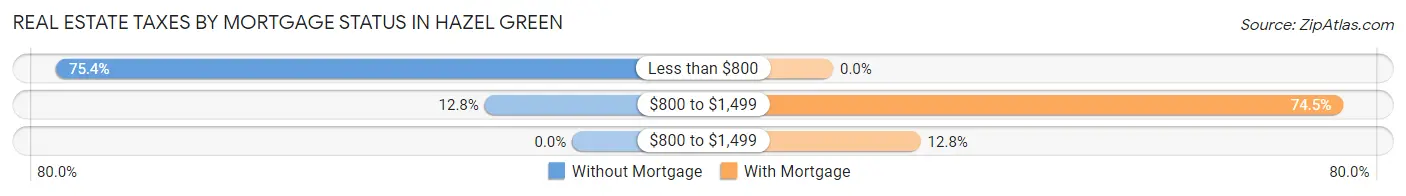
| Property Taxes | Without Mortgage | With Mortgage |
| Less than $800 | 236 (75.4%) | 0 (0.0%) |
| $800 to $1,499 | 40 (12.8%) | 582 (74.5%) |
| $800 to $1,499 | 0 (0.0%) | 100 (12.8%) |
| Total | 313 (100.0%) | 781 (100.0%) |
Health & Disability in Hazel Green
Health Insurance Coverage by Age in Hazel Green
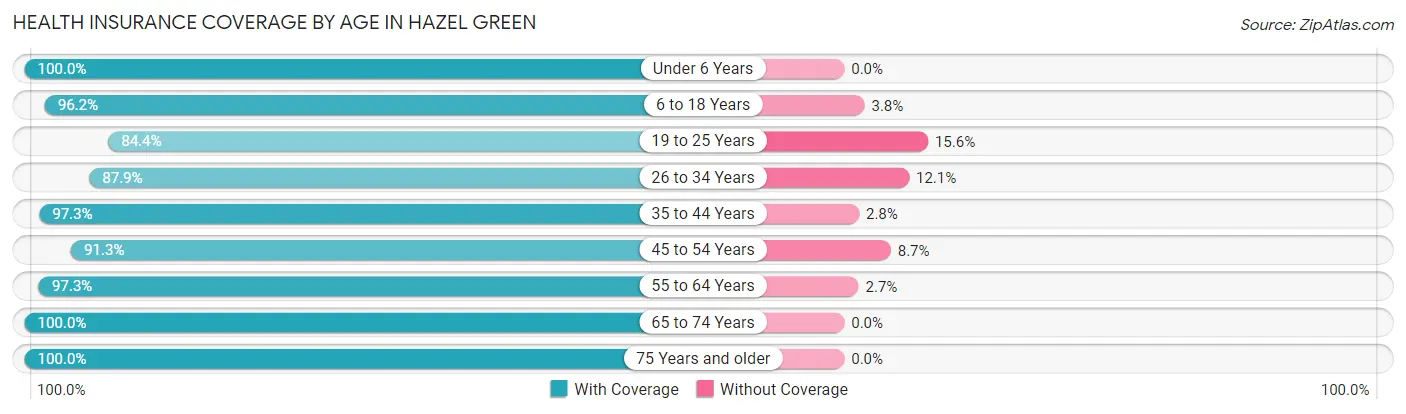
| Age Bracket | With Coverage | Without Coverage |
| Under 6 Years | 602 (100.0%) | 0 (0.0%) |
| 6 to 18 Years | 460 (96.2%) | 18 (3.8%) |
| 19 to 25 Years | 200 (84.4%) | 37 (15.6%) |
| 26 to 34 Years | 444 (87.9%) | 61 (12.1%) |
| 35 to 44 Years | 672 (97.3%) | 19 (2.8%) |
| 45 to 54 Years | 179 (91.3%) | 17 (8.7%) |
| 55 to 64 Years | 584 (97.3%) | 16 (2.7%) |
| 65 to 74 Years | 314 (100.0%) | 0 (0.0%) |
| 75 Years and older | 288 (100.0%) | 0 (0.0%) |
| Total | 3,743 (95.7%) | 168 (4.3%) |
Health Insurance Coverage by Citizenship Status in Hazel Green
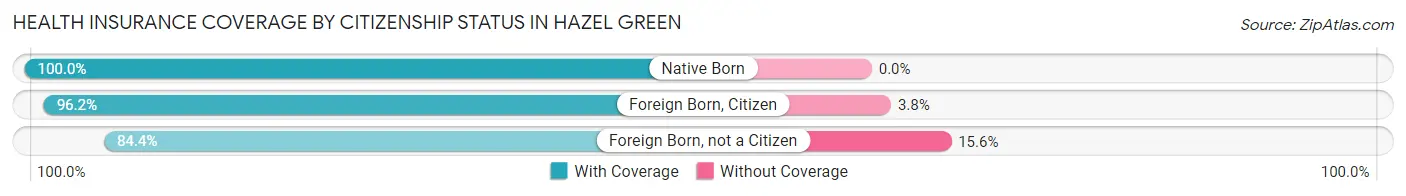
| Citizenship Status | With Coverage | Without Coverage |
| Native Born | 602 (100.0%) | 0 (0.0%) |
| Foreign Born, Citizen | 460 (96.2%) | 18 (3.8%) |
| Foreign Born, not a Citizen | 200 (84.4%) | 37 (15.6%) |
Health Insurance Coverage by Household Income in Hazel Green
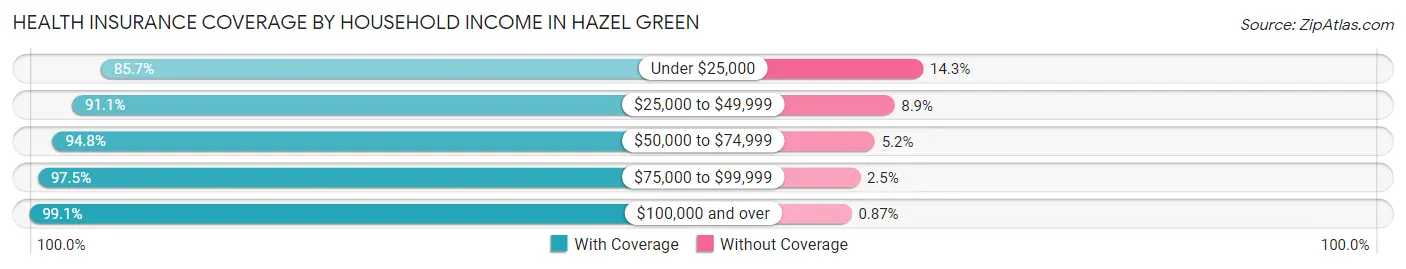
| Household Income | With Coverage | Without Coverage |
| Under $25,000 | 270 (85.7%) | 45 (14.3%) |
| $25,000 to $49,999 | 563 (91.1%) | 55 (8.9%) |
| $50,000 to $74,999 | 506 (94.8%) | 28 (5.2%) |
| $75,000 to $99,999 | 1,144 (97.5%) | 29 (2.5%) |
| $100,000 and over | 1,260 (99.1%) | 11 (0.9%) |
Public vs Private Health Insurance Coverage by Age in Hazel Green
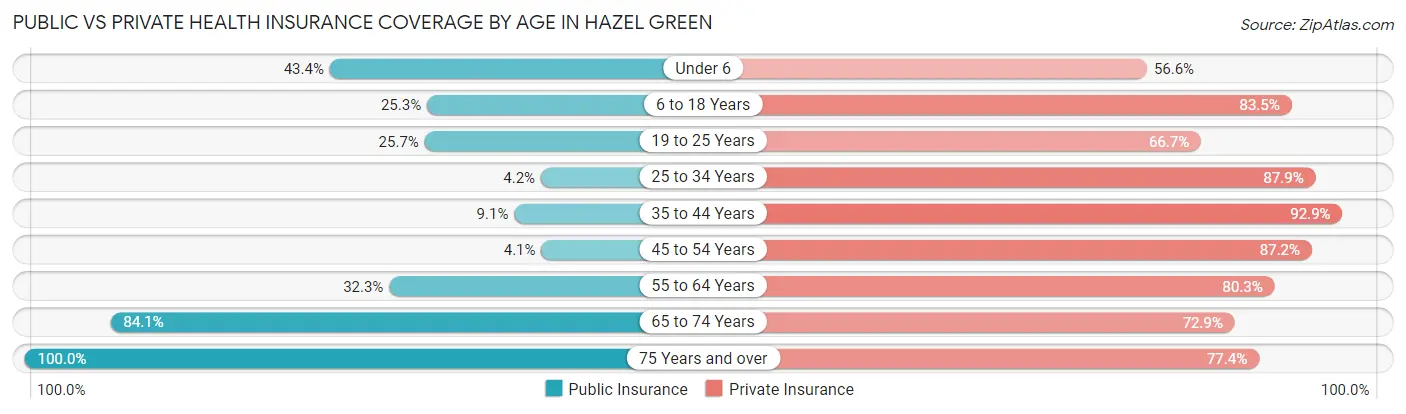
| Age Bracket | Public Insurance | Private Insurance |
| Under 6 | 261 (43.4%) | 341 (56.6%) |
| 6 to 18 Years | 121 (25.3%) | 399 (83.5%) |
| 19 to 25 Years | 61 (25.7%) | 158 (66.7%) |
| 25 to 34 Years | 21 (4.2%) | 444 (87.9%) |
| 35 to 44 Years | 63 (9.1%) | 642 (92.9%) |
| 45 to 54 Years | 8 (4.1%) | 171 (87.2%) |
| 55 to 64 Years | 194 (32.3%) | 482 (80.3%) |
| 65 to 74 Years | 264 (84.1%) | 229 (72.9%) |
| 75 Years and over | 288 (100.0%) | 223 (77.4%) |
| Total | 1,281 (32.8%) | 3,089 (79.0%) |
Disability Status by Sex by Age in Hazel Green
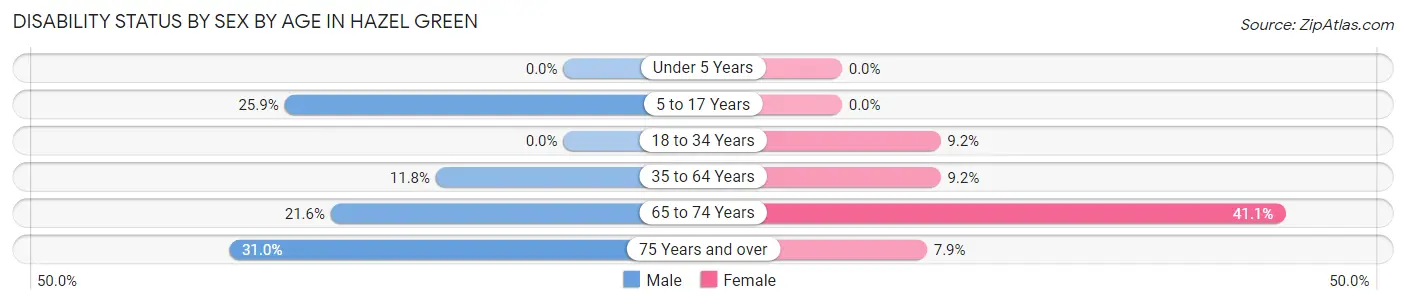
| Age Bracket | Male | Female |
| Under 5 Years | 0 (0.0%) | 0 (0.0%) |
| 5 to 17 Years | 59 (25.9%) | 0 (0.0%) |
| 18 to 34 Years | 0 (0.0%) | 42 (9.1%) |
| 35 to 64 Years | 79 (11.8%) | 75 (9.2%) |
| 65 to 74 Years | 30 (21.6%) | 72 (41.1%) |
| 75 Years and over | 54 (31.0%) | 9 (7.9%) |
Disability Class by Sex by Age in Hazel Green
Disability Class: Hearing Difficulty
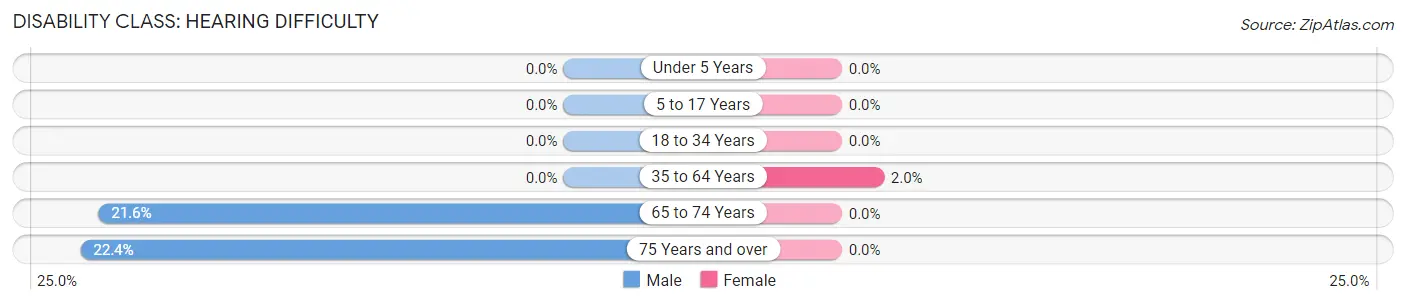
| Age Bracket | Male | Female |
| Under 5 Years | 0 (0.0%) | 0 (0.0%) |
| 5 to 17 Years | 0 (0.0%) | 0 (0.0%) |
| 18 to 34 Years | 0 (0.0%) | 0 (0.0%) |
| 35 to 64 Years | 0 (0.0%) | 16 (1.9%) |
| 65 to 74 Years | 30 (21.6%) | 0 (0.0%) |
| 75 Years and over | 39 (22.4%) | 0 (0.0%) |
Disability Class: Vision Difficulty
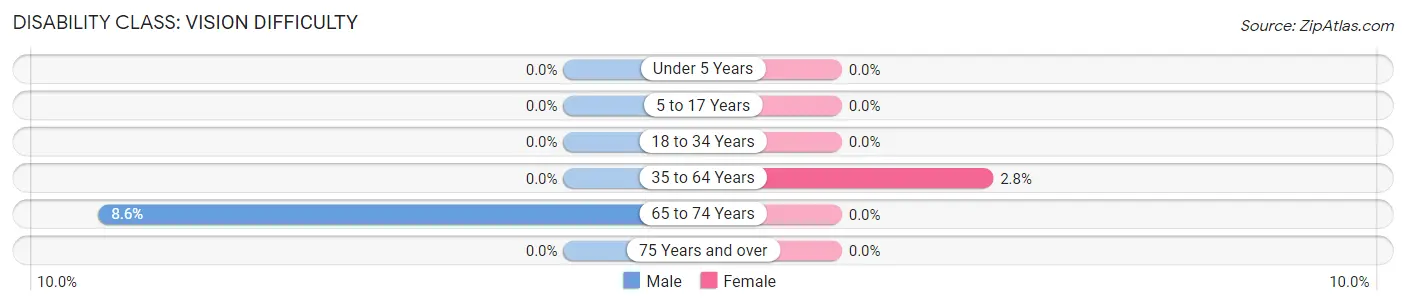
| Age Bracket | Male | Female |
| Under 5 Years | 0 (0.0%) | 0 (0.0%) |
| 5 to 17 Years | 0 (0.0%) | 0 (0.0%) |
| 18 to 34 Years | 0 (0.0%) | 0 (0.0%) |
| 35 to 64 Years | 0 (0.0%) | 23 (2.8%) |
| 65 to 74 Years | 12 (8.6%) | 0 (0.0%) |
| 75 Years and over | 0 (0.0%) | 0 (0.0%) |
Disability Class: Cognitive Difficulty
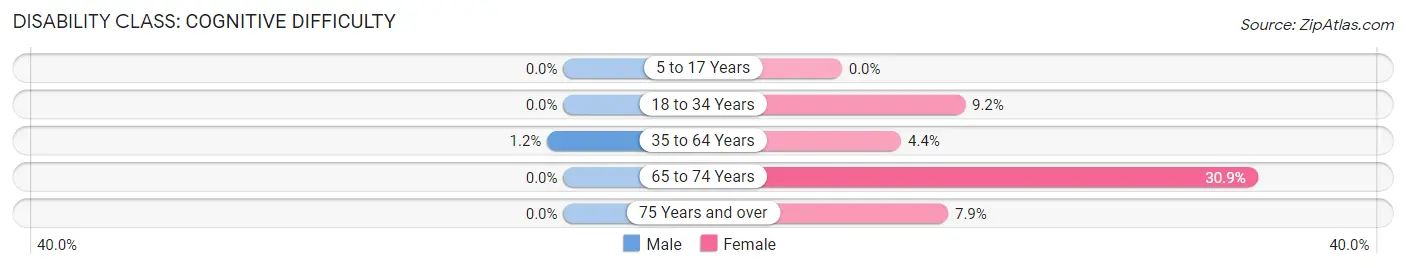
| Age Bracket | Male | Female |
| 5 to 17 Years | 0 (0.0%) | 0 (0.0%) |
| 18 to 34 Years | 0 (0.0%) | 42 (9.1%) |
| 35 to 64 Years | 8 (1.2%) | 36 (4.4%) |
| 65 to 74 Years | 0 (0.0%) | 54 (30.9%) |
| 75 Years and over | 0 (0.0%) | 9 (7.9%) |
Disability Class: Ambulatory Difficulty
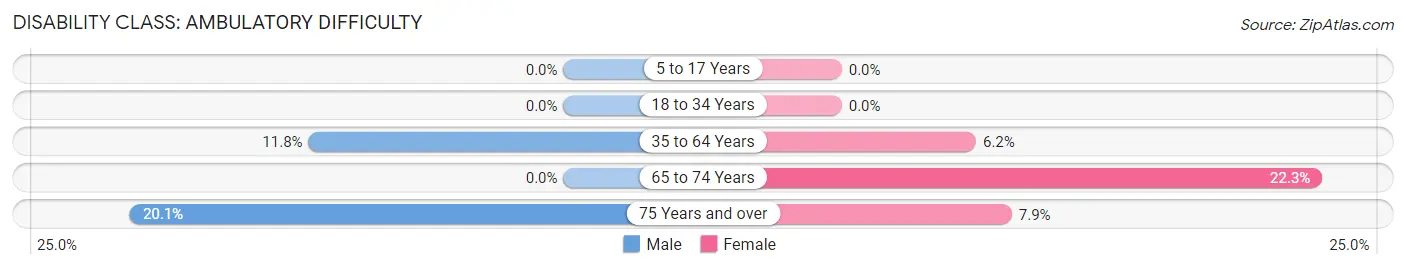
| Age Bracket | Male | Female |
| 5 to 17 Years | 0 (0.0%) | 0 (0.0%) |
| 18 to 34 Years | 0 (0.0%) | 0 (0.0%) |
| 35 to 64 Years | 79 (11.8%) | 51 (6.2%) |
| 65 to 74 Years | 0 (0.0%) | 39 (22.3%) |
| 75 Years and over | 35 (20.1%) | 9 (7.9%) |
Disability Class: Self-Care Difficulty
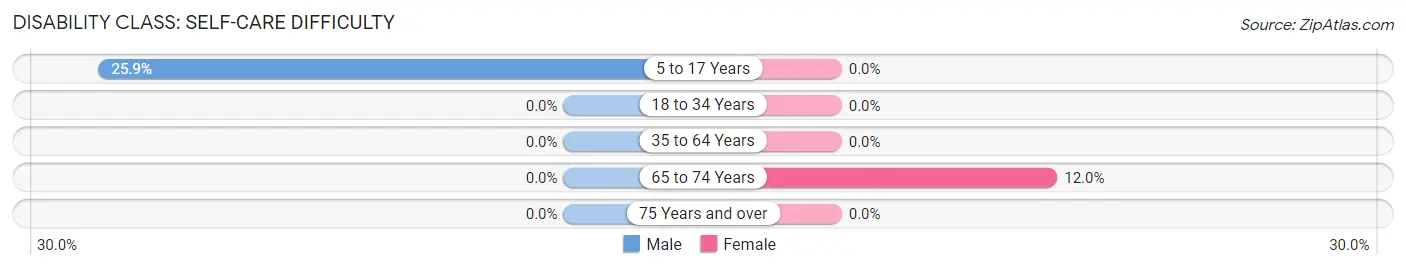
| Age Bracket | Male | Female |
| 5 to 17 Years | 59 (25.9%) | 0 (0.0%) |
| 18 to 34 Years | 0 (0.0%) | 0 (0.0%) |
| 35 to 64 Years | 0 (0.0%) | 0 (0.0%) |
| 65 to 74 Years | 0 (0.0%) | 21 (12.0%) |
| 75 Years and over | 0 (0.0%) | 0 (0.0%) |
Technology Access in Hazel Green
Computing Device Access in Hazel Green
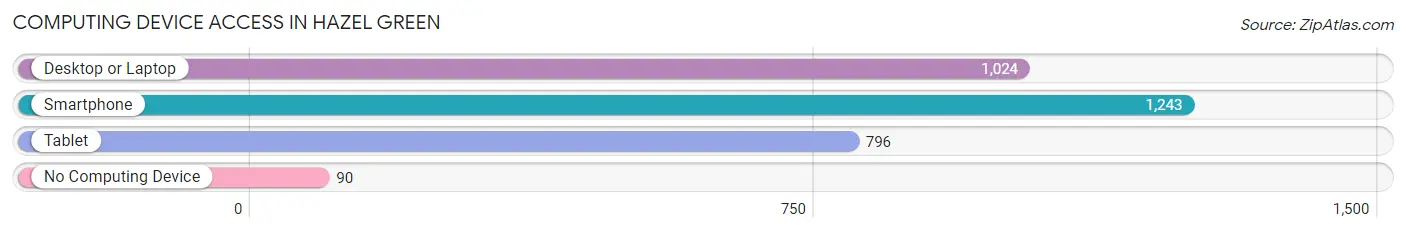
| Device Type | # Households | % Households |
| Desktop or Laptop | 1,024 | 70.7% |
| Smartphone | 1,243 | 85.8% |
| Tablet | 796 | 55.0% |
| No Computing Device | 90 | 6.2% |
| Total | 1,448 | 100.0% |
Internet Access in Hazel Green
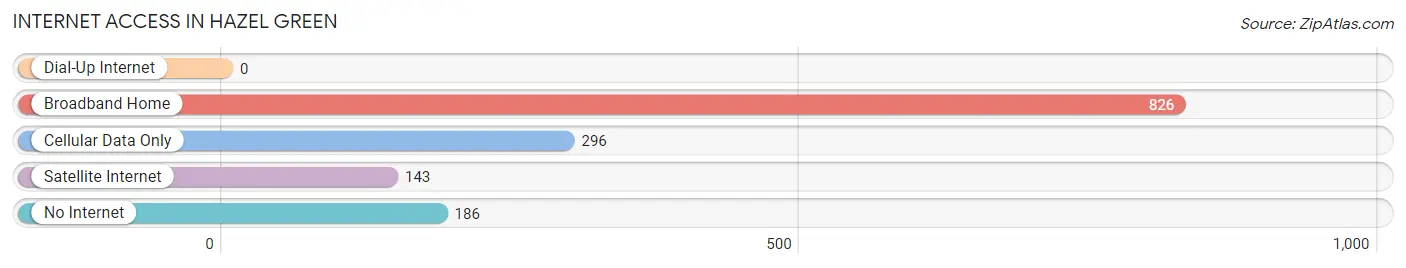
| Internet Type | # Households | % Households |
| Dial-Up Internet | 0 | 0.0% |
| Broadband Home | 826 | 57.0% |
| Cellular Data Only | 296 | 20.4% |
| Satellite Internet | 143 | 9.9% |
| No Internet | 186 | 12.9% |
| Total | 1,448 | 100.0% |
Hazel Green Summary
Hazel Green, Alabama is a small unincorporated community located in Madison County, Alabama. It is situated in the northern part of the county, just south of the Tennessee state line. The population of Hazel Green was estimated to be 2,845 in 2019.
Geography
Hazel Green is located in the northern part of Madison County, Alabama, just south of the Tennessee state line. It is situated in the foothills of the Appalachian Mountains, and is surrounded by rolling hills and forests. The area is known for its scenic beauty and is home to several state parks and recreational areas. The nearest major city is Huntsville, which is located about 20 miles to the south.
The climate in Hazel Green is humid subtropical, with hot summers and mild winters. The average annual temperature is around 64°F, and the average annual precipitation is around 50 inches.
Economy
Hazel Green is primarily a rural community, and the economy is largely based on agriculture. The area is known for its production of corn, soybeans, and cotton. Other crops grown in the area include wheat, hay, and tobacco.
The area is also home to several small businesses, including restaurants, retail stores, and service providers. The local economy is also supported by the nearby Huntsville International Airport, which provides employment opportunities for many residents.
Demographics
As of 2019, the population of Hazel Green was estimated to be 2,845. The racial makeup of the town was 94.3% White, 2.2% African American, 0.7% Native American, 0.7% Asian, 0.2% Pacific Islander, and 1.9% from other races. The median household income was $45,945, and the median family income was $51,945.
The town is served by the Madison County School District, which includes two elementary schools, one middle school, and one high school. The town is also home to several churches, including the Hazel Green United Methodist Church, the Hazel Green Baptist Church, and the Hazel Green Church of Christ.
Conclusion
Hazel Green, Alabama is a small unincorporated community located in Madison County, Alabama. It is situated in the northern part of the county, just south of the Tennessee state line. The population of Hazel Green was estimated to be 2,845 in 2019. The economy of the town is largely based on agriculture, and the area is also home to several small businesses. The racial makeup of the town was 94.3% White, 2.2% African American, 0.7% Native American, 0.7% Asian, 0.2% Pacific Islander, and 1.9% from other races. The median household income was $45,945, and the median family income was $51,945. Hazel Green is served by the Madison County School District, and is home to several churches.
Common Questions
What is Per Capita Income in Hazel Green?
Per Capita income in Hazel Green is $28,249.
What is the Median Family Income in Hazel Green?
Median Family Income in Hazel Green is $80,966.
What is the Median Household income in Hazel Green?
Median Household Income in Hazel Green is $75,625.
What is Income or Wage Gap in Hazel Green?
Income or Wage Gap in Hazel Green is 41.4%.
Women in Hazel Green earn 58.6 cents for every dollar earned by a man.
What is Family Income Deficit in Hazel Green?
Family Income Deficit in Hazel Green is $10,519.
Families that are below poverty line in Hazel Green earn $10,519 less on average than the poverty threshold level.
What is Inequality or Gini Index in Hazel Green?
Inequality or Gini Index in Hazel Green is 0.33.
What is the Total Population of Hazel Green?
Total Population of Hazel Green is 3,971.
What is the Total Male Population of Hazel Green?
Total Male Population of Hazel Green is 1,901.
What is the Total Female Population of Hazel Green?
Total Female Population of Hazel Green is 2,070.
What is the Ratio of Males per 100 Females in Hazel Green?
There are 91.84 Males per 100 Females in Hazel Green.
What is the Ratio of Females per 100 Males in Hazel Green?
There are 108.89 Females per 100 Males in Hazel Green.
What is the Median Population Age in Hazel Green?
Median Population Age in Hazel Green is 37.7 Years.
What is the Average Family Size in Hazel Green
Average Family Size in Hazel Green is 3.0 People.
What is the Average Household Size in Hazel Green
Average Household Size in Hazel Green is 2.7 People.
How Large is the Labor Force in Hazel Green?
There are 1,996 People in the Labor Forcein in Hazel Green.
What is the Percentage of People in the Labor Force in Hazel Green?
66.2% of People are in the Labor Force in Hazel Green.
What is the Unemployment Rate in Hazel Green?
Unemployment Rate in Hazel Green is 11.4%.