Skyline, AL
Skyline Map
Skyline Overview
1,114
TOTAL POPULATION
566
MALE POPULATION
548
FEMALE POPULATION
103.28
MALES / 100 FEMALES
96.82
FEMALES / 100 MALES
44.2
MEDIAN AGE
3.2
AVG FAMILY SIZE
2.8
AVG HOUSEHOLD SIZE
$19,190
PER CAPITA INCOME
$38,736
AVG FAMILY INCOME
$38,537
AVG HOUSEHOLD INCOME
40.0%
WAGE / INCOME GAP [ % ]
60.0¢/ $1
WAGE / INCOME GAP [ $ ]
0.42
INEQUALITY / GINI INDEX
355
LABOR FORCE [ PEOPLE ]
35.6%
PERCENT IN LABOR FORCE
4.5%
UNEMPLOYMENT RATE
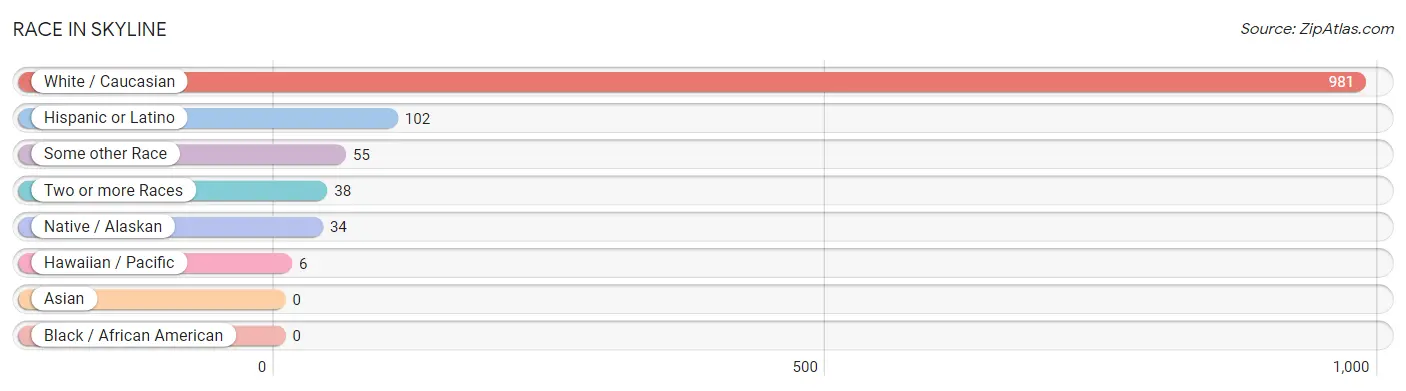
Race in Skyline
The most populous races in Skyline are White / Caucasian (981 | 88.1%), Hispanic or Latino (102 | 9.2%), and Some other Race (55 | 4.9%).
| Race | # Population | % Population |
| Asian | 0 | 0.0% |
| Black / African American | 0 | 0.0% |
| Hawaiian / Pacific | 6 | 0.5% |
| Hispanic or Latino | 102 | 9.2% |
| Native / Alaskan | 34 | 3.0% |
| White / Caucasian | 981 | 88.1% |
| Two or more Races | 38 | 3.4% |
| Some other Race | 55 | 4.9% |
| Total | 1,114 | 100.0% |
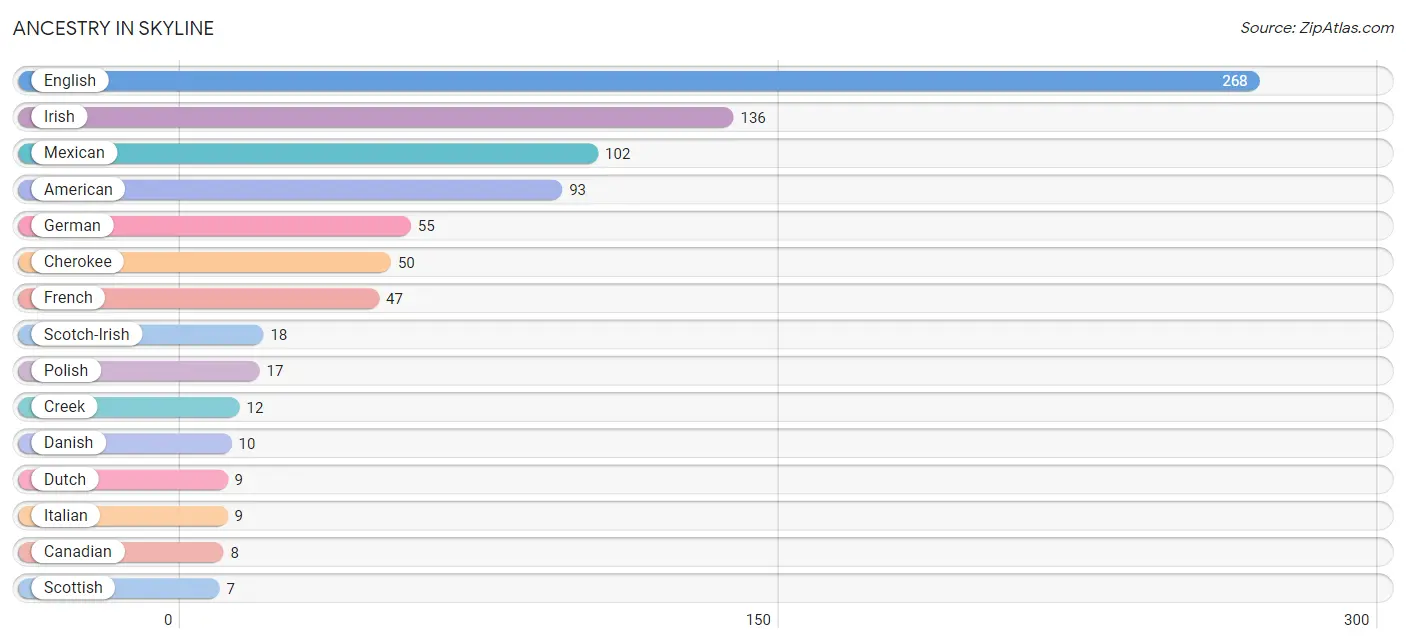
Ancestry in Skyline
The most populous ancestries reported in Skyline are English (268 | 24.1%), Irish (136 | 12.2%), Mexican (102 | 9.2%), American (93 | 8.4%), and German (55 | 4.9%), together accounting for 58.7% of all Skyline residents.
| Ancestry | # Population | % Population |
| American | 93 | 8.4% |
| Apache | 1 | 0.1% |
| Canadian | 8 | 0.7% |
| Cherokee | 50 | 4.5% |
| Creek | 12 | 1.1% |
| Danish | 10 | 0.9% |
| Dutch | 9 | 0.8% |
| English | 268 | 24.1% |
| French | 47 | 4.2% |
| French Canadian | 1 | 0.1% |
| German | 55 | 4.9% |
| Iranian | 2 | 0.2% |
| Irish | 136 | 12.2% |
| Italian | 9 | 0.8% |
| Mexican | 102 | 9.2% |
| Native Hawaiian | 6 | 0.5% |
| Polish | 17 | 1.5% |
| Russian | 4 | 0.4% |
| Scotch-Irish | 18 | 1.6% |
| Scottish | 7 | 0.6% | View All 20 Rows |
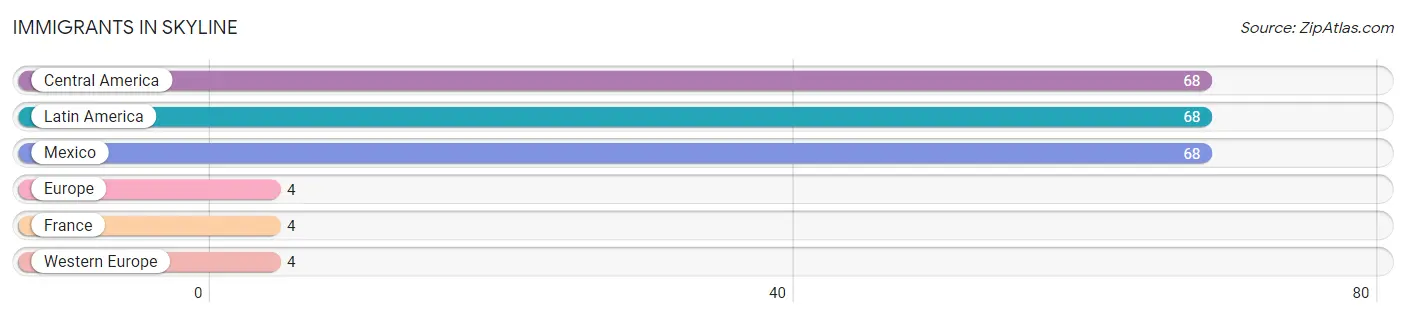
Immigrants in Skyline
The most numerous immigrant groups reported in Skyline came from Central America (68 | 6.1%), Latin America (68 | 6.1%), Mexico (68 | 6.1%), Europe (4 | 0.4%), and France (4 | 0.4%), together accounting for 19.0% of all Skyline residents.
| Immigration Origin | # Population | % Population |
| Central America | 68 | 6.1% |
| Europe | 4 | 0.4% |
| France | 4 | 0.4% |
| Latin America | 68 | 6.1% |
| Mexico | 68 | 6.1% |
| Western Europe | 4 | 0.4% | View All 6 Rows |
Sex and Age in Skyline
Sex and Age in Skyline
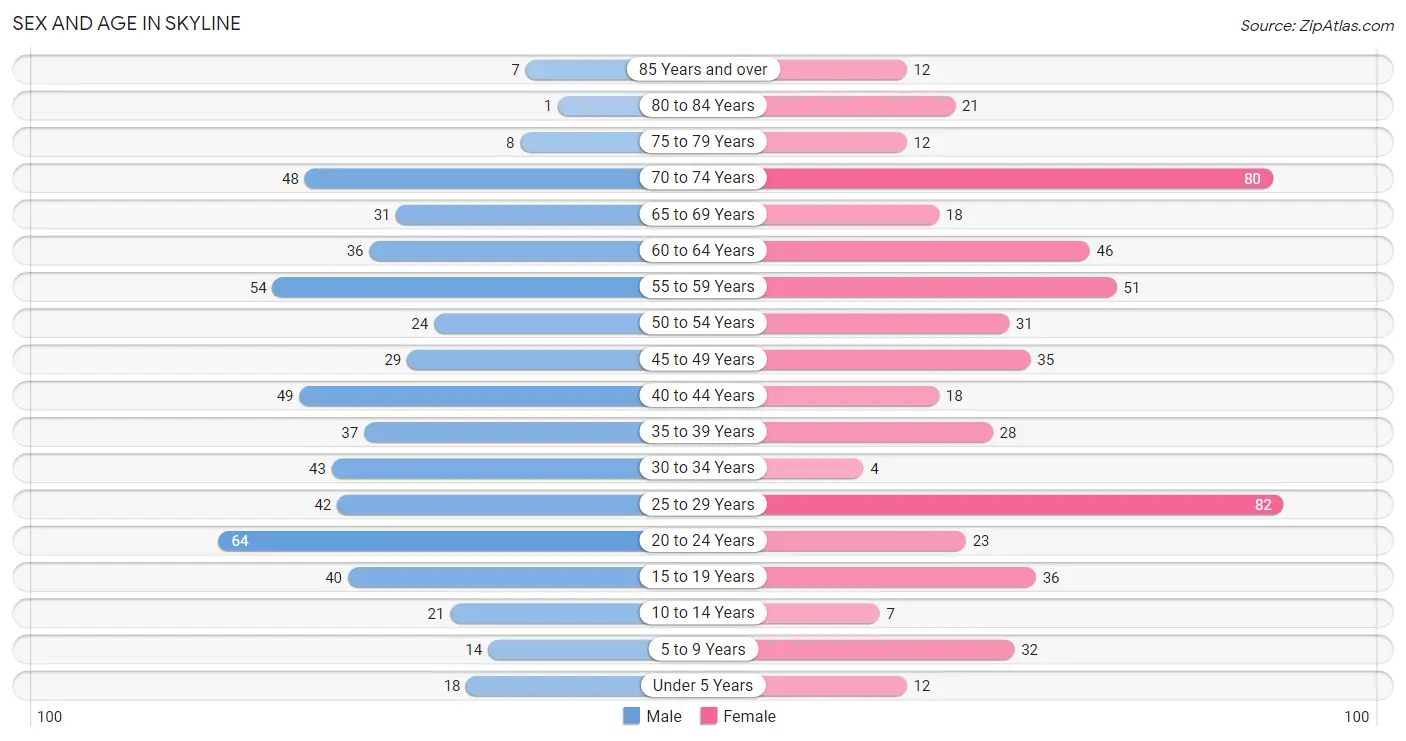
The most populous age groups in Skyline are 20 to 24 Years (64 | 11.3%) for men and 25 to 29 Years (82 | 15.0%) for women.
| Age Bracket | Male | Female |
| Under 5 Years | 18 (3.2%) | 12 (2.2%) |
| 5 to 9 Years | 14 (2.5%) | 32 (5.8%) |
| 10 to 14 Years | 21 (3.7%) | 7 (1.3%) |
| 15 to 19 Years | 40 (7.1%) | 36 (6.6%) |
| 20 to 24 Years | 64 (11.3%) | 23 (4.2%) |
| 25 to 29 Years | 42 (7.4%) | 82 (15.0%) |
| 30 to 34 Years | 43 (7.6%) | 4 (0.7%) |
| 35 to 39 Years | 37 (6.5%) | 28 (5.1%) |
| 40 to 44 Years | 49 (8.7%) | 18 (3.3%) |
| 45 to 49 Years | 29 (5.1%) | 35 (6.4%) |
| 50 to 54 Years | 24 (4.2%) | 31 (5.7%) |
| 55 to 59 Years | 54 (9.5%) | 51 (9.3%) |
| 60 to 64 Years | 36 (6.4%) | 46 (8.4%) |
| 65 to 69 Years | 31 (5.5%) | 18 (3.3%) |
| 70 to 74 Years | 48 (8.5%) | 80 (14.6%) |
| 75 to 79 Years | 8 (1.4%) | 12 (2.2%) |
| 80 to 84 Years | 1 (0.2%) | 21 (3.8%) |
| 85 Years and over | 7 (1.2%) | 12 (2.2%) |
| Total | 566 (100.0%) | 548 (100.0%) |
Families and Households in Skyline
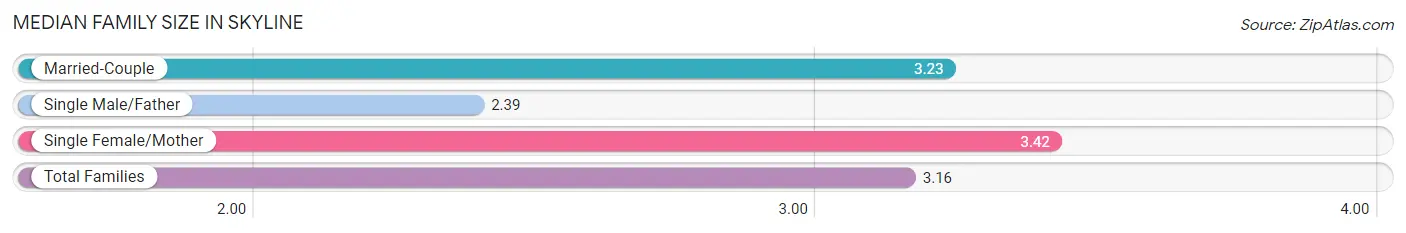
Median Family Size in Skyline
The median family size in Skyline is 3.16 persons per family, with single female/mother families (43 | 13.8%) accounting for the largest median family size of 3.42 persons per family. On the other hand, single male/father families (36 | 11.6%) represent the smallest median family size with 2.39 persons per family.
| Family Type | # Families | Family Size |
| Married-Couple | 232 (74.6%) | 3.23 |
| Single Male/Father | 36 (11.6%) | 2.39 |
| Single Female/Mother | 43 (13.8%) | 3.42 |
| Total Families | 311 (100.0%) | 3.16 |
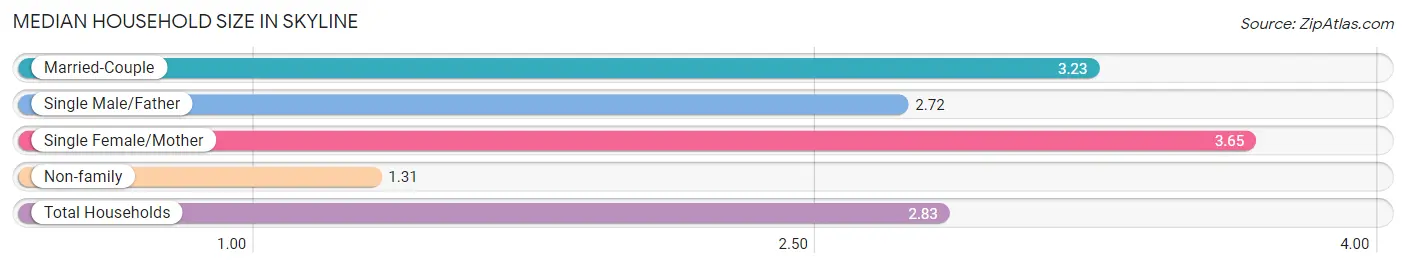
Median Household Size in Skyline
The median household size in Skyline is 2.83 persons per household, with single female/mother households (43 | 10.9%) accounting for the largest median household size of 3.65 persons per household. non-family households (83 | 21.1%) represent the smallest median household size with 1.31 persons per household.
| Household Type | # Households | Household Size |
| Married-Couple | 232 (58.9%) | 3.23 |
| Single Male/Father | 36 (9.1%) | 2.72 |
| Single Female/Mother | 43 (10.9%) | 3.65 |
| Non-family | 83 (21.1%) | 1.31 |
| Total Households | 394 (100.0%) | 2.83 |
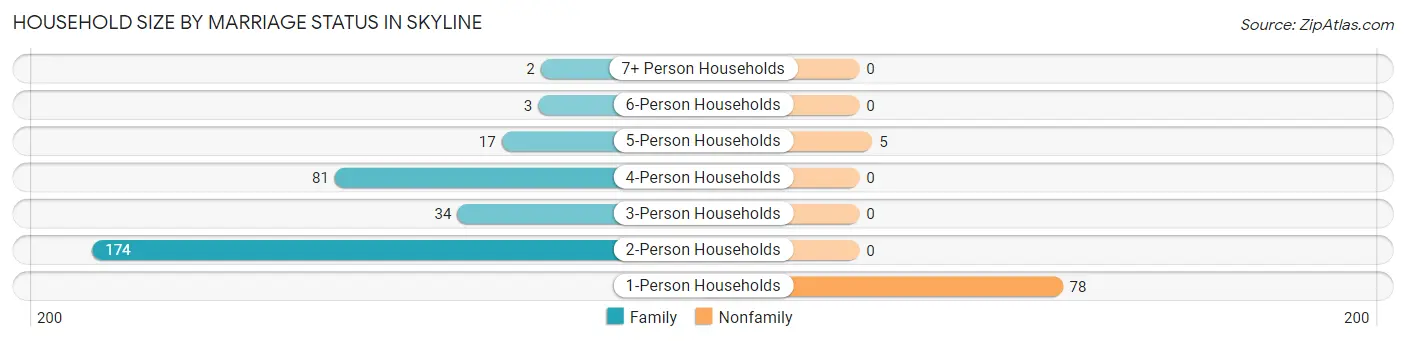
Household Size by Marriage Status in Skyline
Out of a total of 394 households in Skyline, 311 (78.9%) are family households, while 83 (21.1%) are nonfamily households. The most numerous type of family households are 2-person households, comprising 174, and the most common type of nonfamily households are 1-person households, comprising 78.
| Household Size | Family Households | Nonfamily Households |
| 1-Person Households | - | 78 (19.8%) |
| 2-Person Households | 174 (44.2%) | 0 (0.0%) |
| 3-Person Households | 34 (8.6%) | 0 (0.0%) |
| 4-Person Households | 81 (20.6%) | 0 (0.0%) |
| 5-Person Households | 17 (4.3%) | 5 (1.3%) |
| 6-Person Households | 3 (0.8%) | 0 (0.0%) |
| 7+ Person Households | 2 (0.5%) | 0 (0.0%) |
| Total | 311 (78.9%) | 83 (21.1%) |
Female Fertility in Skyline
Fertility by Age in Skyline
Average fertility rate in Skyline is 27.0 births per 1,000 women. Women in the age bracket of 20 to 34 years have the highest fertility rate with 55.0 births per 1,000 women. Women in the age bracket of 20 to 34 years acount for 100.0% of all women with births.
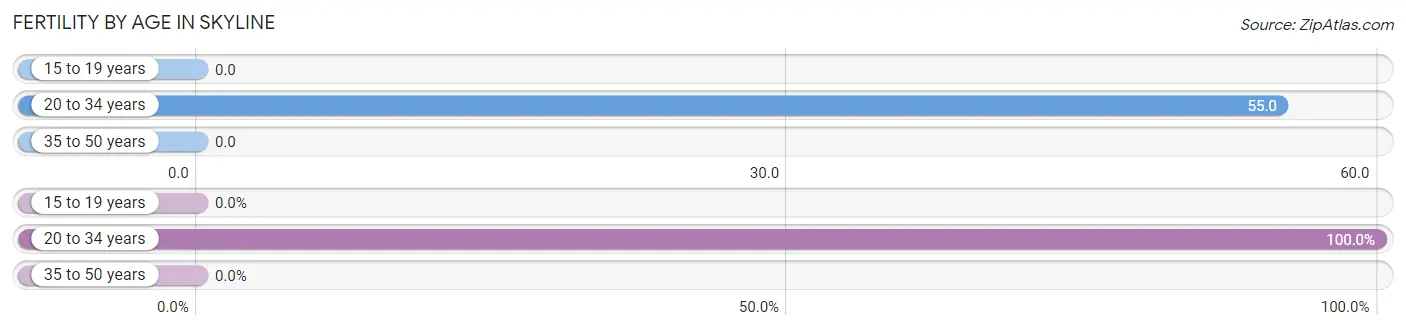
| Age Bracket | Women with Births | Births / 1,000 Women |
| 15 to 19 years | 0 (0.0%) | 0.0 |
| 20 to 34 years | 6 (100.0%) | 55.0 |
| 35 to 50 years | 0 (0.0%) | 0.0 |
| Total | 6 (100.0%) | 27.0 |
Fertility by Age by Marriage Status in Skyline
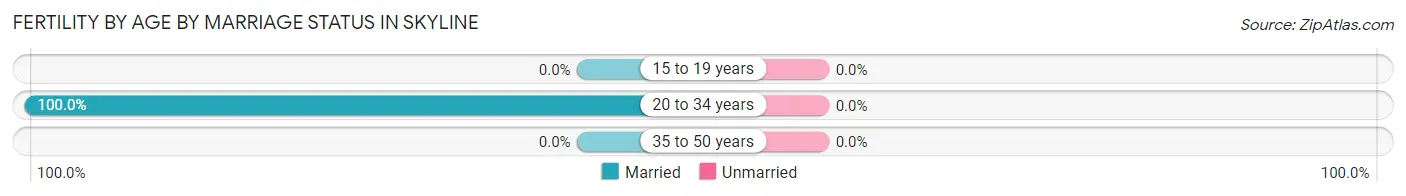
| Age Bracket | Married | Unmarried |
| 15 to 19 years | 0 (0.0%) | 0 (0.0%) |
| 20 to 34 years | 6 (100.0%) | 0 (0.0%) |
| 35 to 50 years | 0 (0.0%) | 0 (0.0%) |
| Total | 6 (100.0%) | 0 (0.0%) |
Fertility by Education in Skyline
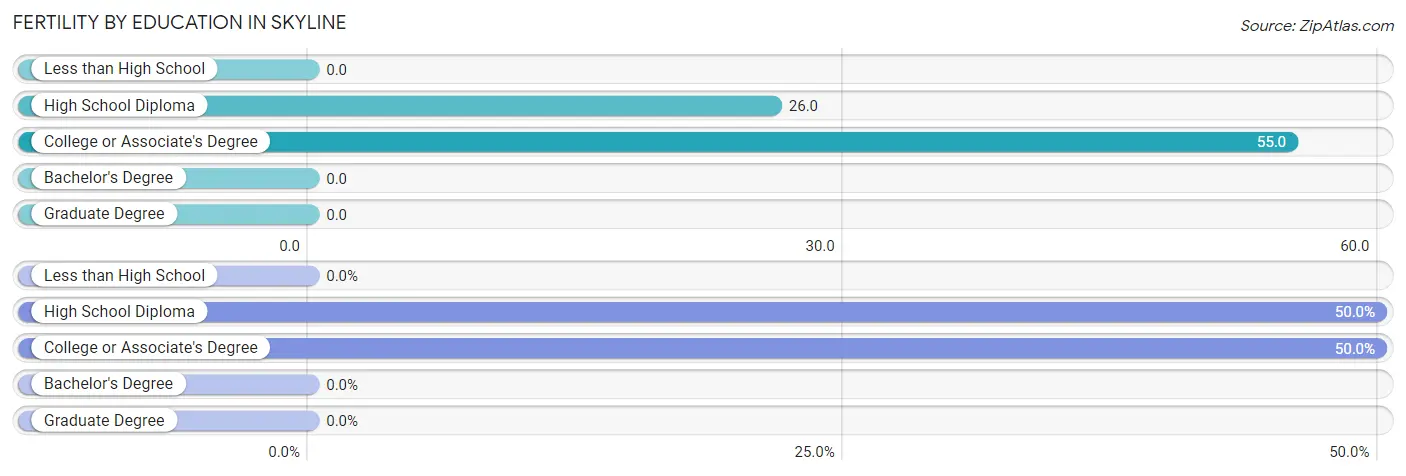
| Educational Attainment | Women with Births | Births / 1,000 Women |
| Less than High School | 0 (0.0%) | 0.0 |
| High School Diploma | 3 (50.0%) | 26.0 |
| College or Associate's Degree | 3 (50.0%) | 55.0 |
| Bachelor's Degree | 0 (0.0%) | 0.0 |
| Graduate Degree | 0 (0.0%) | 0.0 |
| Total | 6 (100.0%) | 27.0 |
Fertility by Education by Marriage Status in Skyline
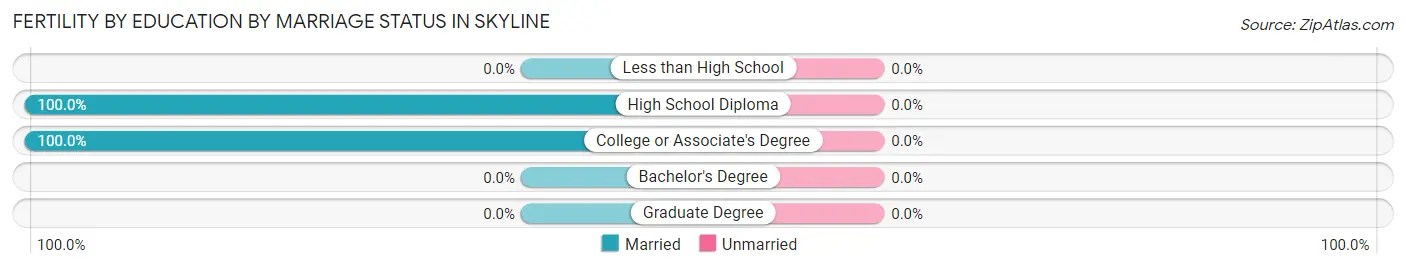
| Educational Attainment | Married | Unmarried |
| Less than High School | 0 (0.0%) | 0 (0.0%) |
| High School Diploma | 3 (100.0%) | 0 (0.0%) |
| College or Associate's Degree | 3 (100.0%) | 0 (0.0%) |
| Bachelor's Degree | 0 (0.0%) | 0 (0.0%) |
| Graduate Degree | 0 (0.0%) | 0 (0.0%) |
| Total | 6 (100.0%) | 0 (0.0%) |
Income in Skyline
Income Overview in Skyline
Per Capita Income in Skyline is $19,190, while median incomes of families and households are $38,736 and $38,537 respectively.
| Characteristic | Number | Measure |
| Per Capita Income | 1,114 | $19,190 |
| Median Family Income | 311 | $38,736 |
| Mean Family Income | 311 | $49,239 |
| Median Household Income | 394 | $38,537 |
| Mean Household Income | 394 | $50,587 |
| Income Deficit | 311 | $0 |
| Wage / Income Gap (%) | 1,114 | 40.00% |
| Wage / Income Gap ($) | 1,114 | 60.00¢ per $1 |
| Gini / Inequality Index | 1,114 | 0.42 |
Earnings by Sex in Skyline
Average Earnings in Skyline are $25,054, $30,208 for men and $18,125 for women, a difference of 40.0%.
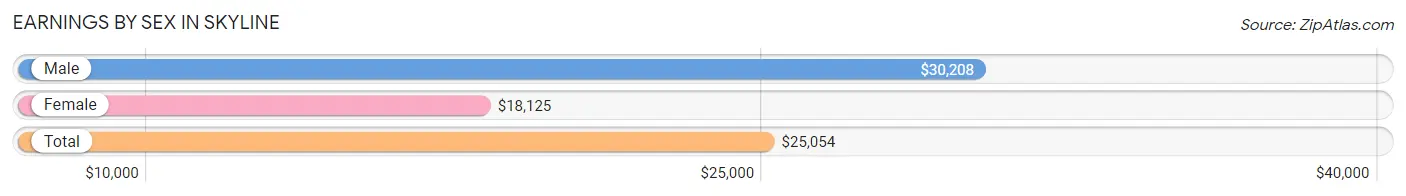
| Sex | Number | Average Earnings |
| Male | 252 (62.5%) | $30,208 |
| Female | 151 (37.5%) | $18,125 |
| Total | 403 (100.0%) | $25,054 |
Earnings by Sex by Income Bracket in Skyline
The most common earnings brackets in Skyline are $30,000 to $34,999 for men (28 | 11.1%) and $15,000 to $17,499 for women (18 | 11.9%).
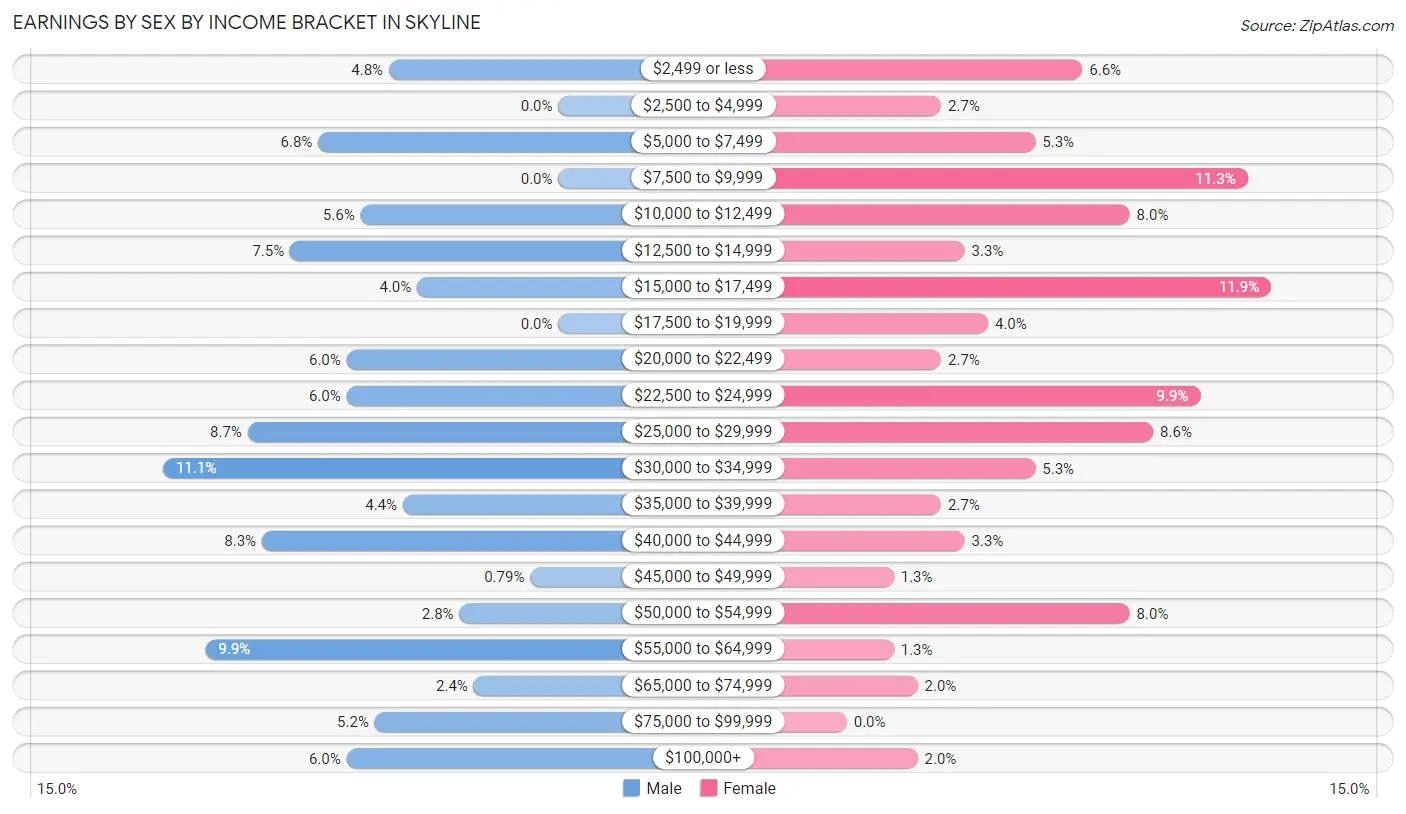
| Income | Male | Female |
| $2,499 or less | 12 (4.8%) | 10 (6.6%) |
| $2,500 to $4,999 | 0 (0.0%) | 4 (2.6%) |
| $5,000 to $7,499 | 17 (6.8%) | 8 (5.3%) |
| $7,500 to $9,999 | 0 (0.0%) | 17 (11.3%) |
| $10,000 to $12,499 | 14 (5.6%) | 12 (8.0%) |
| $12,500 to $14,999 | 19 (7.5%) | 5 (3.3%) |
| $15,000 to $17,499 | 10 (4.0%) | 18 (11.9%) |
| $17,500 to $19,999 | 0 (0.0%) | 6 (4.0%) |
| $20,000 to $22,499 | 15 (5.9%) | 4 (2.6%) |
| $22,500 to $24,999 | 15 (5.9%) | 15 (9.9%) |
| $25,000 to $29,999 | 22 (8.7%) | 13 (8.6%) |
| $30,000 to $34,999 | 28 (11.1%) | 8 (5.3%) |
| $35,000 to $39,999 | 11 (4.4%) | 4 (2.6%) |
| $40,000 to $44,999 | 21 (8.3%) | 5 (3.3%) |
| $45,000 to $49,999 | 2 (0.8%) | 2 (1.3%) |
| $50,000 to $54,999 | 7 (2.8%) | 12 (8.0%) |
| $55,000 to $64,999 | 25 (9.9%) | 2 (1.3%) |
| $65,000 to $74,999 | 6 (2.4%) | 3 (2.0%) |
| $75,000 to $99,999 | 13 (5.2%) | 0 (0.0%) |
| $100,000+ | 15 (5.9%) | 3 (2.0%) |
| Total | 252 (100.0%) | 151 (100.0%) |
Earnings by Sex by Educational Attainment in Skyline
Average earnings in Skyline are $31,094 for men and $18,958 for women, a difference of 39.0%. Men with an educational attainment of high school diploma enjoy the highest average annual earnings of $37,500, while those with less than high school education earn the least with $26,324. Women with an educational attainment of college or associate's degree earn the most with the average annual earnings of $27,188, while those with less than high school education have the smallest earnings of $10,938.
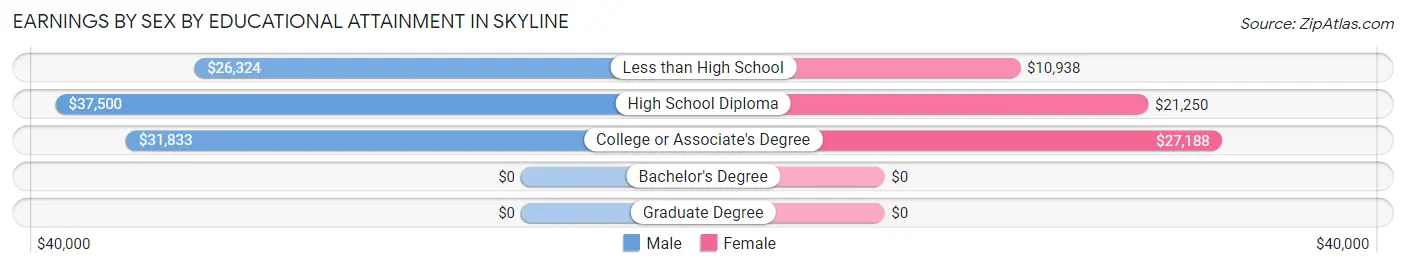
| Educational Attainment | Male Income | Female Income |
| Less than High School | $26,324 | $10,938 |
| High School Diploma | $37,500 | $21,250 |
| College or Associate's Degree | $31,833 | $27,188 |
| Bachelor's Degree | - | - |
| Graduate Degree | - | - |
| Total | $31,094 | $18,958 |
Family Income in Skyline
Family Income Brackets in Skyline
According to the Skyline family income data, there are 126 families falling into the $35,000 to $49,999 income range, which is the most common income bracket and makes up 40.5% of all families. Conversely, the $150,000 to $199,999 income bracket is the least frequent group with only 5 families (1.6%) belonging to this category.
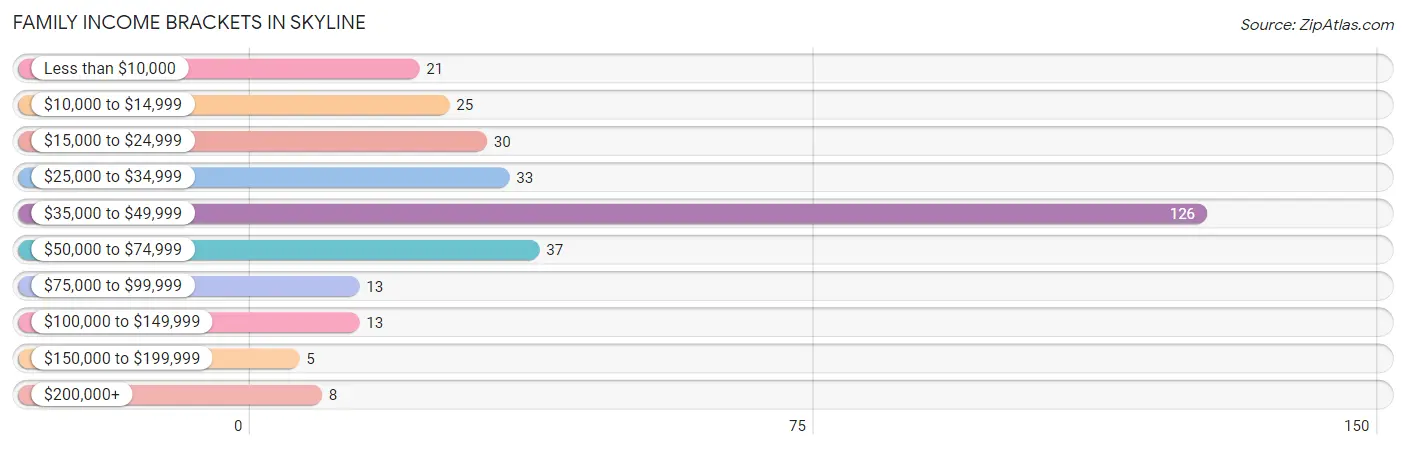
| Income Bracket | # Families | % Families |
| Less than $10,000 | 21 | 6.8% |
| $10,000 to $14,999 | 25 | 8.0% |
| $15,000 to $24,999 | 30 | 9.6% |
| $25,000 to $34,999 | 33 | 10.6% |
| $35,000 to $49,999 | 126 | 40.5% |
| $50,000 to $74,999 | 37 | 11.9% |
| $75,000 to $99,999 | 13 | 4.2% |
| $100,000 to $149,999 | 13 | 4.2% |
| $150,000 to $199,999 | 5 | 1.6% |
| $200,000+ | 8 | 2.6% |
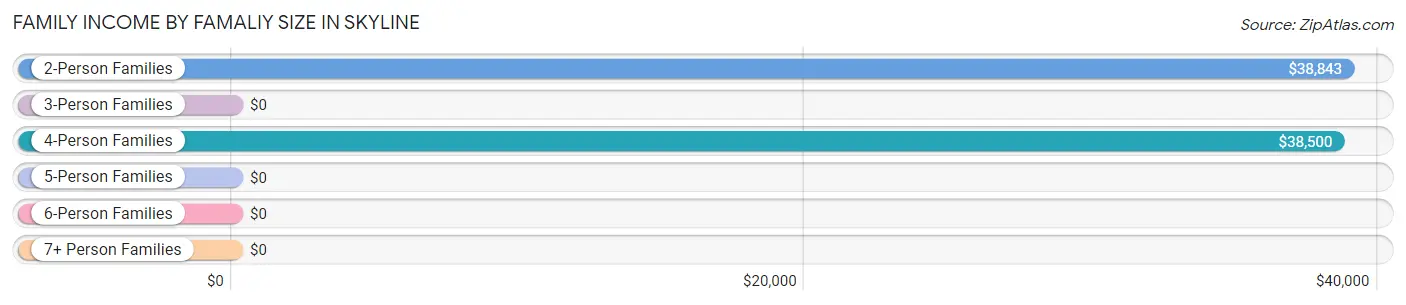
Family Income by Famaliy Size in Skyline
2-person families (178 | 57.2%) account for the highest median family income in Skyline with $38,843 per family, while 2-person families (178 | 57.2%) have the highest median income of $19,422 per family member.
| Income Bracket | # Families | Median Income |
| 2-Person Families | 178 (57.2%) | $38,843 |
| 3-Person Families | 51 (16.4%) | $0 |
| 4-Person Families | 60 (19.3%) | $38,500 |
| 5-Person Families | 17 (5.5%) | $0 |
| 6-Person Families | 3 (1.0%) | $0 |
| 7+ Person Families | 2 (0.6%) | $0 |
| Total | 311 (100.0%) | $38,736 |
Family Income by Number of Earners in Skyline
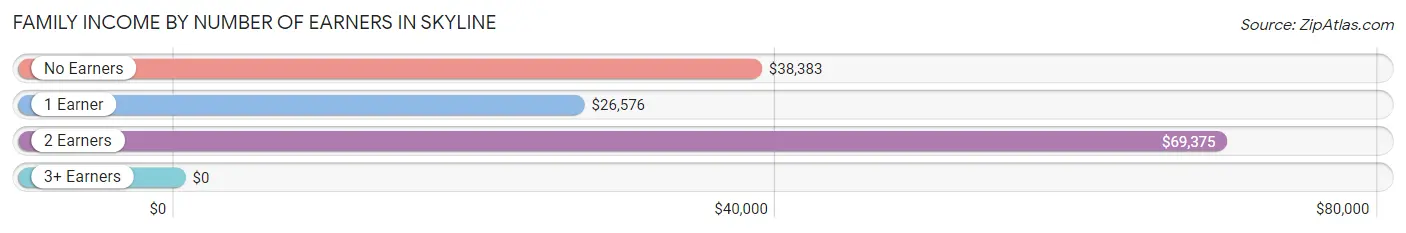
| Number of Earners | # Families | Median Income |
| No Earners | 133 (42.8%) | $38,383 |
| 1 Earner | 119 (38.3%) | $26,576 |
| 2 Earners | 43 (13.8%) | $69,375 |
| 3+ Earners | 16 (5.1%) | $0 |
| Total | 311 (100.0%) | $38,736 |
Household Income in Skyline
Household Income Brackets in Skyline
With 129 households falling in the category, the $35,000 to $49,999 income range is the most frequent in Skyline, accounting for 32.7% of all households. In contrast, only 8 households (2.0%) fall into the $200,000+ income bracket, making it the least populous group.
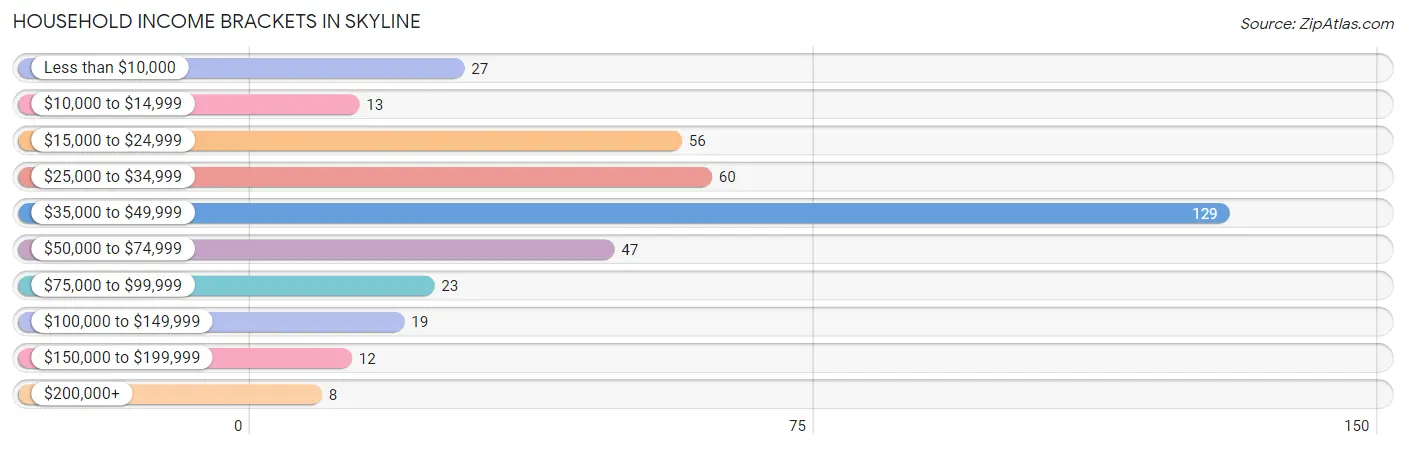
| Income Bracket | # Households | % Households |
| Less than $10,000 | 27 | 6.9% |
| $10,000 to $14,999 | 13 | 3.3% |
| $15,000 to $24,999 | 56 | 14.2% |
| $25,000 to $34,999 | 60 | 15.2% |
| $35,000 to $49,999 | 129 | 32.7% |
| $50,000 to $74,999 | 47 | 11.9% |
| $75,000 to $99,999 | 23 | 5.8% |
| $100,000 to $149,999 | 19 | 4.8% |
| $150,000 to $199,999 | 12 | 3.0% |
| $200,000+ | 8 | 2.0% |
Household Income by Householder Age in Skyline
The median household income in Skyline is $38,537, with the highest median household income of $40,556 found in the 45 to 64 years age bracket for the primary householder. A total of 152 households (38.6%) fall into this category. Meanwhile, the 15 to 24 years age bracket for the primary householder has the lowest median household income of $0, with 3 households (0.8%) in this group.
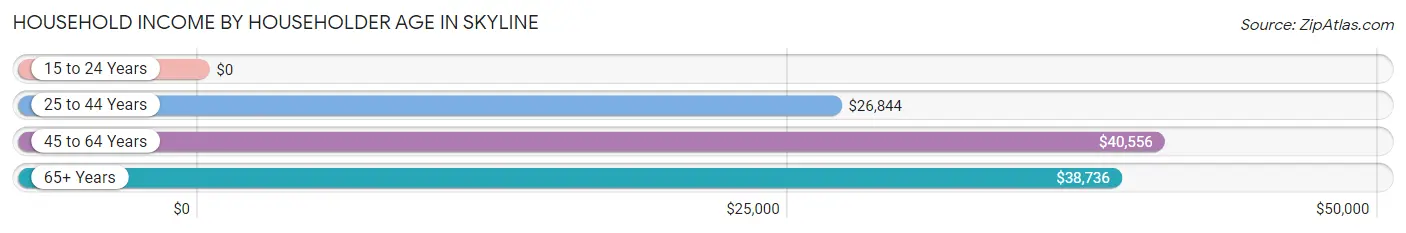
| Income Bracket | # Households | Median Income |
| 15 to 24 Years | 3 (0.8%) | $0 |
| 25 to 44 Years | 99 (25.1%) | $26,844 |
| 45 to 64 Years | 152 (38.6%) | $40,556 |
| 65+ Years | 140 (35.5%) | $38,736 |
| Total | 394 (100.0%) | $38,537 |
Poverty in Skyline
Income Below Poverty by Sex and Age in Skyline
With 23.0% poverty level for males and 19.5% for females among the residents of Skyline, 5 year old males and 5 year old females are the most vulnerable to poverty, with 2 males (100.0%) and 14 females (87.5%) in their respective age groups living below the poverty level.
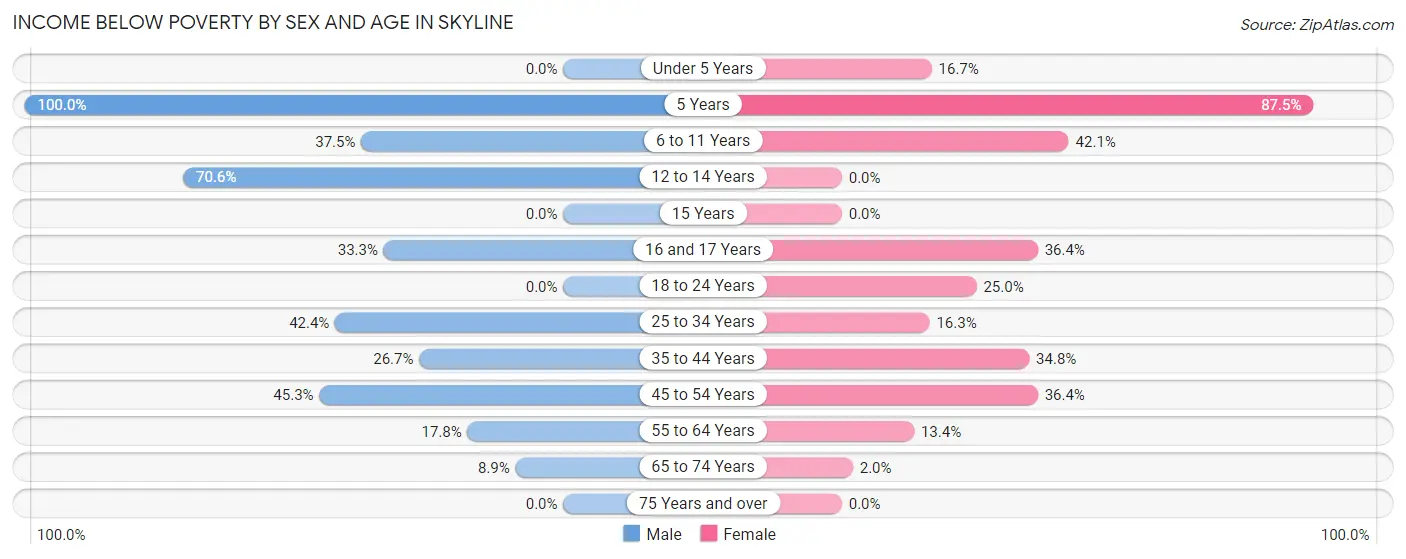
| Age Bracket | Male | Female |
| Under 5 Years | 0 (0.0%) | 2 (16.7%) |
| 5 Years | 2 (100.0%) | 14 (87.5%) |
| 6 to 11 Years | 6 (37.5%) | 8 (42.1%) |
| 12 to 14 Years | 12 (70.6%) | 0 (0.0%) |
| 15 Years | 0 (0.0%) | 0 (0.0%) |
| 16 and 17 Years | 4 (33.3%) | 4 (36.4%) |
| 18 to 24 Years | 0 (0.0%) | 10 (25.0%) |
| 25 to 34 Years | 36 (42.3%) | 14 (16.3%) |
| 35 to 44 Years | 23 (26.7%) | 16 (34.8%) |
| 45 to 54 Years | 24 (45.3%) | 24 (36.4%) |
| 55 to 64 Years | 16 (17.8%) | 13 (13.4%) |
| 65 to 74 Years | 7 (8.9%) | 2 (2.0%) |
| 75 Years and over | 0 (0.0%) | 0 (0.0%) |
| Total | 130 (23.0%) | 107 (19.5%) |
Income Above Poverty by Sex and Age in Skyline
According to the poverty statistics in Skyline, males aged under 5 years and females aged 12 to 14 years are the age groups that are most secure financially, with 100.0% of males and 100.0% of females in these age groups living above the poverty line.
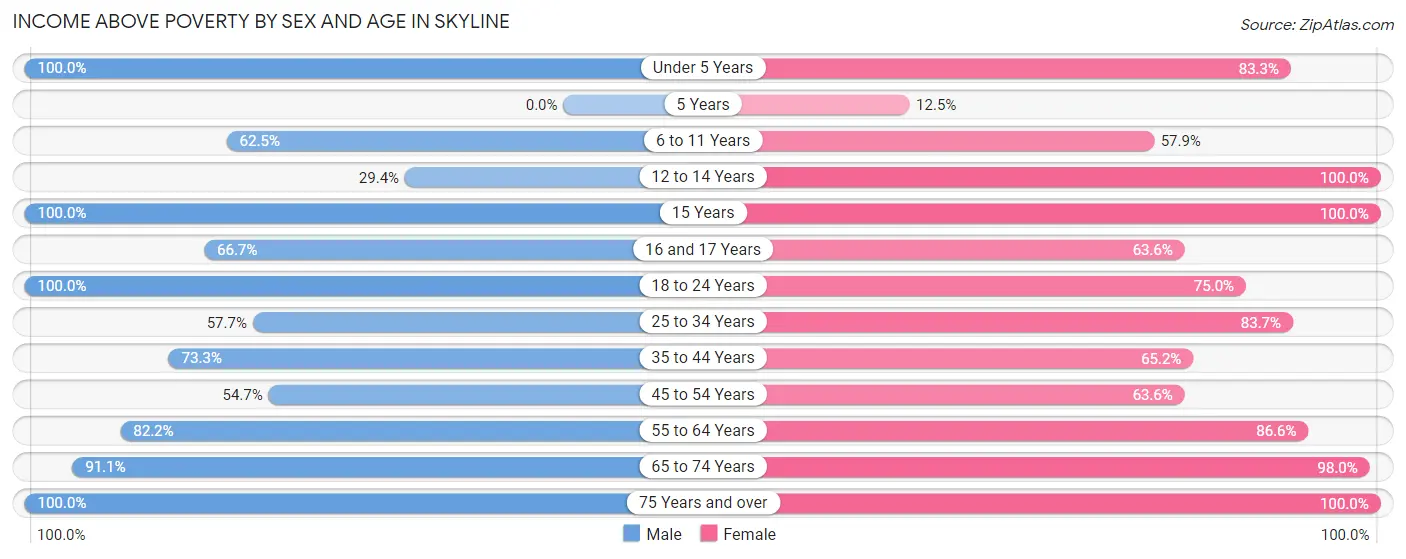
| Age Bracket | Male | Female |
| Under 5 Years | 18 (100.0%) | 10 (83.3%) |
| 5 Years | 0 (0.0%) | 2 (12.5%) |
| 6 to 11 Years | 10 (62.5%) | 11 (57.9%) |
| 12 to 14 Years | 5 (29.4%) | 4 (100.0%) |
| 15 Years | 5 (100.0%) | 8 (100.0%) |
| 16 and 17 Years | 8 (66.7%) | 7 (63.6%) |
| 18 to 24 Years | 87 (100.0%) | 30 (75.0%) |
| 25 to 34 Years | 49 (57.7%) | 72 (83.7%) |
| 35 to 44 Years | 63 (73.3%) | 30 (65.2%) |
| 45 to 54 Years | 29 (54.7%) | 42 (63.6%) |
| 55 to 64 Years | 74 (82.2%) | 84 (86.6%) |
| 65 to 74 Years | 72 (91.1%) | 96 (98.0%) |
| 75 Years and over | 16 (100.0%) | 45 (100.0%) |
| Total | 436 (77.0%) | 441 (80.5%) |
Income Below Poverty Among Married-Couple Families in Skyline
The poverty statistics for married-couple families in Skyline show that 13.8% or 32 of the total 232 families live below the poverty line. Families with 3 or 4 children have the highest poverty rate of 40.0%, comprising of 2 families. On the other hand, families with no children have the lowest poverty rate of 6.7%, which includes 12 families.
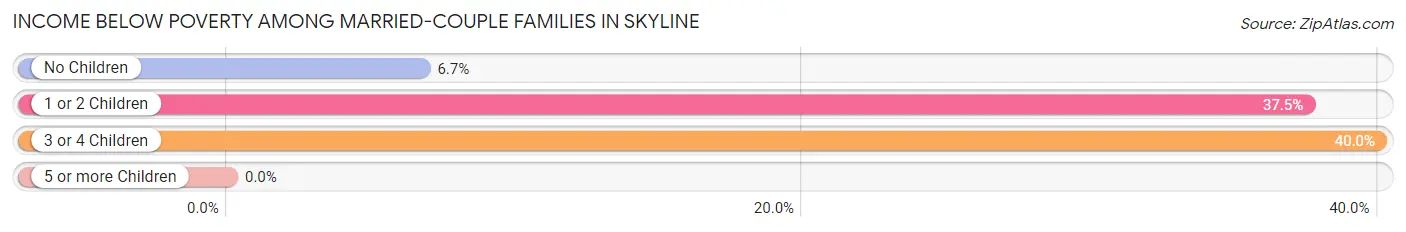
| Children | Above Poverty | Below Poverty |
| No Children | 167 (93.3%) | 12 (6.7%) |
| 1 or 2 Children | 30 (62.5%) | 18 (37.5%) |
| 3 or 4 Children | 3 (60.0%) | 2 (40.0%) |
| 5 or more Children | 0 (0.0%) | 0 (0.0%) |
| Total | 200 (86.2%) | 32 (13.8%) |
Income Below Poverty Among Single-Parent Households in Skyline
According to the poverty data in Skyline, 80.6% or 29 single-father households and 23.3% or 10 single-mother households are living below the poverty line. Among single-father households, those with 1 or 2 children have the highest poverty rate, with 25 households (100.0%) experiencing poverty. Likewise, among single-mother households, those with no children have the highest poverty rate, with 10 households (32.3%) falling below the poverty line.
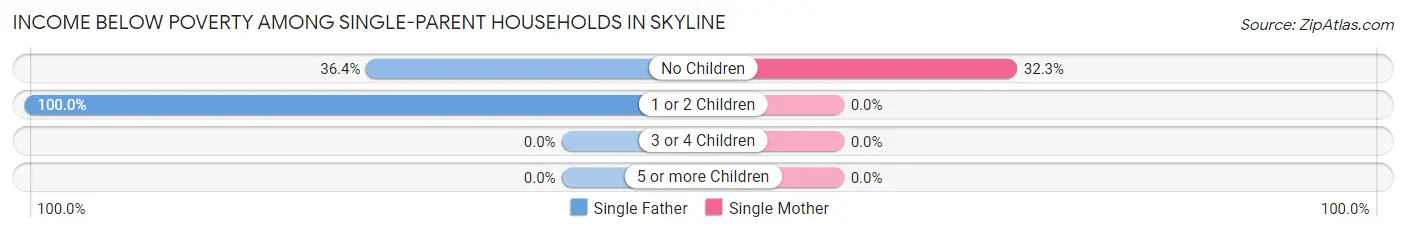
| Children | Single Father | Single Mother |
| No Children | 4 (36.4%) | 10 (32.3%) |
| 1 or 2 Children | 25 (100.0%) | 0 (0.0%) |
| 3 or 4 Children | 0 (0.0%) | 0 (0.0%) |
| 5 or more Children | 0 (0.0%) | 0 (0.0%) |
| Total | 29 (80.6%) | 10 (23.3%) |
Income Below Poverty Among Married-Couple vs Single-Parent Households in Skyline
The poverty data for Skyline shows that 32 of the married-couple family households (13.8%) and 39 of the single-parent households (49.4%) are living below the poverty level. Within the married-couple family households, those with 3 or 4 children have the highest poverty rate, with 2 households (40.0%) falling below the poverty line. Among the single-parent households, those with 1 or 2 children have the highest poverty rate, with 25 household (67.6%) living below poverty.
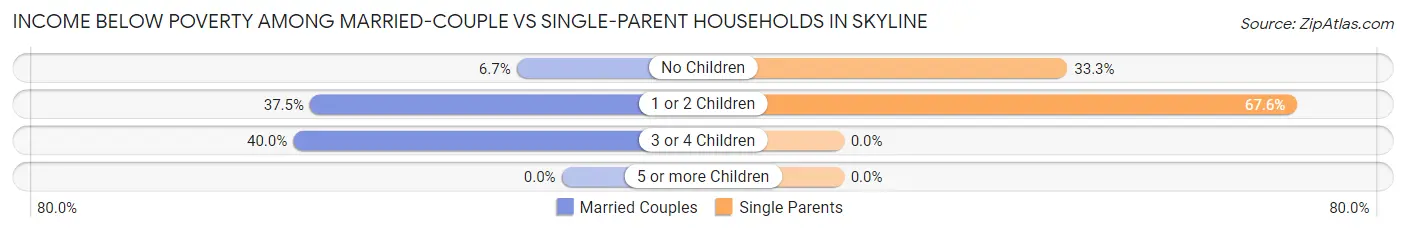
| Children | Married-Couple Families | Single-Parent Households |
| No Children | 12 (6.7%) | 14 (33.3%) |
| 1 or 2 Children | 18 (37.5%) | 25 (67.6%) |
| 3 or 4 Children | 2 (40.0%) | 0 (0.0%) |
| 5 or more Children | 0 (0.0%) | 0 (0.0%) |
| Total | 32 (13.8%) | 39 (49.4%) |
Employment Characteristics in Skyline
Employment by Class of Employer in Skyline
Among the 331 employed individuals in Skyline, private company employees (261 | 78.8%), local government employees (23 | 7.0%), and not-for-profit organizations (15 | 4.5%) make up the most common classes of employment.
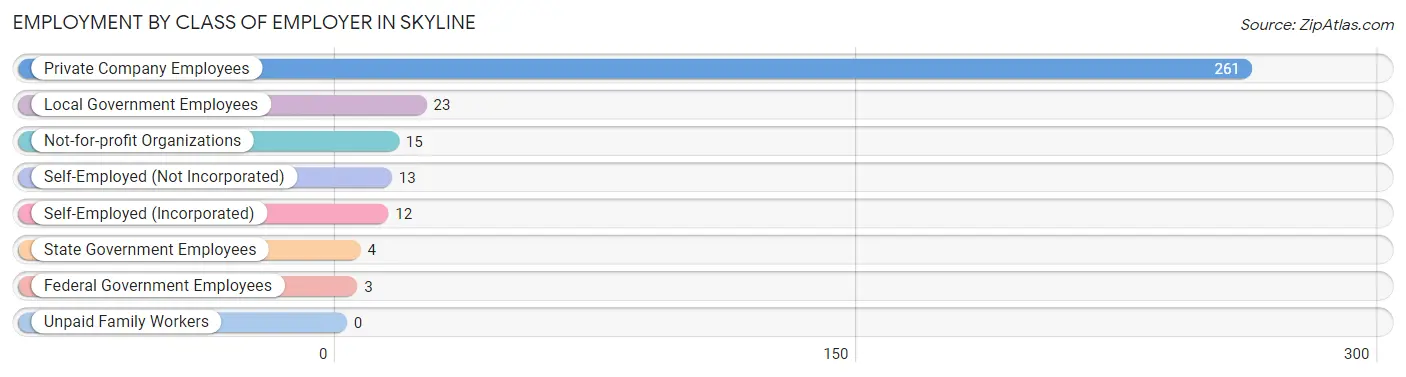
| Employer Class | # Employees | % Employees |
| Private Company Employees | 261 | 78.8% |
| Self-Employed (Incorporated) | 12 | 3.6% |
| Self-Employed (Not Incorporated) | 13 | 3.9% |
| Not-for-profit Organizations | 15 | 4.5% |
| Local Government Employees | 23 | 7.0% |
| State Government Employees | 4 | 1.2% |
| Federal Government Employees | 3 | 0.9% |
| Unpaid Family Workers | 0 | 0.0% |
| Total | 331 | 100.0% |
Employment Status by Age in Skyline
According to the labor force statistics for Skyline, out of the total population over 16 years of age (997), 35.6% or 355 individuals are in the labor force, with 4.5% or 16 of them unemployed. The age group with the highest labor force participation rate is 35 to 44 years, with 73.5% or 97 individuals in the labor force. Within the labor force, the 16 to 19 years age range has the highest percentage of unemployed individuals, with 38.5% or 10 of them being unemployed.
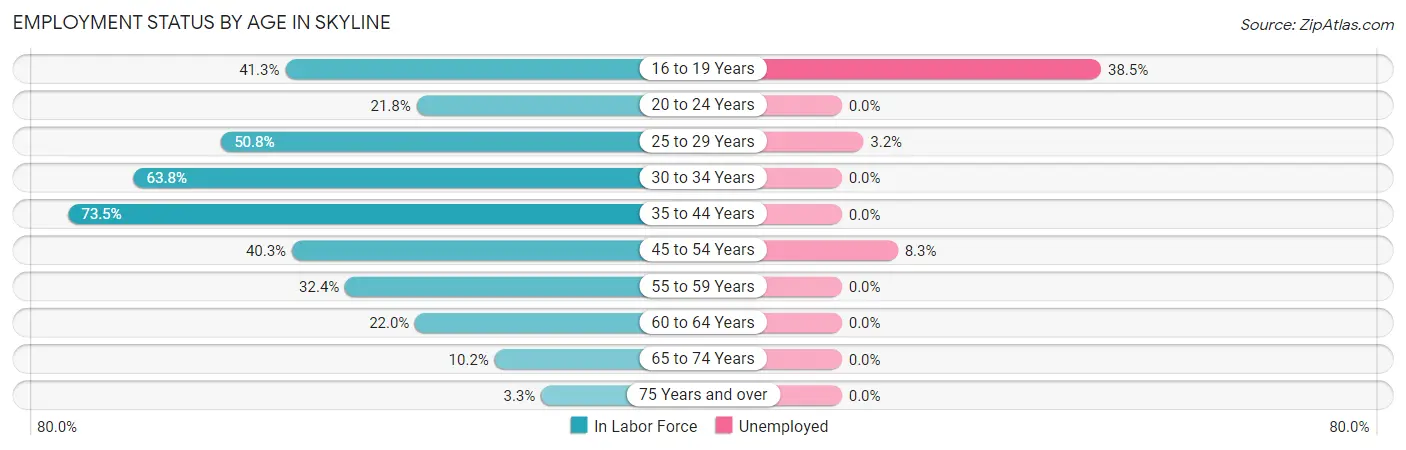
| Age Bracket | In Labor Force | Unemployed |
| 16 to 19 Years | 26 (41.3%) | 10 (38.5%) |
| 20 to 24 Years | 19 (21.8%) | 0 (0.0%) |
| 25 to 29 Years | 63 (50.8%) | 2 (3.2%) |
| 30 to 34 Years | 30 (63.8%) | 0 (0.0%) |
| 35 to 44 Years | 97 (73.5%) | 0 (0.0%) |
| 45 to 54 Years | 48 (40.3%) | 4 (8.3%) |
| 55 to 59 Years | 34 (32.4%) | 0 (0.0%) |
| 60 to 64 Years | 18 (22.0%) | 0 (0.0%) |
| 65 to 74 Years | 18 (10.2%) | 0 (0.0%) |
| 75 Years and over | 2 (3.3%) | 0 (0.0%) |
| Total | 355 (35.6%) | 16 (4.5%) |
Employment Status by Educational Attainment in Skyline
According to labor force statistics for Skyline, 47.6% of individuals (290) out of the total population between 25 and 64 years of age (609) are in the labor force, with 2.1% or 6 of them being unemployed. The group with the highest labor force participation rate are those with the educational attainment of bachelor's degree or higher, with 100.0% or 22 individuals in the labor force. Within the labor force, individuals with high school diploma education have the highest percentage of unemployment, with 5.0% or 6 of them being unemployed.
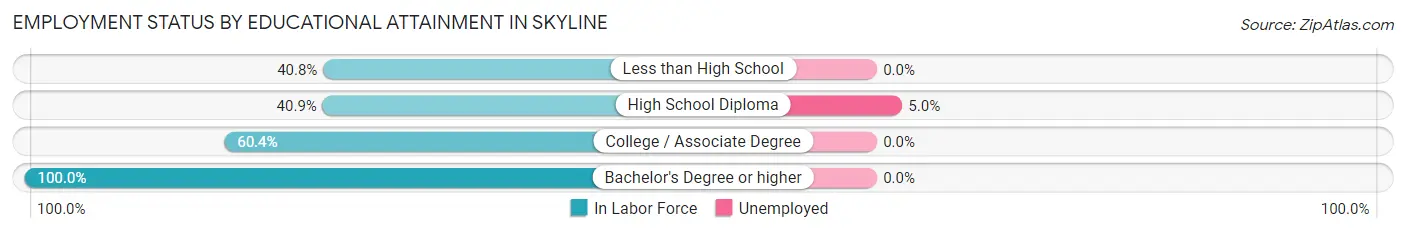
| Educational Attainment | In Labor Force | Unemployed |
| Less than High School | 62 (40.8%) | 0 (0.0%) |
| High School Diploma | 119 (40.9%) | 15 (5.0%) |
| College / Associate Degree | 87 (60.4%) | 0 (0.0%) |
| Bachelor's Degree or higher | 22 (100.0%) | 0 (0.0%) |
| Total | 290 (47.6%) | 13 (2.1%) |
Employment Occupations by Sex in Skyline
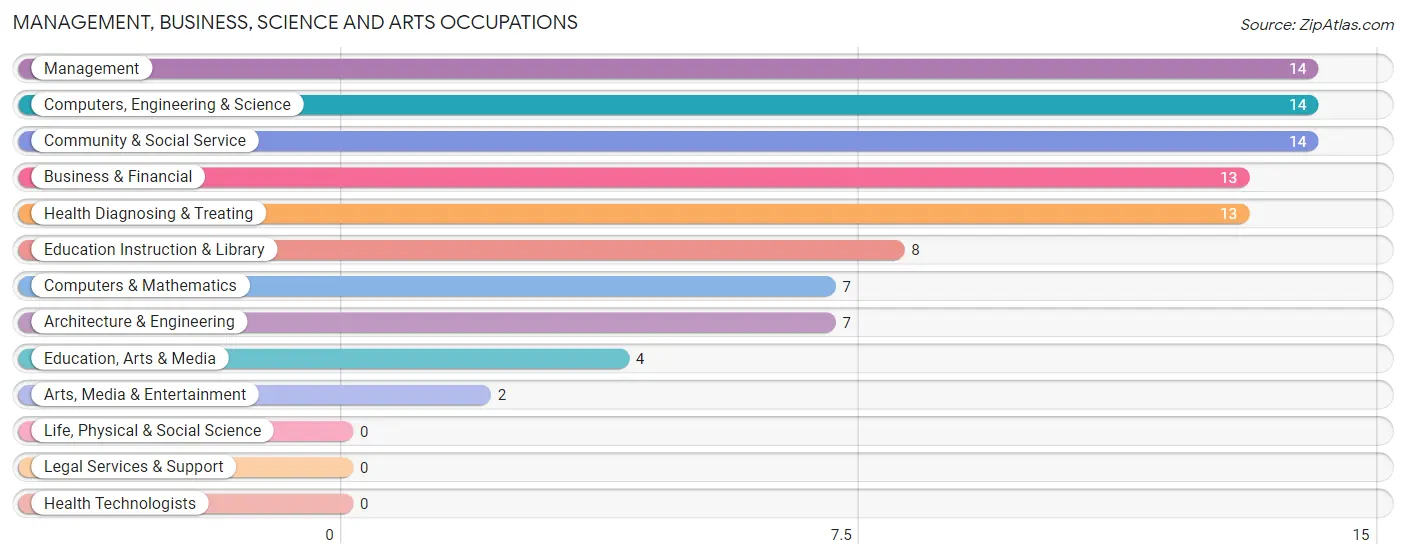
Management, Business, Science and Arts Occupations
The most common Management, Business, Science and Arts occupations in Skyline are Management (14 | 4.1%), Computers, Engineering & Science (14 | 4.1%), Community & Social Service (14 | 4.1%), Business & Financial (13 | 3.8%), and Health Diagnosing & Treating (13 | 3.8%).
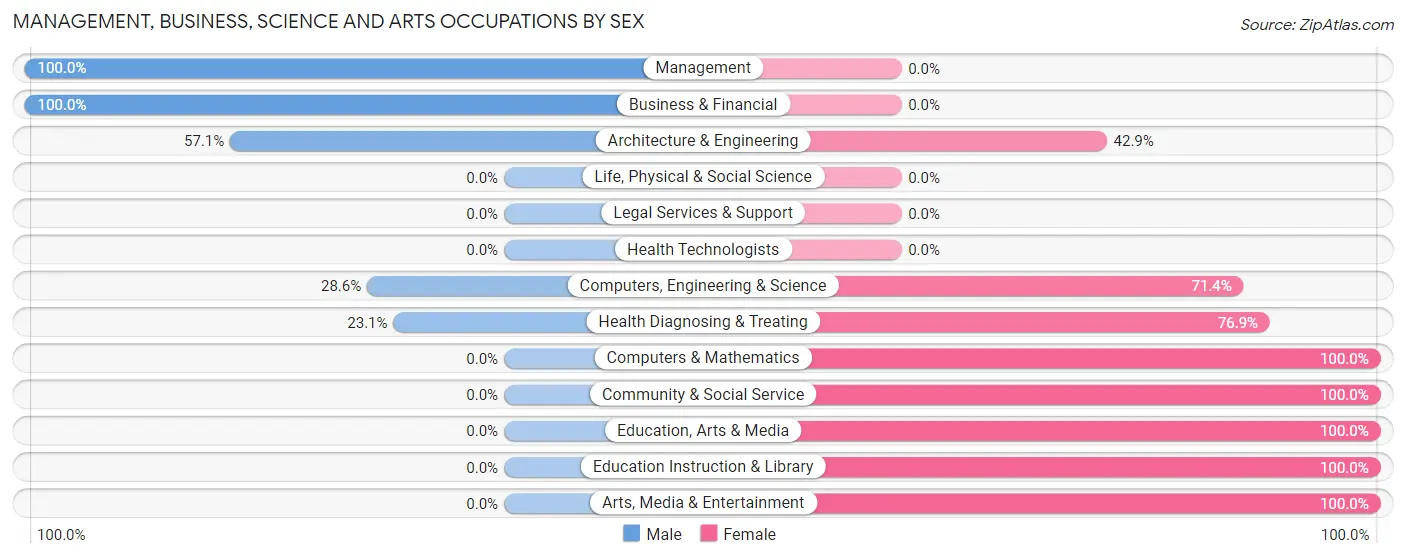
Management, Business, Science and Arts Occupations by Sex
Within the Management, Business, Science and Arts occupations in Skyline, the most male-oriented occupations are Management (100.0%), Business & Financial (100.0%), and Architecture & Engineering (57.1%), while the most female-oriented occupations are Computers & Mathematics (100.0%), Community & Social Service (100.0%), and Education, Arts & Media (100.0%).
| Occupation | Male | Female |
| Management | 14 (100.0%) | 0 (0.0%) |
| Business & Financial | 13 (100.0%) | 0 (0.0%) |
| Computers, Engineering & Science | 4 (28.6%) | 10 (71.4%) |
| Computers & Mathematics | 0 (0.0%) | 7 (100.0%) |
| Architecture & Engineering | 4 (57.1%) | 3 (42.9%) |
| Life, Physical & Social Science | 0 (0.0%) | 0 (0.0%) |
| Community & Social Service | 0 (0.0%) | 14 (100.0%) |
| Education, Arts & Media | 0 (0.0%) | 4 (100.0%) |
| Legal Services & Support | 0 (0.0%) | 0 (0.0%) |
| Education Instruction & Library | 0 (0.0%) | 8 (100.0%) |
| Arts, Media & Entertainment | 0 (0.0%) | 2 (100.0%) |
| Health Diagnosing & Treating | 3 (23.1%) | 10 (76.9%) |
| Health Technologists | 0 (0.0%) | 0 (0.0%) |
| Total (Category) | 34 (50.0%) | 34 (50.0%) |
| Total (Overall) | 213 (62.8%) | 126 (37.2%) |
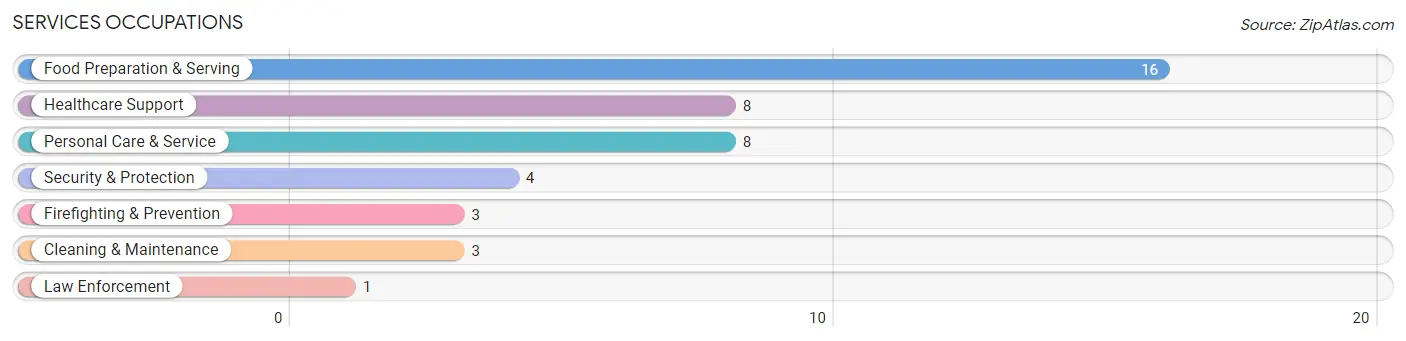
Services Occupations
The most common Services occupations in Skyline are Food Preparation & Serving (16 | 4.7%), Healthcare Support (8 | 2.4%), Personal Care & Service (8 | 2.4%), Security & Protection (4 | 1.2%), and Firefighting & Prevention (3 | 0.9%).
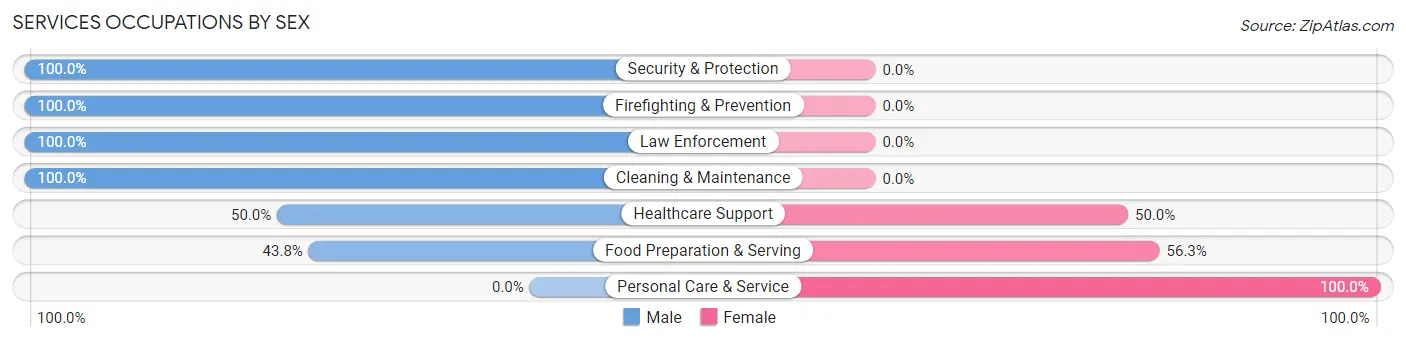
Services Occupations by Sex
Within the Services occupations in Skyline, the most male-oriented occupations are Security & Protection (100.0%), Firefighting & Prevention (100.0%), and Law Enforcement (100.0%), while the most female-oriented occupations are Personal Care & Service (100.0%), Food Preparation & Serving (56.2%), and Healthcare Support (50.0%).
| Occupation | Male | Female |
| Healthcare Support | 4 (50.0%) | 4 (50.0%) |
| Security & Protection | 4 (100.0%) | 0 (0.0%) |
| Firefighting & Prevention | 3 (100.0%) | 0 (0.0%) |
| Law Enforcement | 1 (100.0%) | 0 (0.0%) |
| Food Preparation & Serving | 7 (43.8%) | 9 (56.2%) |
| Cleaning & Maintenance | 3 (100.0%) | 0 (0.0%) |
| Personal Care & Service | 0 (0.0%) | 8 (100.0%) |
| Total (Category) | 18 (46.2%) | 21 (53.8%) |
| Total (Overall) | 213 (62.8%) | 126 (37.2%) |
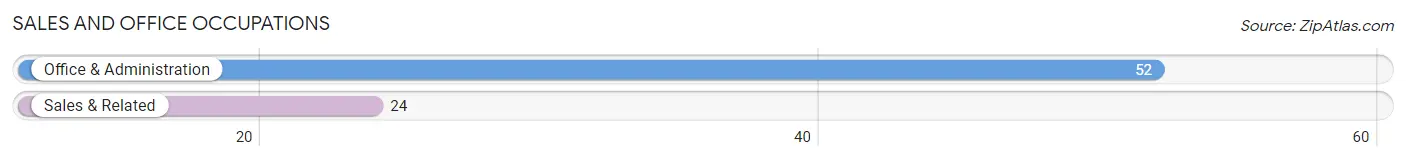
Sales and Office Occupations
The most common Sales and Office occupations in Skyline are Office & Administration (52 | 15.3%), and Sales & Related (24 | 7.1%).
Sales and Office Occupations by Sex
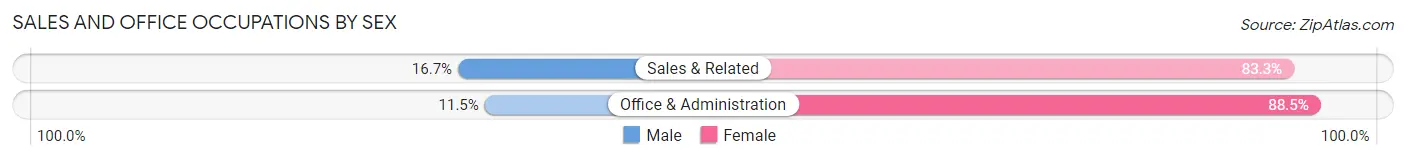
| Occupation | Male | Female |
| Sales & Related | 4 (16.7%) | 20 (83.3%) |
| Office & Administration | 6 (11.5%) | 46 (88.5%) |
| Total (Category) | 10 (13.2%) | 66 (86.8%) |
| Total (Overall) | 213 (62.8%) | 126 (37.2%) |
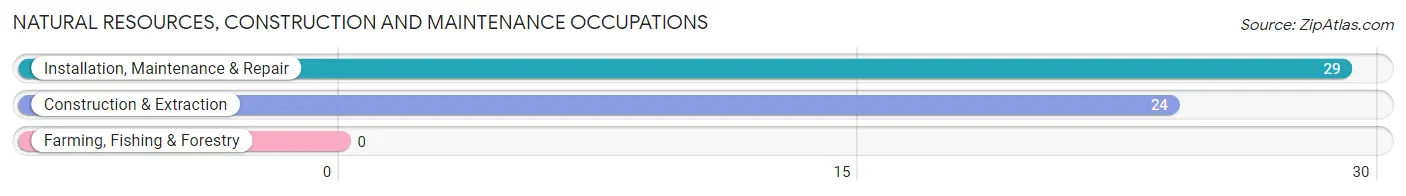
Natural Resources, Construction and Maintenance Occupations
The most common Natural Resources, Construction and Maintenance occupations in Skyline are Installation, Maintenance & Repair (29 | 8.6%), and Construction & Extraction (24 | 7.1%).
Natural Resources, Construction and Maintenance Occupations by Sex
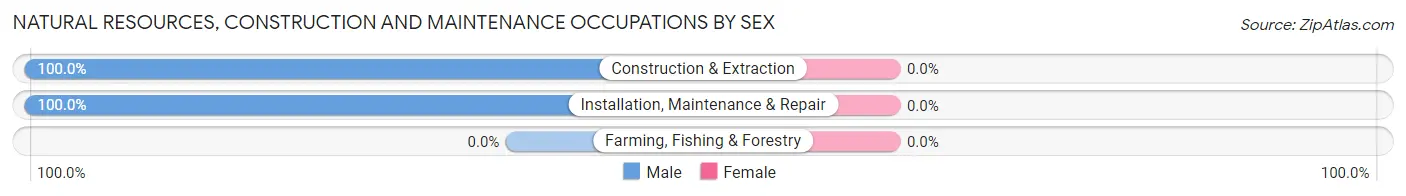
| Occupation | Male | Female |
| Farming, Fishing & Forestry | 0 (0.0%) | 0 (0.0%) |
| Construction & Extraction | 24 (100.0%) | 0 (0.0%) |
| Installation, Maintenance & Repair | 29 (100.0%) | 0 (0.0%) |
| Total (Category) | 53 (100.0%) | 0 (0.0%) |
| Total (Overall) | 213 (62.8%) | 126 (37.2%) |
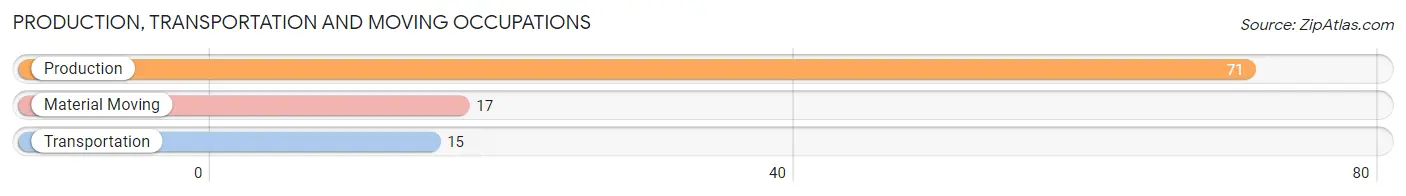
Production, Transportation and Moving Occupations
The most common Production, Transportation and Moving occupations in Skyline are Production (71 | 20.9%), Material Moving (17 | 5.0%), and Transportation (15 | 4.4%).
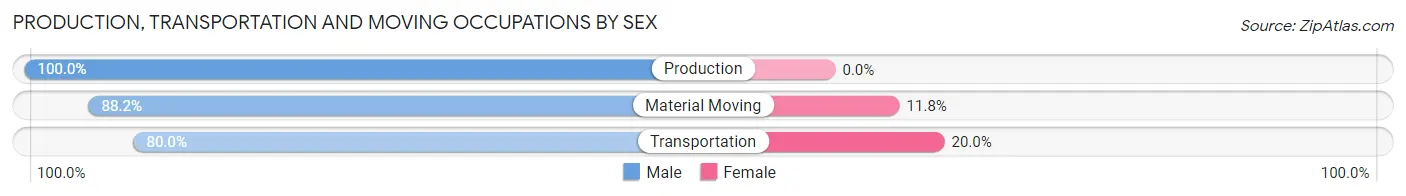
Production, Transportation and Moving Occupations by Sex
| Occupation | Male | Female |
| Production | 71 (100.0%) | 0 (0.0%) |
| Transportation | 12 (80.0%) | 3 (20.0%) |
| Material Moving | 15 (88.2%) | 2 (11.8%) |
| Total (Category) | 98 (95.2%) | 5 (4.9%) |
| Total (Overall) | 213 (62.8%) | 126 (37.2%) |
Employment Industries by Sex in Skyline
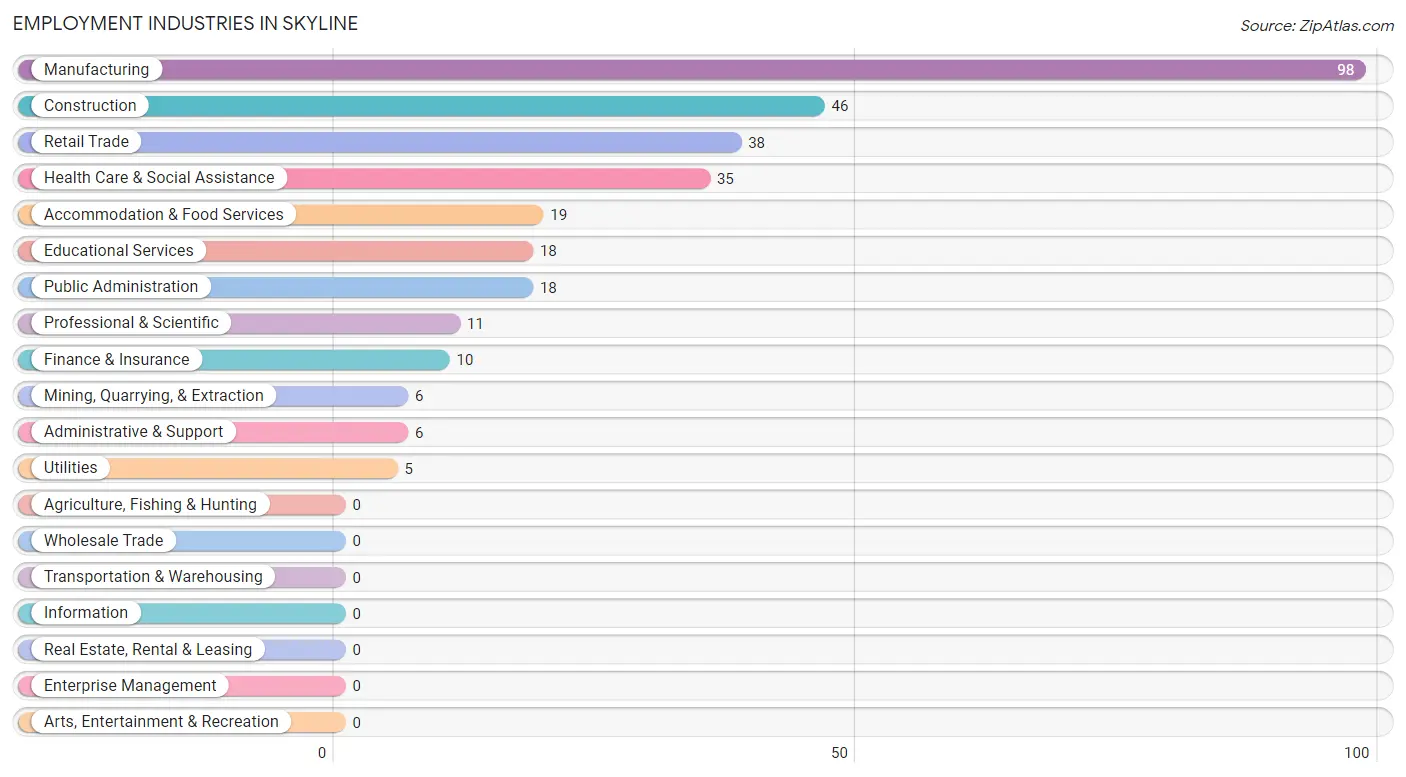
Employment Industries in Skyline
The major employment industries in Skyline include Manufacturing (98 | 28.9%), Construction (46 | 13.6%), Retail Trade (38 | 11.2%), Health Care & Social Assistance (35 | 10.3%), and Accommodation & Food Services (19 | 5.6%).
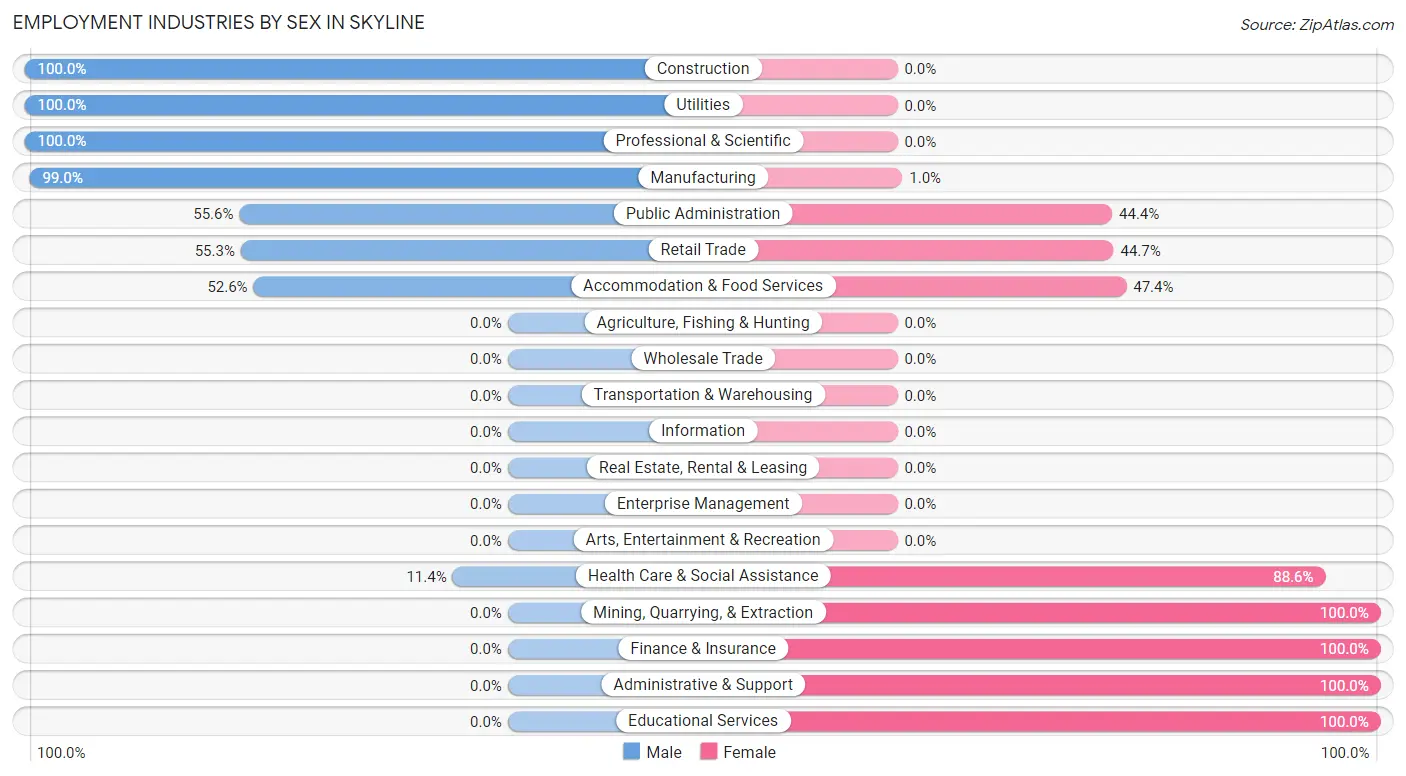
Employment Industries by Sex in Skyline
The Skyline industries that see more men than women are Construction (100.0%), Utilities (100.0%), and Professional & Scientific (100.0%), whereas the industries that tend to have a higher number of women are Mining, Quarrying, & Extraction (100.0%), Finance & Insurance (100.0%), and Administrative & Support (100.0%).
| Industry | Male | Female |
| Agriculture, Fishing & Hunting | 0 (0.0%) | 0 (0.0%) |
| Mining, Quarrying, & Extraction | 0 (0.0%) | 6 (100.0%) |
| Construction | 46 (100.0%) | 0 (0.0%) |
| Manufacturing | 97 (99.0%) | 1 (1.0%) |
| Wholesale Trade | 0 (0.0%) | 0 (0.0%) |
| Retail Trade | 21 (55.3%) | 17 (44.7%) |
| Transportation & Warehousing | 0 (0.0%) | 0 (0.0%) |
| Utilities | 5 (100.0%) | 0 (0.0%) |
| Information | 0 (0.0%) | 0 (0.0%) |
| Finance & Insurance | 0 (0.0%) | 10 (100.0%) |
| Real Estate, Rental & Leasing | 0 (0.0%) | 0 (0.0%) |
| Professional & Scientific | 11 (100.0%) | 0 (0.0%) |
| Enterprise Management | 0 (0.0%) | 0 (0.0%) |
| Administrative & Support | 0 (0.0%) | 6 (100.0%) |
| Educational Services | 0 (0.0%) | 18 (100.0%) |
| Health Care & Social Assistance | 4 (11.4%) | 31 (88.6%) |
| Arts, Entertainment & Recreation | 0 (0.0%) | 0 (0.0%) |
| Accommodation & Food Services | 10 (52.6%) | 9 (47.4%) |
| Public Administration | 10 (55.6%) | 8 (44.4%) |
| Total | 213 (62.8%) | 126 (37.2%) |
Education in Skyline
School Enrollment in Skyline
The most common levels of schooling among the 163 students in Skyline are college / undergraduate (42 | 25.8%), high school (39 | 23.9%), and middle school (30 | 18.4%).
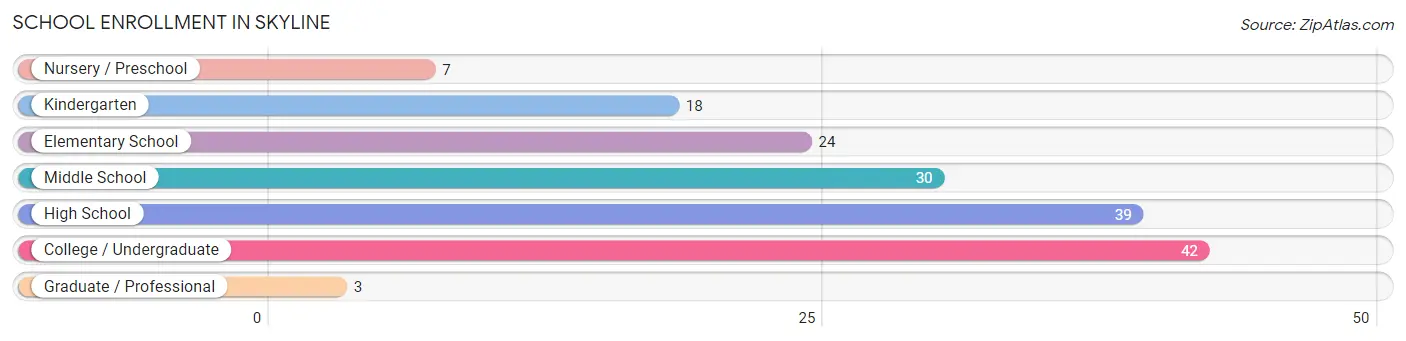
| School Level | # Students | % Students |
| Nursery / Preschool | 7 | 4.3% |
| Kindergarten | 18 | 11.0% |
| Elementary School | 24 | 14.7% |
| Middle School | 30 | 18.4% |
| High School | 39 | 23.9% |
| College / Undergraduate | 42 | 25.8% |
| Graduate / Professional | 3 | 1.8% |
| Total | 163 | 100.0% |
School Enrollment by Age by Funding Source in Skyline
Out of a total of 163 students who are enrolled in schools in Skyline, 17 (10.4%) attend a private institution, while the remaining 146 (89.6%) are enrolled in public schools. The age group of 25 to 34 year olds has the highest likelihood of being enrolled in private schools, with 4 (80.0% in the age bracket) enrolled. Conversely, the age group of 5 to 9 year old has the lowest likelihood of being enrolled in a private school, with 44 (100.0% in the age bracket) attending a public institution.
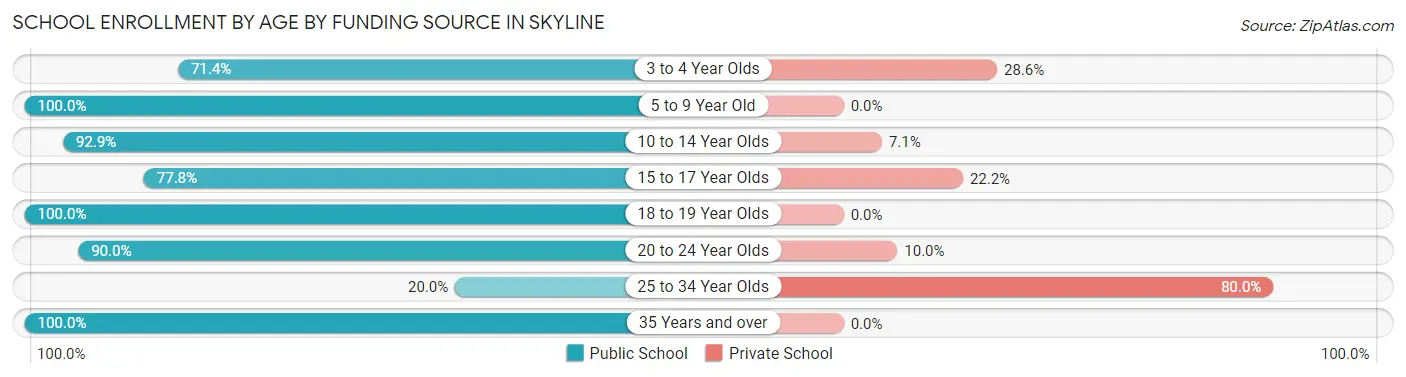
| Age Bracket | Public School | Private School |
| 3 to 4 Year Olds | 5 (71.4%) | 2 (28.6%) |
| 5 to 9 Year Old | 44 (100.0%) | 0 (0.0%) |
| 10 to 14 Year Olds | 26 (92.9%) | 2 (7.1%) |
| 15 to 17 Year Olds | 28 (77.8%) | 8 (22.2%) |
| 18 to 19 Year Olds | 26 (100.0%) | 0 (0.0%) |
| 20 to 24 Year Olds | 9 (90.0%) | 1 (10.0%) |
| 25 to 34 Year Olds | 1 (20.0%) | 4 (80.0%) |
| 35 Years and over | 7 (100.0%) | 0 (0.0%) |
| Total | 146 (89.6%) | 17 (10.4%) |
Educational Attainment by Field of Study in Skyline
Business (14 | 46.7%), arts & humanities (5 | 16.7%), education (3 | 10.0%), literature & languages (3 | 10.0%), and communications (3 | 10.0%) are the most common fields of study among 30 individuals in Skyline who have obtained a bachelor's degree or higher.
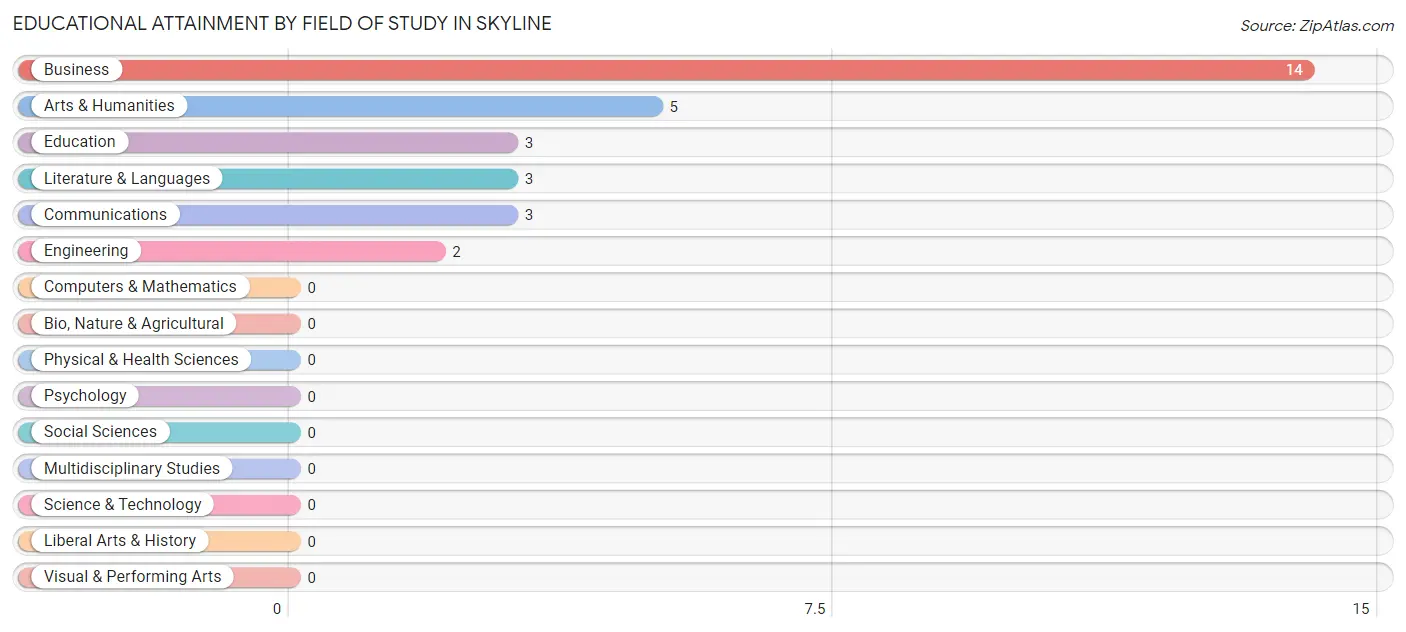
| Field of Study | # Graduates | % Graduates |
| Computers & Mathematics | 0 | 0.0% |
| Bio, Nature & Agricultural | 0 | 0.0% |
| Physical & Health Sciences | 0 | 0.0% |
| Psychology | 0 | 0.0% |
| Social Sciences | 0 | 0.0% |
| Engineering | 2 | 6.7% |
| Multidisciplinary Studies | 0 | 0.0% |
| Science & Technology | 0 | 0.0% |
| Business | 14 | 46.7% |
| Education | 3 | 10.0% |
| Literature & Languages | 3 | 10.0% |
| Liberal Arts & History | 0 | 0.0% |
| Visual & Performing Arts | 0 | 0.0% |
| Communications | 3 | 10.0% |
| Arts & Humanities | 5 | 16.7% |
| Total | 30 | 100.0% |
Transportation & Commute in Skyline
Vehicle Availability by Sex in Skyline
The most prevalent vehicle ownership categories in Skyline are males with 2 vehicles (104, accounting for 50.2%) and females with 2 vehicles (33, making up 83.9%).
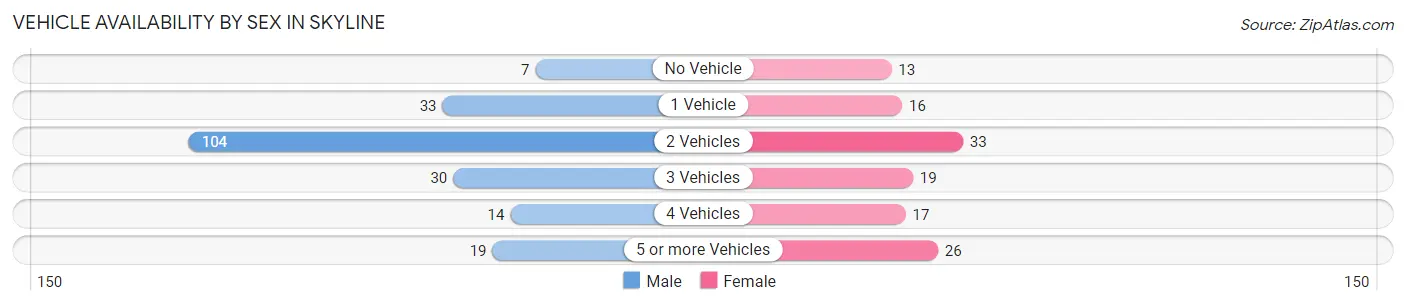
| Vehicles Available | Male | Female |
| No Vehicle | 7 (3.4%) | 13 (10.5%) |
| 1 Vehicle | 33 (15.9%) | 16 (12.9%) |
| 2 Vehicles | 104 (50.2%) | 33 (26.6%) |
| 3 Vehicles | 30 (14.5%) | 19 (15.3%) |
| 4 Vehicles | 14 (6.8%) | 17 (13.7%) |
| 5 or more Vehicles | 19 (9.2%) | 26 (21.0%) |
| Total | 207 (100.0%) | 124 (100.0%) |
Commute Time in Skyline
The most frequently occuring commute durations in Skyline are 20 to 24 minutes (99 commuters, 31.2%), 60 to 89 minutes (45 commuters, 14.2%), and 5 to 9 minutes (43 commuters, 13.6%).
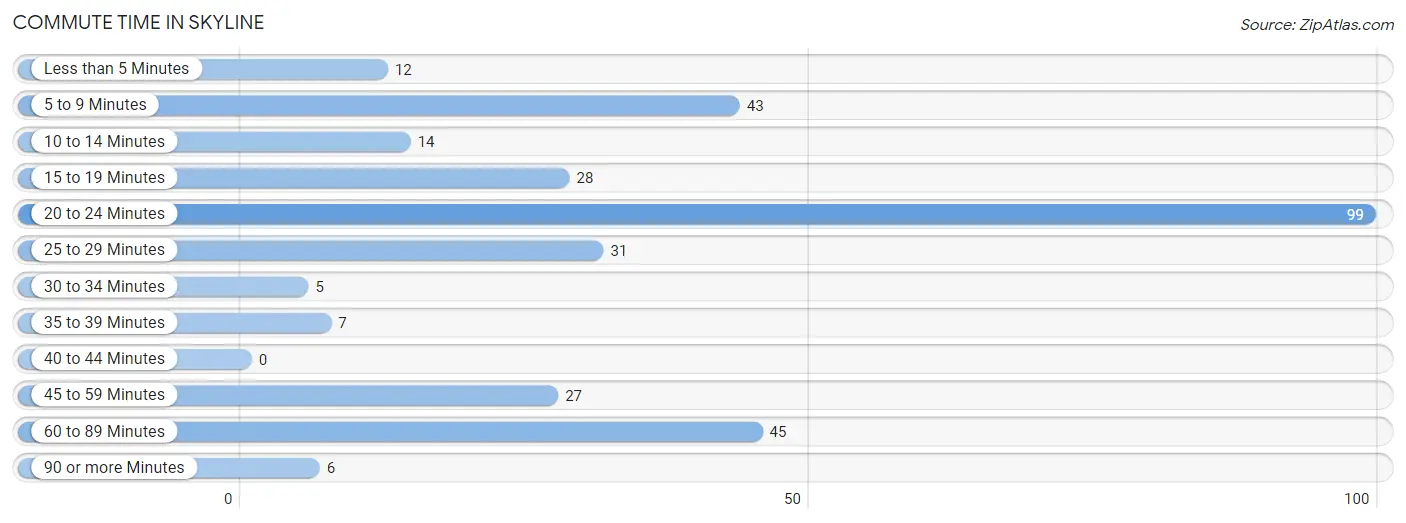
| Commute Time | # Commuters | % Commuters |
| Less than 5 Minutes | 12 | 3.8% |
| 5 to 9 Minutes | 43 | 13.6% |
| 10 to 14 Minutes | 14 | 4.4% |
| 15 to 19 Minutes | 28 | 8.8% |
| 20 to 24 Minutes | 99 | 31.2% |
| 25 to 29 Minutes | 31 | 9.8% |
| 30 to 34 Minutes | 5 | 1.6% |
| 35 to 39 Minutes | 7 | 2.2% |
| 40 to 44 Minutes | 0 | 0.0% |
| 45 to 59 Minutes | 27 | 8.5% |
| 60 to 89 Minutes | 45 | 14.2% |
| 90 or more Minutes | 6 | 1.9% |
Commute Time by Sex in Skyline
The most common commute times in Skyline are 20 to 24 minutes (67 commuters, 34.2%) for males and 20 to 24 minutes (32 commuters, 26.5%) for females.
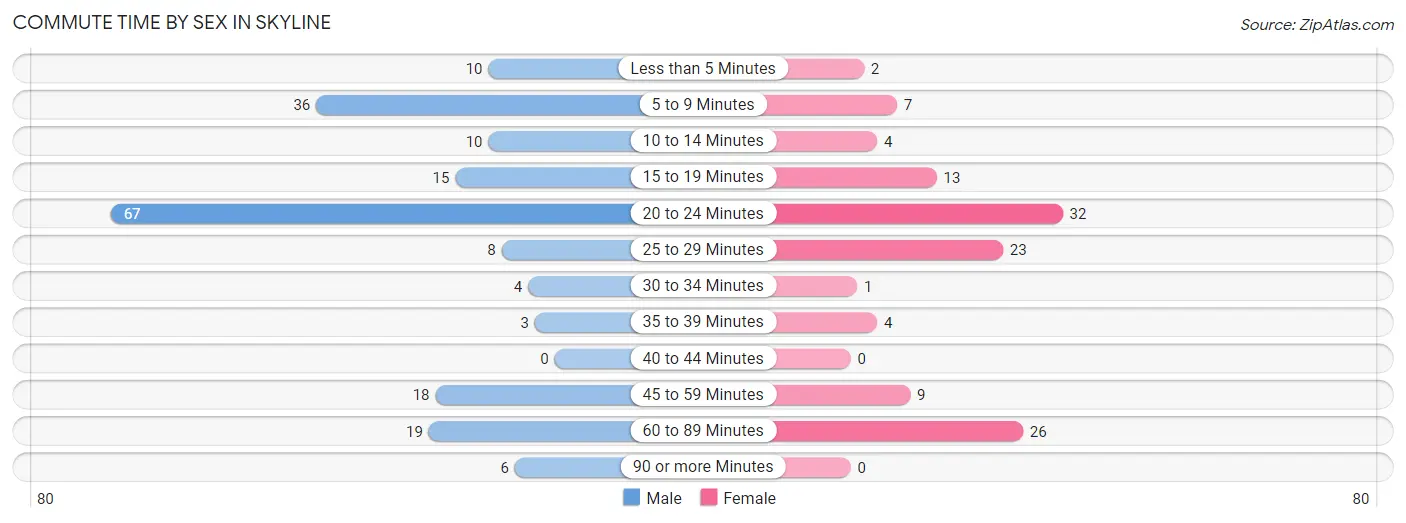
| Commute Time | Male | Female |
| Less than 5 Minutes | 10 (5.1%) | 2 (1.7%) |
| 5 to 9 Minutes | 36 (18.4%) | 7 (5.8%) |
| 10 to 14 Minutes | 10 (5.1%) | 4 (3.3%) |
| 15 to 19 Minutes | 15 (7.6%) | 13 (10.7%) |
| 20 to 24 Minutes | 67 (34.2%) | 32 (26.5%) |
| 25 to 29 Minutes | 8 (4.1%) | 23 (19.0%) |
| 30 to 34 Minutes | 4 (2.0%) | 1 (0.8%) |
| 35 to 39 Minutes | 3 (1.5%) | 4 (3.3%) |
| 40 to 44 Minutes | 0 (0.0%) | 0 (0.0%) |
| 45 to 59 Minutes | 18 (9.2%) | 9 (7.4%) |
| 60 to 89 Minutes | 19 (9.7%) | 26 (21.5%) |
| 90 or more Minutes | 6 (3.1%) | 0 (0.0%) |
Time of Departure to Work by Sex in Skyline
The most frequent times of departure to work in Skyline are 7:00 AM to 7:29 AM (37, 18.9%) for males and 6:00 AM to 6:29 AM (24, 19.8%) for females.
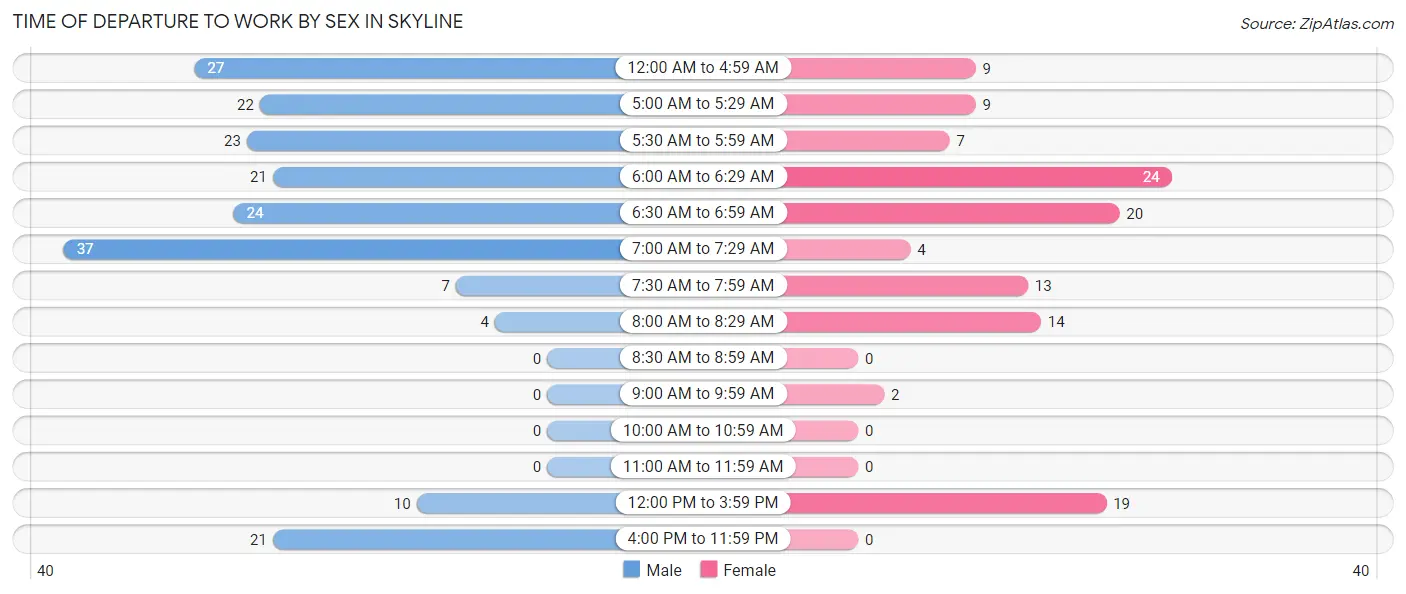
| Time of Departure | Male | Female |
| 12:00 AM to 4:59 AM | 27 (13.8%) | 9 (7.4%) |
| 5:00 AM to 5:29 AM | 22 (11.2%) | 9 (7.4%) |
| 5:30 AM to 5:59 AM | 23 (11.7%) | 7 (5.8%) |
| 6:00 AM to 6:29 AM | 21 (10.7%) | 24 (19.8%) |
| 6:30 AM to 6:59 AM | 24 (12.2%) | 20 (16.5%) |
| 7:00 AM to 7:29 AM | 37 (18.9%) | 4 (3.3%) |
| 7:30 AM to 7:59 AM | 7 (3.6%) | 13 (10.7%) |
| 8:00 AM to 8:29 AM | 4 (2.0%) | 14 (11.6%) |
| 8:30 AM to 8:59 AM | 0 (0.0%) | 0 (0.0%) |
| 9:00 AM to 9:59 AM | 0 (0.0%) | 2 (1.7%) |
| 10:00 AM to 10:59 AM | 0 (0.0%) | 0 (0.0%) |
| 11:00 AM to 11:59 AM | 0 (0.0%) | 0 (0.0%) |
| 12:00 PM to 3:59 PM | 10 (5.1%) | 19 (15.7%) |
| 4:00 PM to 11:59 PM | 21 (10.7%) | 0 (0.0%) |
| Total | 196 (100.0%) | 121 (100.0%) |
Housing Occupancy in Skyline
Occupancy by Ownership in Skyline
Of the total 394 dwellings in Skyline, owner-occupied units account for 340 (86.3%), while renter-occupied units make up 54 (13.7%).
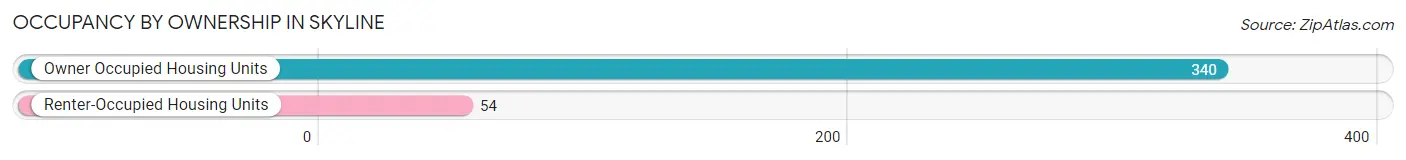
| Occupancy | # Housing Units | % Housing Units |
| Owner Occupied Housing Units | 340 | 86.3% |
| Renter-Occupied Housing Units | 54 | 13.7% |
| Total Occupied Housing Units | 394 | 100.0% |
Occupancy by Household Size in Skyline
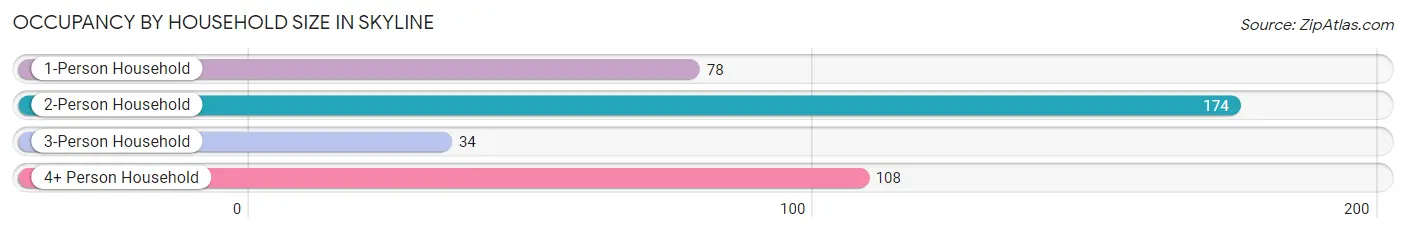
| Household Size | # Housing Units | % Housing Units |
| 1-Person Household | 78 | 19.8% |
| 2-Person Household | 174 | 44.2% |
| 3-Person Household | 34 | 8.6% |
| 4+ Person Household | 108 | 27.4% |
| Total Housing Units | 394 | 100.0% |
Occupancy by Ownership by Household Size in Skyline
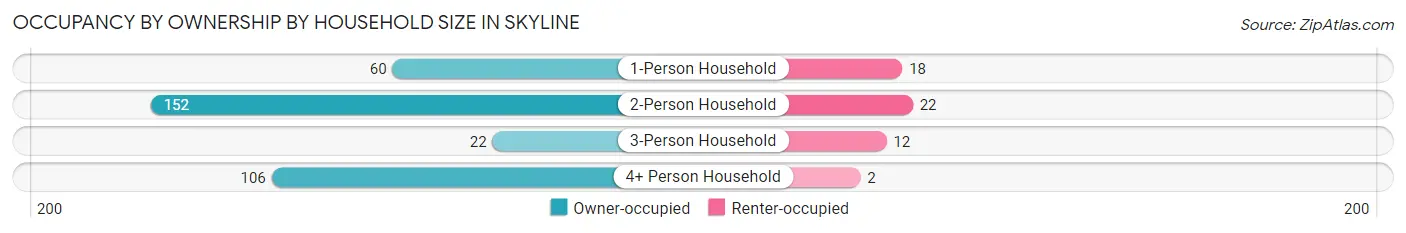
| Household Size | Owner-occupied | Renter-occupied |
| 1-Person Household | 60 (76.9%) | 18 (23.1%) |
| 2-Person Household | 152 (87.4%) | 22 (12.6%) |
| 3-Person Household | 22 (64.7%) | 12 (35.3%) |
| 4+ Person Household | 106 (98.2%) | 2 (1.8%) |
| Total Housing Units | 340 (86.3%) | 54 (13.7%) |
Occupancy by Educational Attainment in Skyline
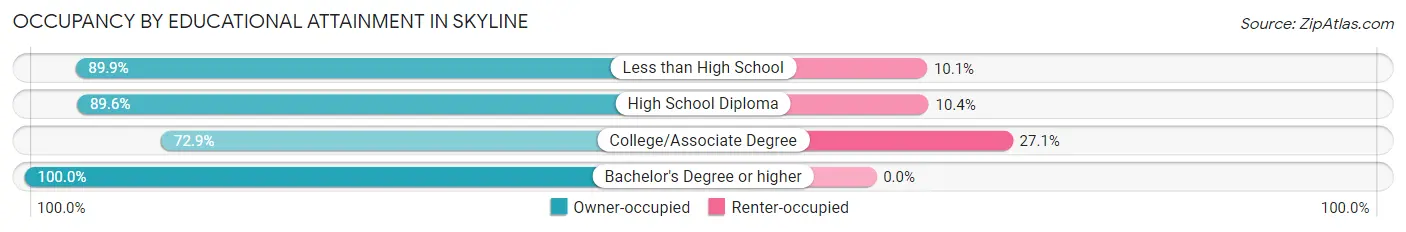
| Household Size | Owner-occupied | Renter-occupied |
| Less than High School | 134 (89.9%) | 15 (10.1%) |
| High School Diploma | 138 (89.6%) | 16 (10.4%) |
| College/Associate Degree | 62 (72.9%) | 23 (27.1%) |
| Bachelor's Degree or higher | 6 (100.0%) | 0 (0.0%) |
Occupancy by Age of Householder in Skyline
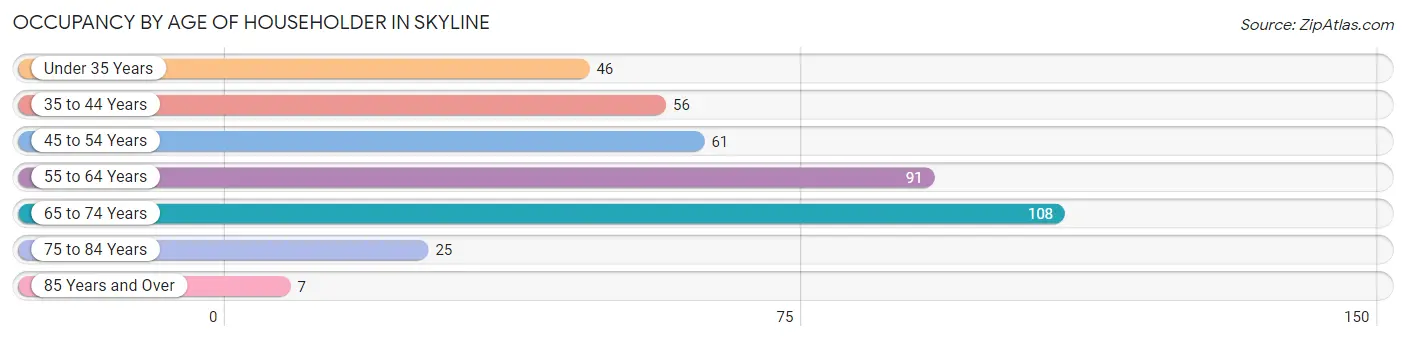
| Age Bracket | # Households | % Households |
| Under 35 Years | 46 | 11.7% |
| 35 to 44 Years | 56 | 14.2% |
| 45 to 54 Years | 61 | 15.5% |
| 55 to 64 Years | 91 | 23.1% |
| 65 to 74 Years | 108 | 27.4% |
| 75 to 84 Years | 25 | 6.4% |
| 85 Years and Over | 7 | 1.8% |
| Total | 394 | 100.0% |
Housing Finances in Skyline
Median Income by Occupancy in Skyline
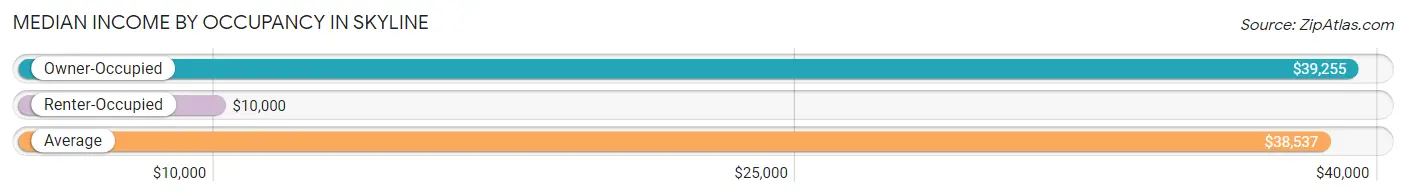
| Occupancy Type | # Households | Median Income |
| Owner-Occupied | 340 (86.3%) | $39,255 |
| Renter-Occupied | 54 (13.7%) | $10,000 |
| Average | 394 (100.0%) | $38,537 |
Occupancy by Householder Income Bracket in Skyline
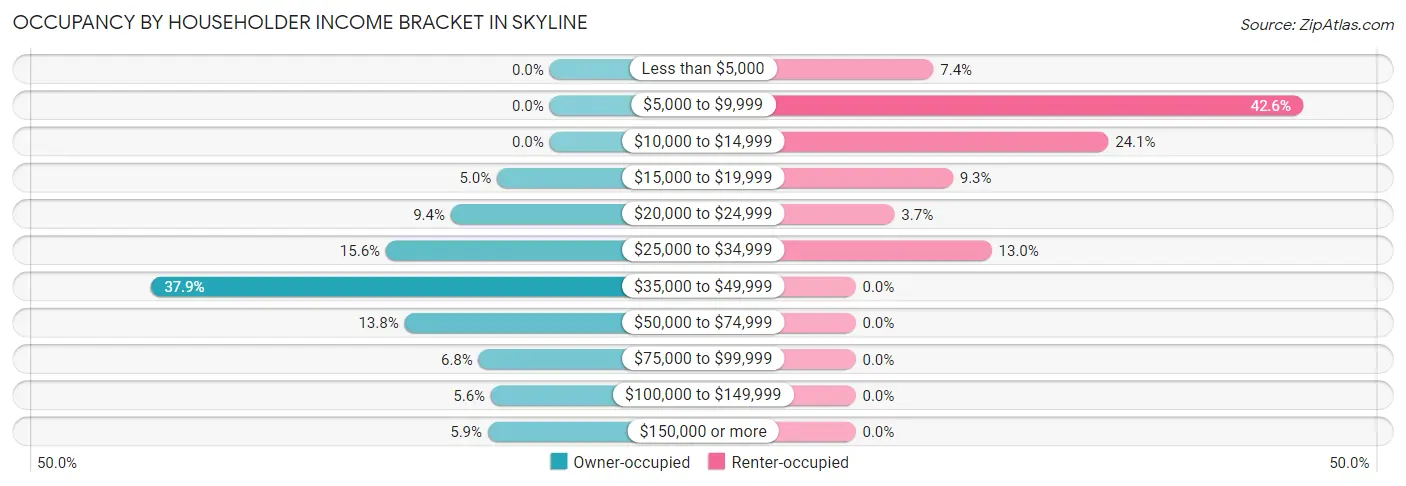
| Income Bracket | Owner-occupied | Renter-occupied |
| Less than $5,000 | 0 (0.0%) | 4 (7.4%) |
| $5,000 to $9,999 | 0 (0.0%) | 23 (42.6%) |
| $10,000 to $14,999 | 0 (0.0%) | 13 (24.1%) |
| $15,000 to $19,999 | 17 (5.0%) | 5 (9.3%) |
| $20,000 to $24,999 | 32 (9.4%) | 2 (3.7%) |
| $25,000 to $34,999 | 53 (15.6%) | 7 (13.0%) |
| $35,000 to $49,999 | 129 (37.9%) | 0 (0.0%) |
| $50,000 to $74,999 | 47 (13.8%) | 0 (0.0%) |
| $75,000 to $99,999 | 23 (6.8%) | 0 (0.0%) |
| $100,000 to $149,999 | 19 (5.6%) | 0 (0.0%) |
| $150,000 or more | 20 (5.9%) | 0 (0.0%) |
| Total | 340 (100.0%) | 54 (100.0%) |
Monthly Housing Cost Tiers in Skyline
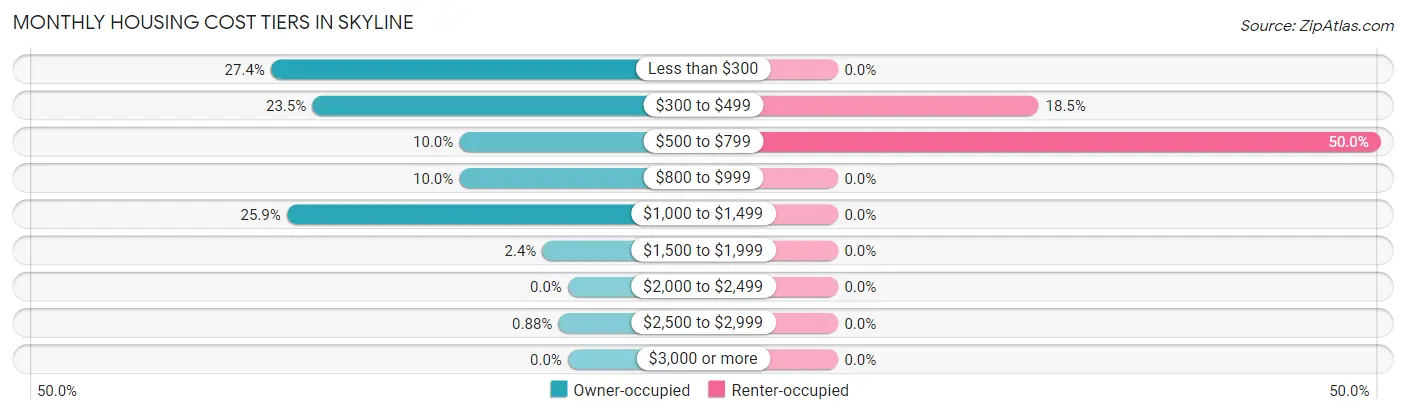
| Monthly Cost | Owner-occupied | Renter-occupied |
| Less than $300 | 93 (27.4%) | 0 (0.0%) |
| $300 to $499 | 80 (23.5%) | 10 (18.5%) |
| $500 to $799 | 34 (10.0%) | 27 (50.0%) |
| $800 to $999 | 34 (10.0%) | 0 (0.0%) |
| $1,000 to $1,499 | 88 (25.9%) | 0 (0.0%) |
| $1,500 to $1,999 | 8 (2.4%) | 0 (0.0%) |
| $2,000 to $2,499 | 0 (0.0%) | 0 (0.0%) |
| $2,500 to $2,999 | 3 (0.9%) | 0 (0.0%) |
| $3,000 or more | 0 (0.0%) | 0 (0.0%) |
| Total | 340 (100.0%) | 54 (100.0%) |
Physical Housing Characteristics in Skyline
Housing Structures in Skyline
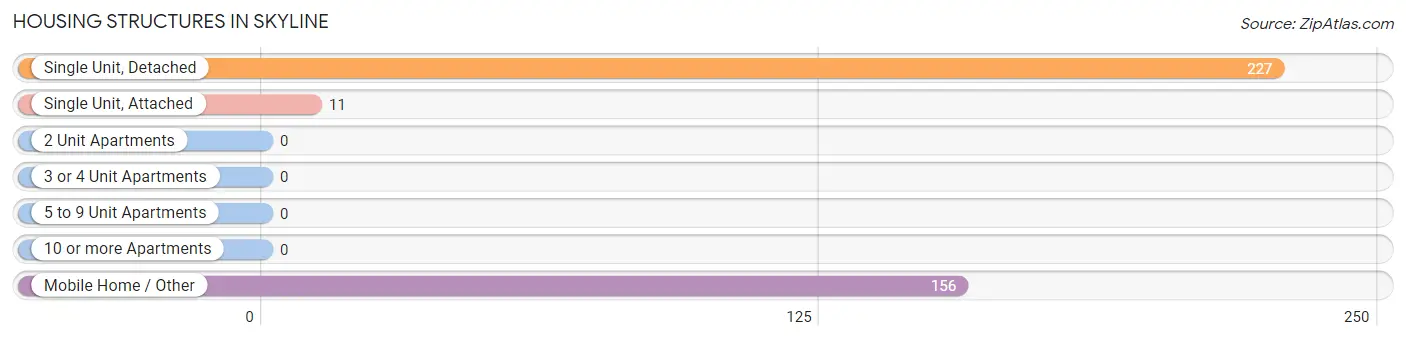
| Structure Type | # Housing Units | % Housing Units |
| Single Unit, Detached | 227 | 57.6% |
| Single Unit, Attached | 11 | 2.8% |
| 2 Unit Apartments | 0 | 0.0% |
| 3 or 4 Unit Apartments | 0 | 0.0% |
| 5 to 9 Unit Apartments | 0 | 0.0% |
| 10 or more Apartments | 0 | 0.0% |
| Mobile Home / Other | 156 | 39.6% |
| Total | 394 | 100.0% |
Housing Structures by Occupancy in Skyline
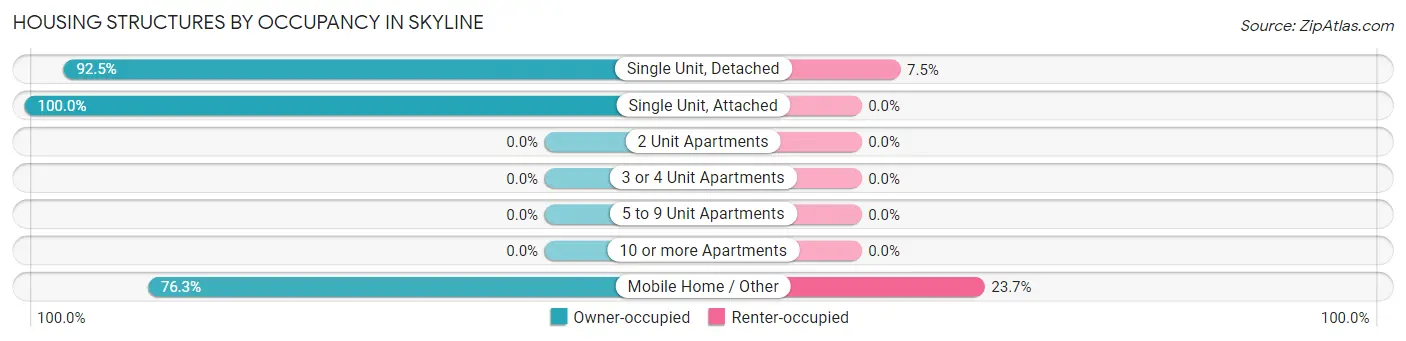
| Structure Type | Owner-occupied | Renter-occupied |
| Single Unit, Detached | 210 (92.5%) | 17 (7.5%) |
| Single Unit, Attached | 11 (100.0%) | 0 (0.0%) |
| 2 Unit Apartments | 0 (0.0%) | 0 (0.0%) |
| 3 or 4 Unit Apartments | 0 (0.0%) | 0 (0.0%) |
| 5 to 9 Unit Apartments | 0 (0.0%) | 0 (0.0%) |
| 10 or more Apartments | 0 (0.0%) | 0 (0.0%) |
| Mobile Home / Other | 119 (76.3%) | 37 (23.7%) |
| Total | 340 (86.3%) | 54 (13.7%) |
Housing Structures by Number of Rooms in Skyline
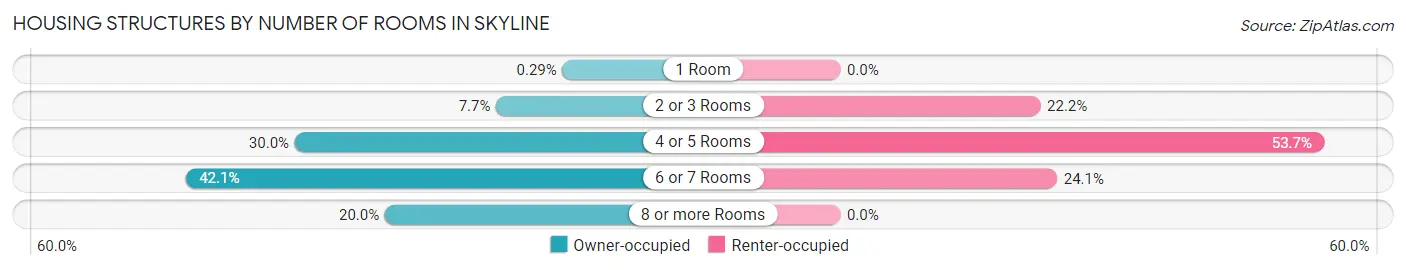
| Number of Rooms | Owner-occupied | Renter-occupied |
| 1 Room | 1 (0.3%) | 0 (0.0%) |
| 2 or 3 Rooms | 26 (7.6%) | 12 (22.2%) |
| 4 or 5 Rooms | 102 (30.0%) | 29 (53.7%) |
| 6 or 7 Rooms | 143 (42.1%) | 13 (24.1%) |
| 8 or more Rooms | 68 (20.0%) | 0 (0.0%) |
| Total | 340 (100.0%) | 54 (100.0%) |
Housing Structure by Heating Type in Skyline
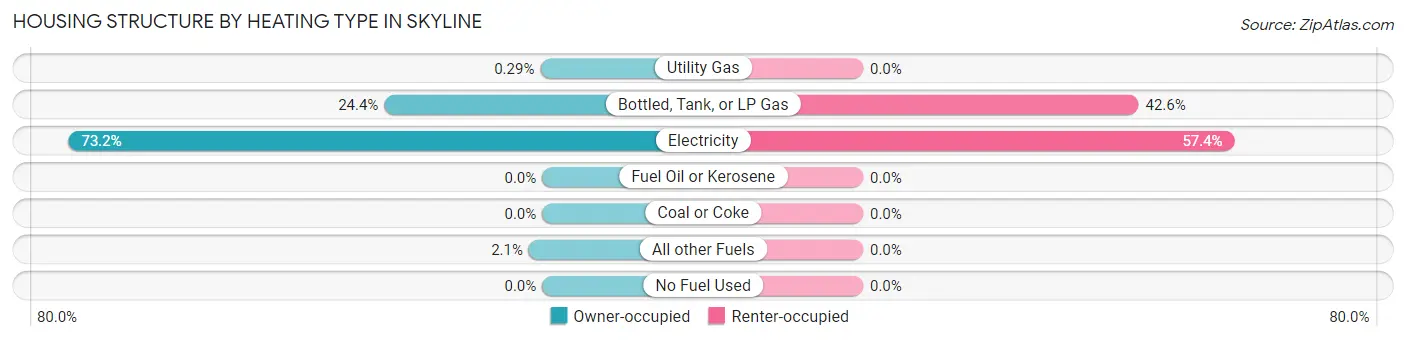
| Heating Type | Owner-occupied | Renter-occupied |
| Utility Gas | 1 (0.3%) | 0 (0.0%) |
| Bottled, Tank, or LP Gas | 83 (24.4%) | 23 (42.6%) |
| Electricity | 249 (73.2%) | 31 (57.4%) |
| Fuel Oil or Kerosene | 0 (0.0%) | 0 (0.0%) |
| Coal or Coke | 0 (0.0%) | 0 (0.0%) |
| All other Fuels | 7 (2.1%) | 0 (0.0%) |
| No Fuel Used | 0 (0.0%) | 0 (0.0%) |
| Total | 340 (100.0%) | 54 (100.0%) |
Household Vehicle Usage in Skyline
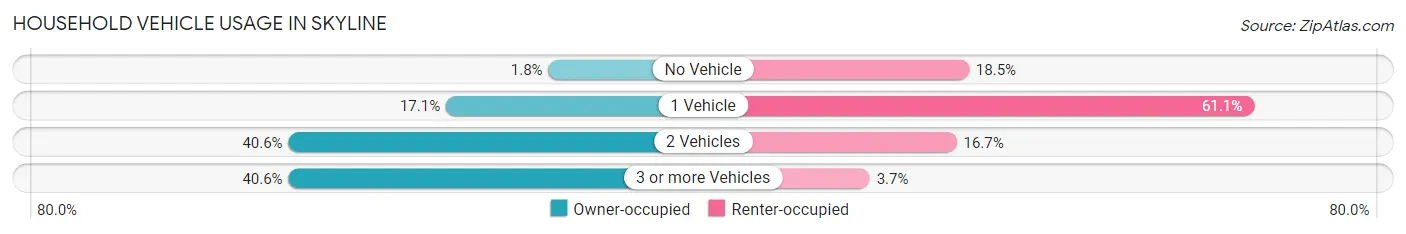
| Vehicles per Household | Owner-occupied | Renter-occupied |
| No Vehicle | 6 (1.8%) | 10 (18.5%) |
| 1 Vehicle | 58 (17.1%) | 33 (61.1%) |
| 2 Vehicles | 138 (40.6%) | 9 (16.7%) |
| 3 or more Vehicles | 138 (40.6%) | 2 (3.7%) |
| Total | 340 (100.0%) | 54 (100.0%) |
Real Estate & Mortgages in Skyline
Real Estate and Mortgage Overview in Skyline
| Characteristic | Without Mortgage | With Mortgage |
| Housing Units | 201 | 139 |
| Median Property Value | $101,800 | $96,100 |
| Median Household Income | $38,851 | $13 |
| Monthly Housing Costs | $307 | $0 |
| Real Estate Taxes | $263 | $61 |
Property Value by Mortgage Status in Skyline
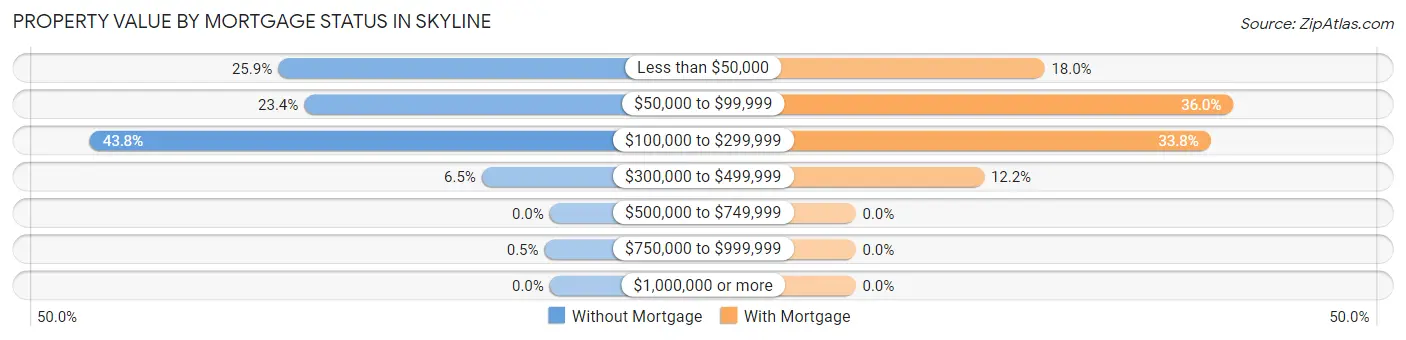
| Property Value | Without Mortgage | With Mortgage |
| Less than $50,000 | 52 (25.9%) | 25 (18.0%) |
| $50,000 to $99,999 | 47 (23.4%) | 50 (36.0%) |
| $100,000 to $299,999 | 88 (43.8%) | 47 (33.8%) |
| $300,000 to $499,999 | 13 (6.5%) | 17 (12.2%) |
| $500,000 to $749,999 | 0 (0.0%) | 0 (0.0%) |
| $750,000 to $999,999 | 1 (0.5%) | 0 (0.0%) |
| $1,000,000 or more | 0 (0.0%) | 0 (0.0%) |
| Total | 201 (100.0%) | 139 (100.0%) |
Household Income by Mortgage Status in Skyline
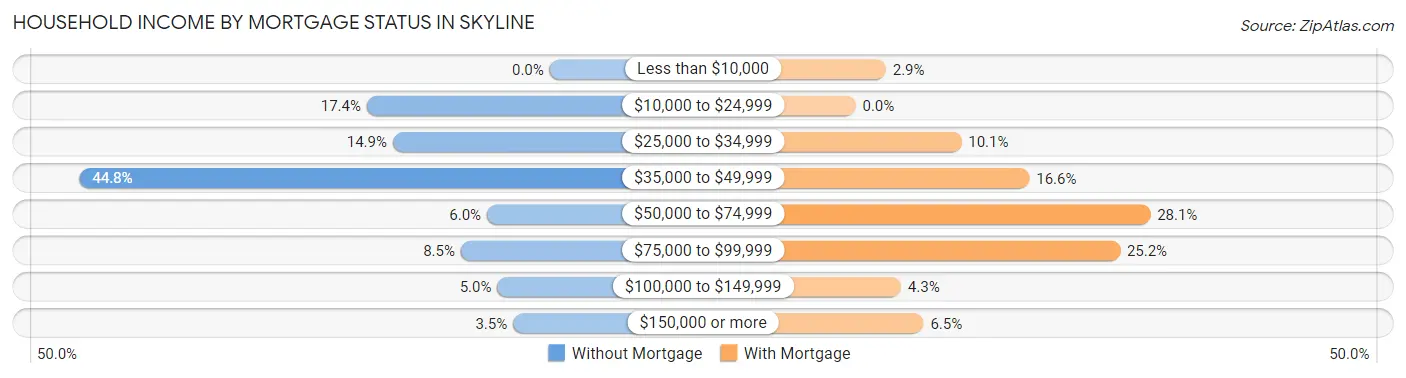
| Household Income | Without Mortgage | With Mortgage |
| Less than $10,000 | 0 (0.0%) | 4 (2.9%) |
| $10,000 to $24,999 | 35 (17.4%) | 0 (0.0%) |
| $25,000 to $34,999 | 30 (14.9%) | 14 (10.1%) |
| $35,000 to $49,999 | 90 (44.8%) | 23 (16.6%) |
| $50,000 to $74,999 | 12 (6.0%) | 39 (28.1%) |
| $75,000 to $99,999 | 17 (8.5%) | 35 (25.2%) |
| $100,000 to $149,999 | 10 (5.0%) | 6 (4.3%) |
| $150,000 or more | 7 (3.5%) | 9 (6.5%) |
| Total | 201 (100.0%) | 139 (100.0%) |
Property Value to Household Income Ratio in Skyline
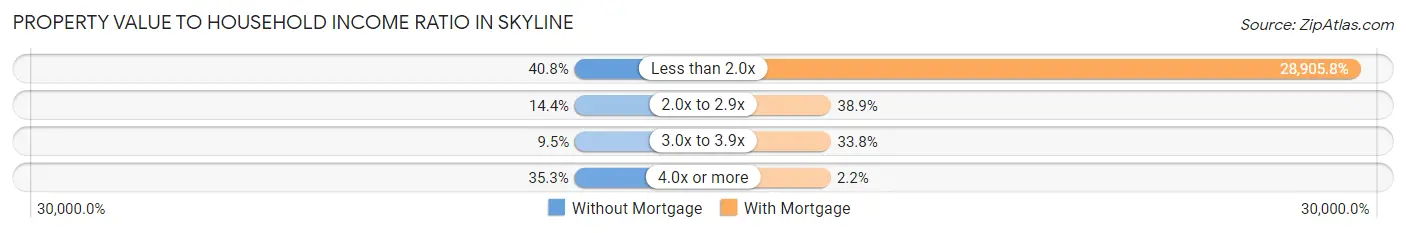
| Value-to-Income Ratio | Without Mortgage | With Mortgage |
| Less than 2.0x | 82 (40.8%) | 40,179 (28,905.8%) |
| 2.0x to 2.9x | 29 (14.4%) | 54 (38.9%) |
| 3.0x to 3.9x | 19 (9.5%) | 47 (33.8%) |
| 4.0x or more | 71 (35.3%) | 3 (2.2%) |
| Total | 201 (100.0%) | 139 (100.0%) |
Real Estate Taxes by Mortgage Status in Skyline
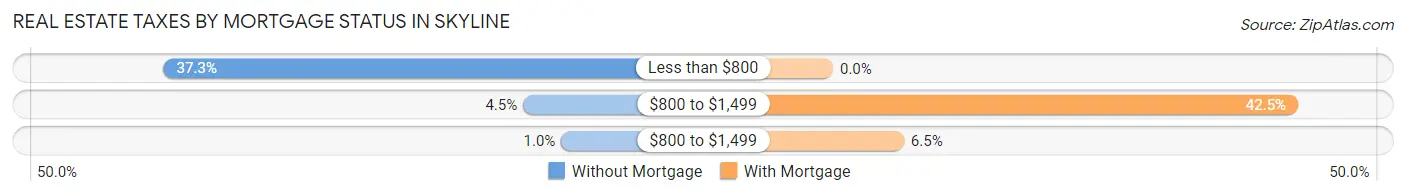
| Property Taxes | Without Mortgage | With Mortgage |
| Less than $800 | 75 (37.3%) | 0 (0.0%) |
| $800 to $1,499 | 9 (4.5%) | 59 (42.4%) |
| $800 to $1,499 | 2 (1.0%) | 9 (6.5%) |
| Total | 201 (100.0%) | 139 (100.0%) |
Health & Disability in Skyline
Health Insurance Coverage by Age in Skyline
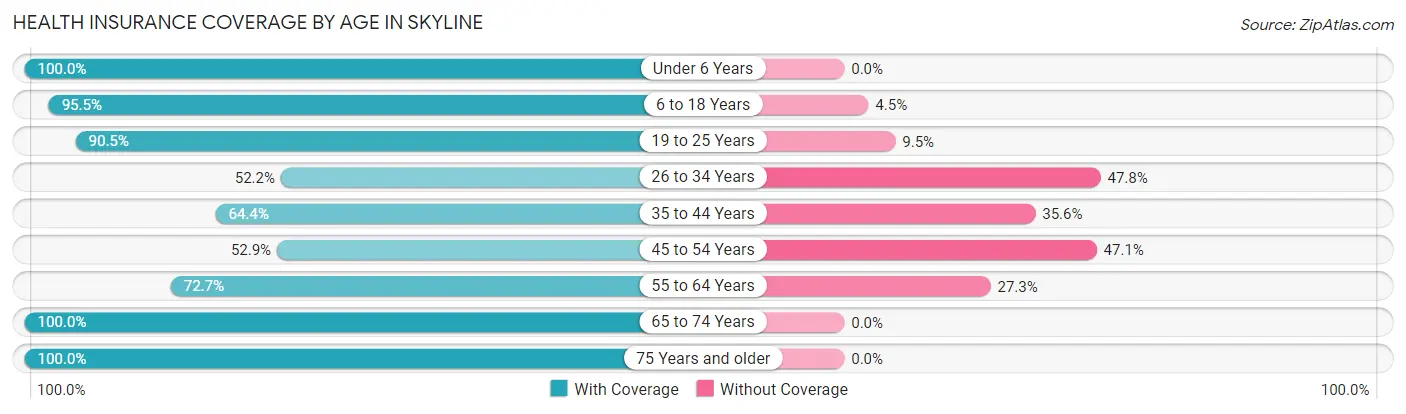
| Age Bracket | With Coverage | Without Coverage |
| Under 6 Years | 48 (100.0%) | 0 (0.0%) |
| 6 to 18 Years | 106 (95.5%) | 5 (4.5%) |
| 19 to 25 Years | 171 (90.5%) | 18 (9.5%) |
| 26 to 34 Years | 47 (52.2%) | 43 (47.8%) |
| 35 to 44 Years | 85 (64.4%) | 47 (35.6%) |
| 45 to 54 Years | 63 (52.9%) | 56 (47.1%) |
| 55 to 64 Years | 136 (72.7%) | 51 (27.3%) |
| 65 to 74 Years | 177 (100.0%) | 0 (0.0%) |
| 75 Years and older | 61 (100.0%) | 0 (0.0%) |
| Total | 894 (80.2%) | 220 (19.8%) |
Health Insurance Coverage by Citizenship Status in Skyline
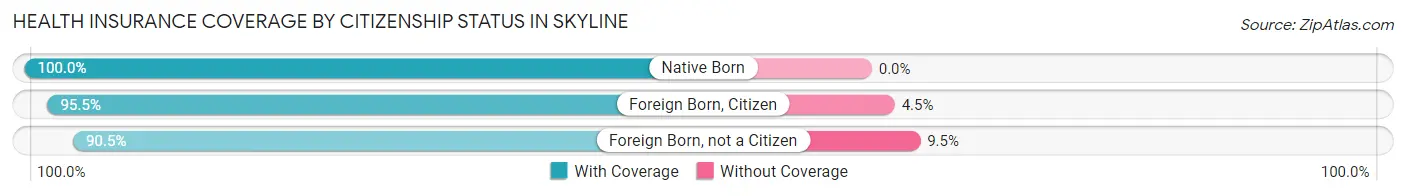
| Citizenship Status | With Coverage | Without Coverage |
| Native Born | 48 (100.0%) | 0 (0.0%) |
| Foreign Born, Citizen | 106 (95.5%) | 5 (4.5%) |
| Foreign Born, not a Citizen | 171 (90.5%) | 18 (9.5%) |
Health Insurance Coverage by Household Income in Skyline
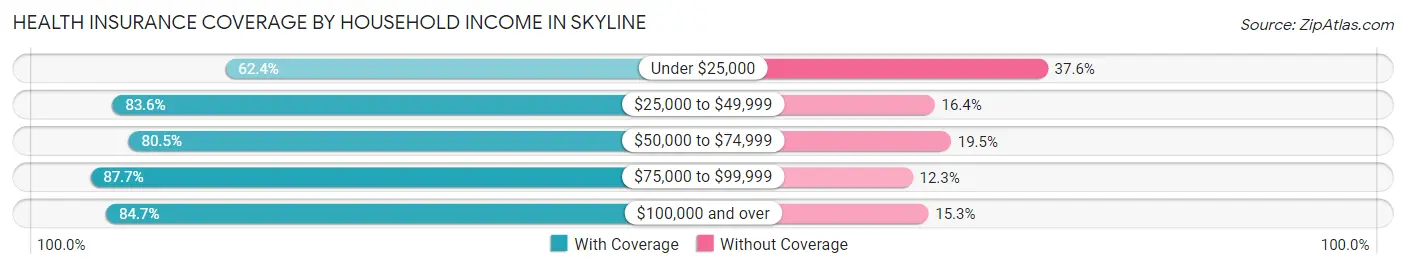
| Household Income | With Coverage | Without Coverage |
| Under $25,000 | 116 (62.4%) | 70 (37.6%) |
| $25,000 to $49,999 | 422 (83.6%) | 83 (16.4%) |
| $50,000 to $74,999 | 124 (80.5%) | 30 (19.5%) |
| $75,000 to $99,999 | 121 (87.7%) | 17 (12.3%) |
| $100,000 and over | 111 (84.7%) | 20 (15.3%) |
Public vs Private Health Insurance Coverage by Age in Skyline
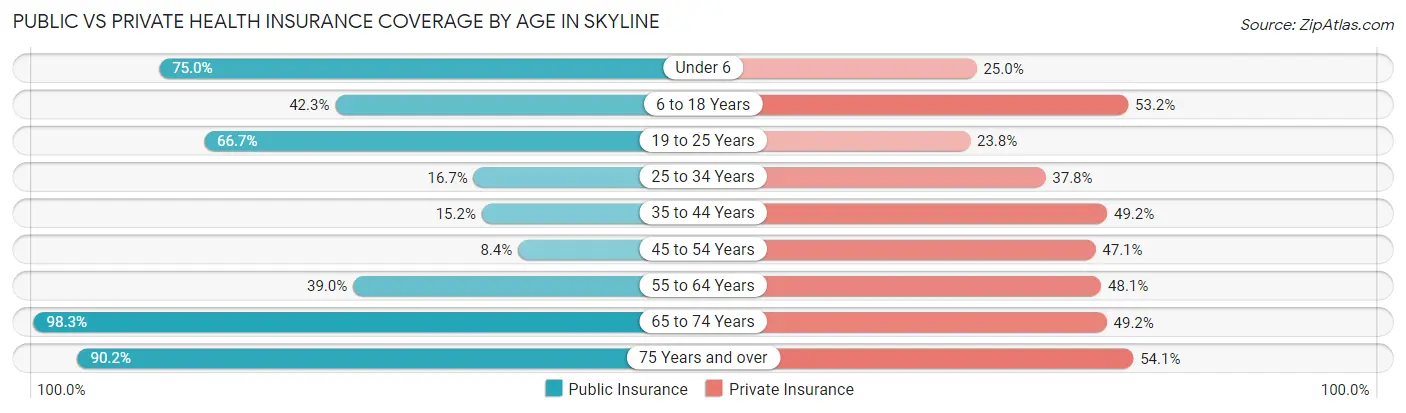
| Age Bracket | Public Insurance | Private Insurance |
| Under 6 | 36 (75.0%) | 12 (25.0%) |
| 6 to 18 Years | 47 (42.3%) | 59 (53.1%) |
| 19 to 25 Years | 126 (66.7%) | 45 (23.8%) |
| 25 to 34 Years | 15 (16.7%) | 34 (37.8%) |
| 35 to 44 Years | 20 (15.1%) | 65 (49.2%) |
| 45 to 54 Years | 10 (8.4%) | 56 (47.1%) |
| 55 to 64 Years | 73 (39.0%) | 90 (48.1%) |
| 65 to 74 Years | 174 (98.3%) | 87 (49.1%) |
| 75 Years and over | 55 (90.2%) | 33 (54.1%) |
| Total | 556 (49.9%) | 481 (43.2%) |
Disability Status by Sex by Age in Skyline
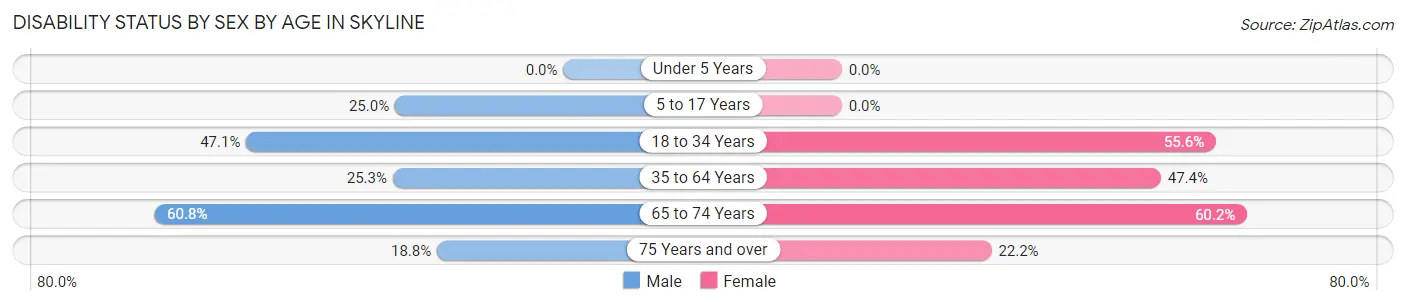
| Age Bracket | Male | Female |
| Under 5 Years | 0 (0.0%) | 0 (0.0%) |
| 5 to 17 Years | 13 (25.0%) | 0 (0.0%) |
| 18 to 34 Years | 81 (47.1%) | 70 (55.6%) |
| 35 to 64 Years | 58 (25.3%) | 99 (47.4%) |
| 65 to 74 Years | 48 (60.8%) | 59 (60.2%) |
| 75 Years and over | 3 (18.8%) | 10 (22.2%) |
Disability Class by Sex by Age in Skyline
Disability Class: Hearing Difficulty
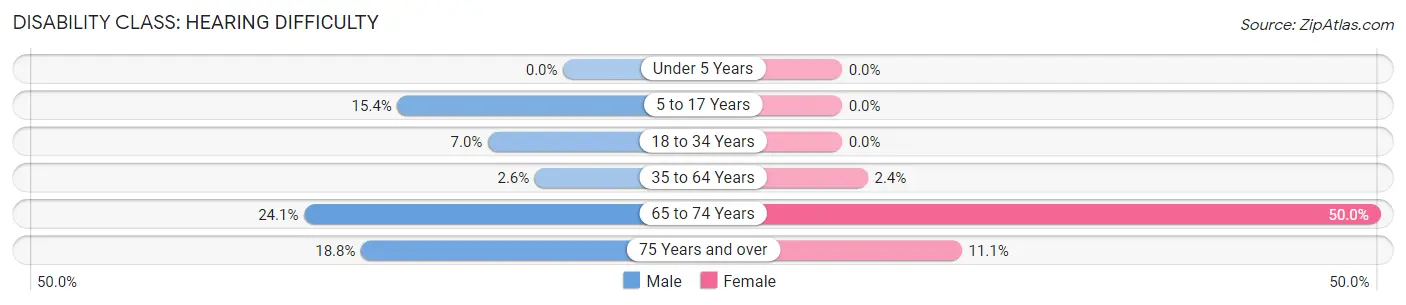
| Age Bracket | Male | Female |
| Under 5 Years | 0 (0.0%) | 0 (0.0%) |
| 5 to 17 Years | 8 (15.4%) | 0 (0.0%) |
| 18 to 34 Years | 12 (7.0%) | 0 (0.0%) |
| 35 to 64 Years | 6 (2.6%) | 5 (2.4%) |
| 65 to 74 Years | 19 (24.0%) | 49 (50.0%) |
| 75 Years and over | 3 (18.8%) | 5 (11.1%) |
Disability Class: Vision Difficulty
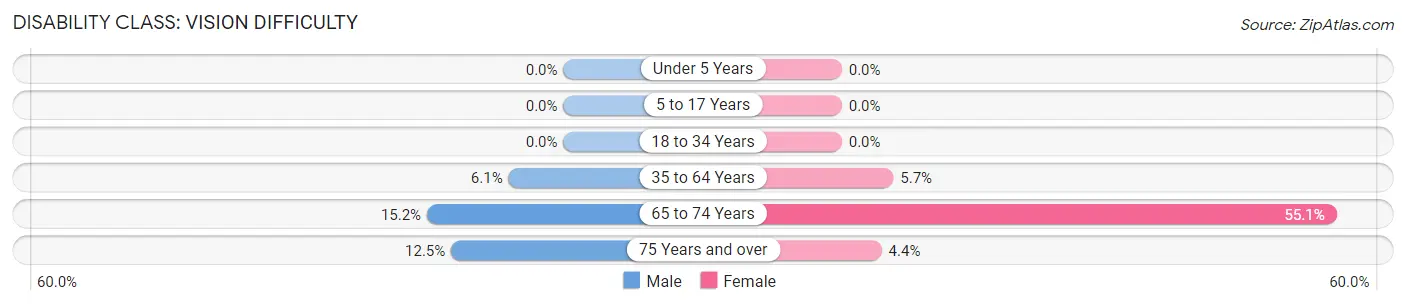
| Age Bracket | Male | Female |
| Under 5 Years | 0 (0.0%) | 0 (0.0%) |
| 5 to 17 Years | 0 (0.0%) | 0 (0.0%) |
| 18 to 34 Years | 0 (0.0%) | 0 (0.0%) |
| 35 to 64 Years | 14 (6.1%) | 12 (5.7%) |
| 65 to 74 Years | 12 (15.2%) | 54 (55.1%) |
| 75 Years and over | 2 (12.5%) | 2 (4.4%) |
Disability Class: Cognitive Difficulty
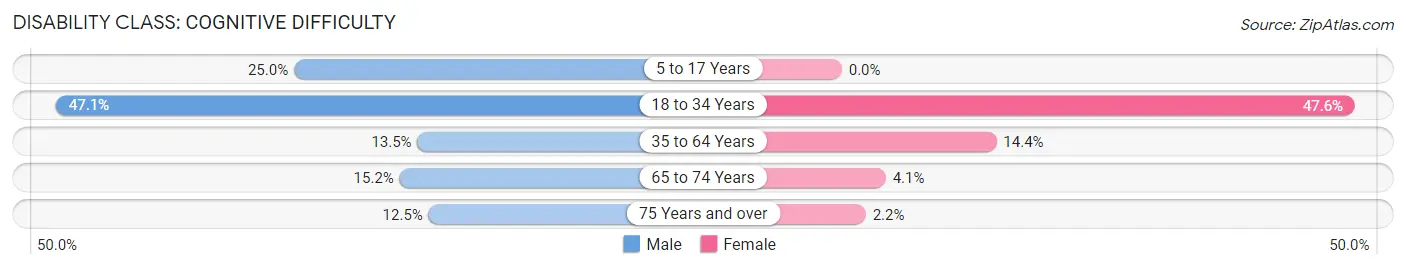
| Age Bracket | Male | Female |
| 5 to 17 Years | 13 (25.0%) | 0 (0.0%) |
| 18 to 34 Years | 81 (47.1%) | 60 (47.6%) |
| 35 to 64 Years | 31 (13.5%) | 30 (14.3%) |
| 65 to 74 Years | 12 (15.2%) | 4 (4.1%) |
| 75 Years and over | 2 (12.5%) | 1 (2.2%) |
Disability Class: Ambulatory Difficulty
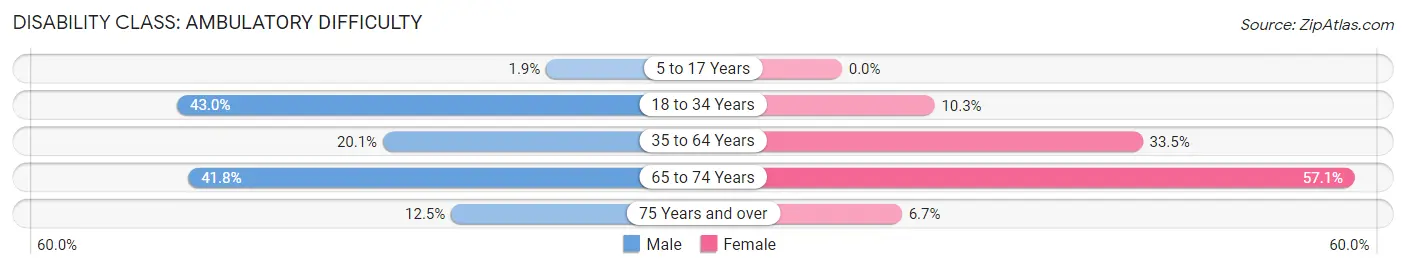
| Age Bracket | Male | Female |
| 5 to 17 Years | 1 (1.9%) | 0 (0.0%) |
| 18 to 34 Years | 74 (43.0%) | 13 (10.3%) |
| 35 to 64 Years | 46 (20.1%) | 70 (33.5%) |
| 65 to 74 Years | 33 (41.8%) | 56 (57.1%) |
| 75 Years and over | 2 (12.5%) | 3 (6.7%) |
Disability Class: Self-Care Difficulty
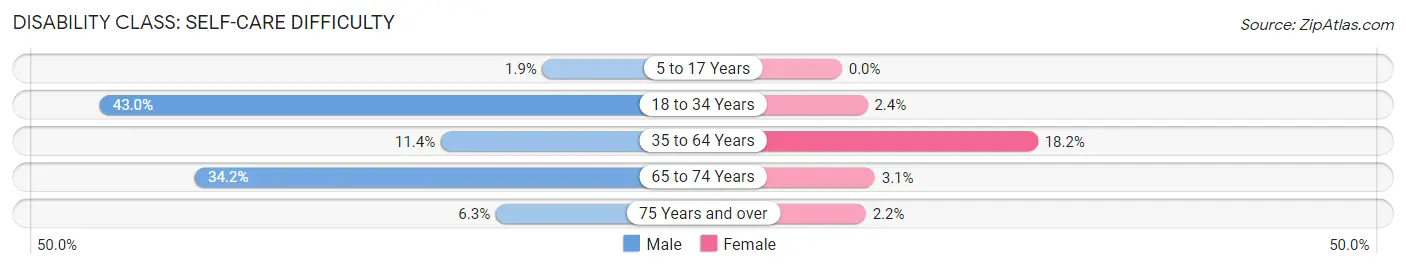
| Age Bracket | Male | Female |
| 5 to 17 Years | 1 (1.9%) | 0 (0.0%) |
| 18 to 34 Years | 74 (43.0%) | 3 (2.4%) |
| 35 to 64 Years | 26 (11.4%) | 38 (18.2%) |
| 65 to 74 Years | 27 (34.2%) | 3 (3.1%) |
| 75 Years and over | 1 (6.2%) | 1 (2.2%) |
Technology Access in Skyline
Computing Device Access in Skyline
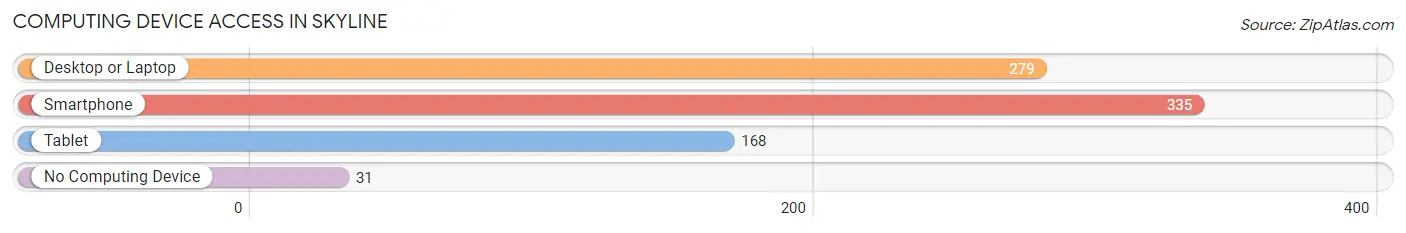
| Device Type | # Households | % Households |
| Desktop or Laptop | 279 | 70.8% |
| Smartphone | 335 | 85.0% |
| Tablet | 168 | 42.6% |
| No Computing Device | 31 | 7.9% |
| Total | 394 | 100.0% |
Internet Access in Skyline
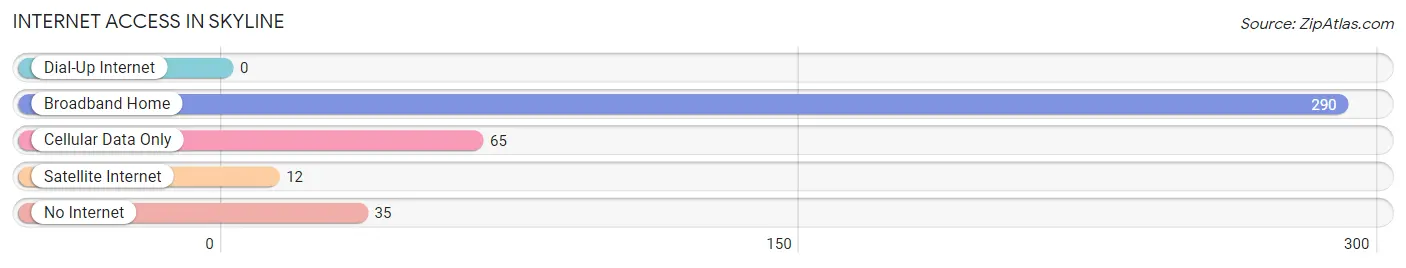
| Internet Type | # Households | % Households |
| Dial-Up Internet | 0 | 0.0% |
| Broadband Home | 290 | 73.6% |
| Cellular Data Only | 65 | 16.5% |
| Satellite Internet | 12 | 3.0% |
| No Internet | 35 | 8.9% |
| Total | 394 | 100.0% |
Skyline Summary
Skyline is a small town located in Jackson County, Alabama. It is situated in the foothills of the Appalachian Mountains and is part of the larger metropolitan area of Huntsville-Decatur-Albertville. The town has a population of approximately 1,000 people and is known for its rural charm and small-town atmosphere.
Geography
Skyline is located in the foothills of the Appalachian Mountains in Jackson County, Alabama. The town is situated at the intersection of US Highway 431 and Alabama State Route 65. The town is surrounded by rolling hills and lush forests, making it a popular destination for outdoor activities such as hiking, camping, and fishing. The town is also located near the Tennessee River, which provides a variety of recreational opportunities.
Economy
Skyline’s economy is largely based on agriculture and forestry. The town is home to several farms and timber companies, which provide employment for many of the town’s residents. The town also has a small manufacturing sector, which produces a variety of products such as furniture, clothing, and textiles. Additionally, the town is home to several small businesses, including restaurants, convenience stores, and gas stations.
Demographics
As of the 2010 census, Skyline had a population of 1,000 people. The town is predominantly white, with approximately 95% of the population identifying as Caucasian. The remaining 5% of the population is made up of African Americans, Hispanics, and other ethnicities. The median household income in Skyline is $35,000, and the median age is 37.
History
Skyline was founded in 1887 by a group of settlers from Tennessee. The town was originally known as “Skyline Station” due to its location on the railroad line. The town was officially incorporated in 1901 and was named after the nearby mountain range. In the early 1900s, the town was a popular destination for tourists, who came to enjoy the scenic views and outdoor activities.
Skyline has a long and rich history. The town was the site of a Civil War battle in 1863, and the town’s cemetery is the final resting place of many Confederate soldiers. The town was also the birthplace of the famous country singer, Hank Williams, who was born in 1923.
Skyline is a small town with a big heart. The town is known for its friendly atmosphere and welcoming attitude towards visitors. The town is also home to a variety of outdoor activities, making it a popular destination for tourists and locals alike. Skyline is a great place to live, work, and play.
Common Questions
What is the Total Population of Skyline?
Total Population of Skyline is 1,114.
What is the Total Male Population of Skyline?
Total Male Population of Skyline is 566.
What is the Total Female Population of Skyline?
Total Female Population of Skyline is 548.
What is the Ratio of Males per 100 Females in Skyline?
There are 103.28 Males per 100 Females in Skyline.
What is the Ratio of Females per 100 Males in Skyline?
There are 96.82 Females per 100 Males in Skyline.
What is the Median Population Age in Skyline?
Median Population Age in Skyline is 44.2 Years.
What is the Average Family Size in Skyline
Average Family Size in Skyline is 3.2 People.
What is the Average Household Size in Skyline
Average Household Size in Skyline is 2.8 People.
What is Per Capita Income in Skyline?
Per Capita income in Skyline is $19,190.
What is the Median Family Income in Skyline?
Median Family Income in Skyline is $38,736.
What is the Median Household income in Skyline?
Median Household Income in Skyline is $38,537.
What is Income or Wage Gap in Skyline?
Income or Wage Gap in Skyline is 40.0%.
Women in Skyline earn 60.0 cents for every dollar earned by a man.
What is Inequality or Gini Index in Skyline?
Inequality or Gini Index in Skyline is 0.42.
How Large is the Labor Force in Skyline?
There are 355 People in the Labor Forcein in Skyline.
What is the Percentage of People in the Labor Force in Skyline?
35.6% of People are in the Labor Force in Skyline.
What is the Unemployment Rate in Skyline?
Unemployment Rate in Skyline is 4.5%.