Foley, AL Map & Demographics
Foley Map
Foley Overview
$33,427
PER CAPITA INCOME
$76,073
AVG FAMILY INCOME
$60,090
AVG HOUSEHOLD INCOME
25.5%
WAGE / INCOME GAP [ % ]
74.5¢/ $1
WAGE / INCOME GAP [ $ ]
0.42
INEQUALITY / GINI INDEX
21,113
TOTAL POPULATION
9,715
MALE POPULATION
11,398
FEMALE POPULATION
85.23
MALES / 100 FEMALES
117.32
FEMALES / 100 MALES
52.1
MEDIAN AGE
2.8
AVG FAMILY SIZE
2.1
AVG HOUSEHOLD SIZE
8,869
LABOR FORCE [ PEOPLE ]
48.3%
PERCENT IN LABOR FORCE
4.9%
UNEMPLOYMENT RATE
Foley Zip Codes
Foley Area Codes
Income in Foley
Income Overview in Foley
Per Capita Income in Foley is $33,427, while median incomes of families and households are $76,073 and $60,090 respectively.
| Characteristic | Number | Measure |
| Per Capita Income | 21,113 | $33,427 |
| Median Family Income | 5,592 | $76,073 |
| Mean Family Income | 5,592 | $91,061 |
| Median Household Income | 9,713 | $60,090 |
| Mean Household Income | 9,713 | $71,674 |
| Income Deficit | 5,592 | $0 |
| Wage / Income Gap (%) | 21,113 | 25.52% |
| Wage / Income Gap ($) | 21,113 | 74.48¢ per $1 |
| Gini / Inequality Index | 21,113 | 0.42 |
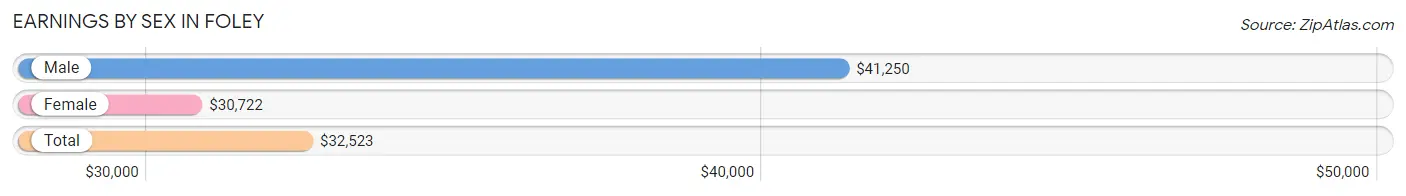
Earnings by Sex in Foley
Average Earnings in Foley are $32,523, $41,250 for men and $30,722 for women, a difference of 25.5%.
| Sex | Number | Average Earnings |
| Male | 4,555 (50.1%) | $41,250 |
| Female | 4,539 (49.9%) | $30,722 |
| Total | 9,094 (100.0%) | $32,523 |
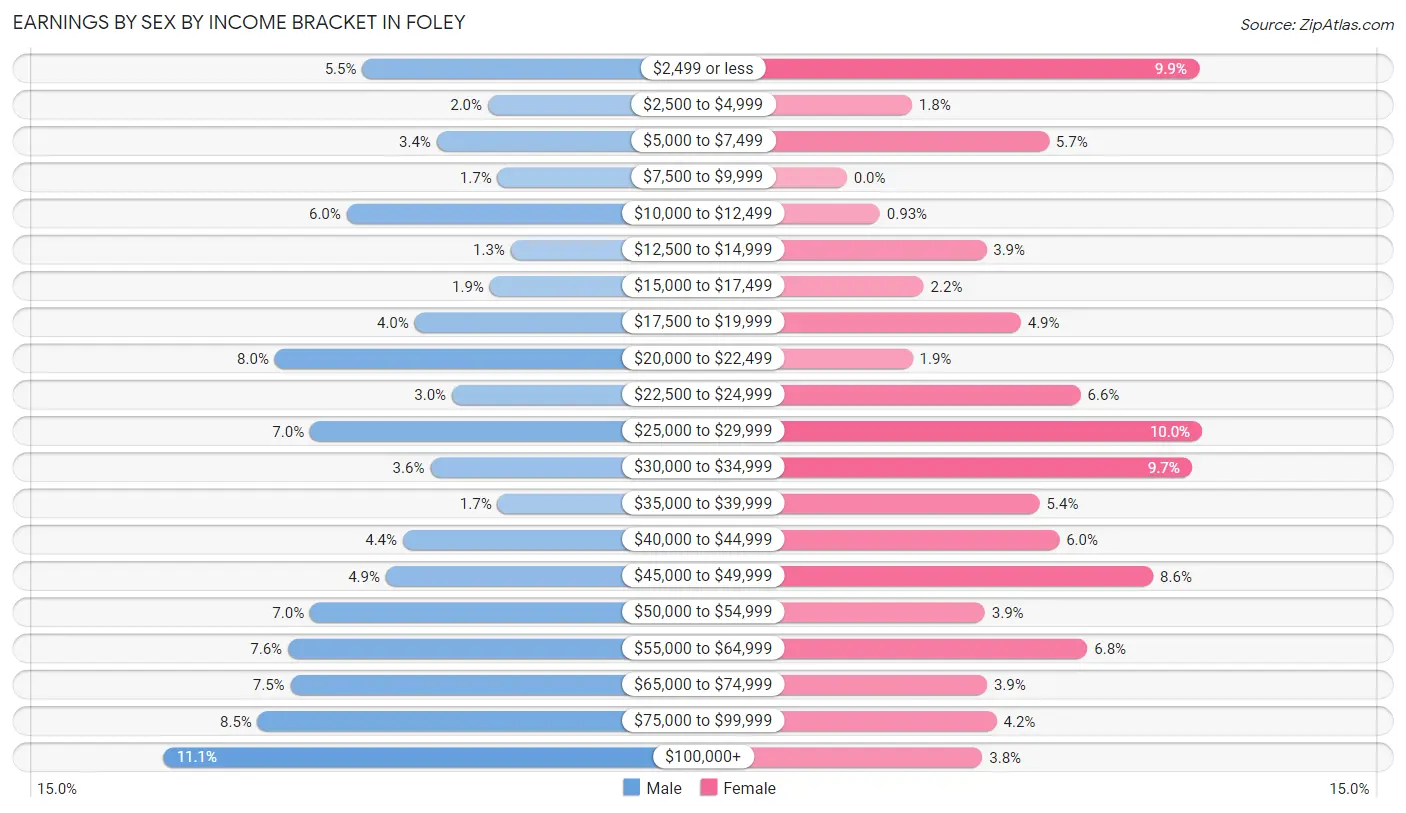
Earnings by Sex by Income Bracket in Foley
The most common earnings brackets in Foley are $100,000+ for men (505 | 11.1%) and $25,000 to $29,999 for women (453 | 10.0%).
| Income | Male | Female |
| $2,499 or less | 251 (5.5%) | 449 (9.9%) |
| $2,500 to $4,999 | 90 (2.0%) | 83 (1.8%) |
| $5,000 to $7,499 | 156 (3.4%) | 258 (5.7%) |
| $7,500 to $9,999 | 78 (1.7%) | 0 (0.0%) |
| $10,000 to $12,499 | 271 (5.9%) | 42 (0.9%) |
| $12,500 to $14,999 | 61 (1.3%) | 178 (3.9%) |
| $15,000 to $17,499 | 88 (1.9%) | 98 (2.2%) |
| $17,500 to $19,999 | 184 (4.0%) | 222 (4.9%) |
| $20,000 to $22,499 | 363 (8.0%) | 84 (1.8%) |
| $22,500 to $24,999 | 136 (3.0%) | 298 (6.6%) |
| $25,000 to $29,999 | 318 (7.0%) | 453 (10.0%) |
| $30,000 to $34,999 | 164 (3.6%) | 440 (9.7%) |
| $35,000 to $39,999 | 78 (1.7%) | 246 (5.4%) |
| $40,000 to $44,999 | 199 (4.4%) | 271 (6.0%) |
| $45,000 to $49,999 | 221 (4.9%) | 391 (8.6%) |
| $50,000 to $54,999 | 318 (7.0%) | 176 (3.9%) |
| $55,000 to $64,999 | 346 (7.6%) | 307 (6.8%) |
| $65,000 to $74,999 | 343 (7.5%) | 179 (3.9%) |
| $75,000 to $99,999 | 385 (8.5%) | 191 (4.2%) |
| $100,000+ | 505 (11.1%) | 173 (3.8%) |
| Total | 4,555 (100.0%) | 4,539 (100.0%) |
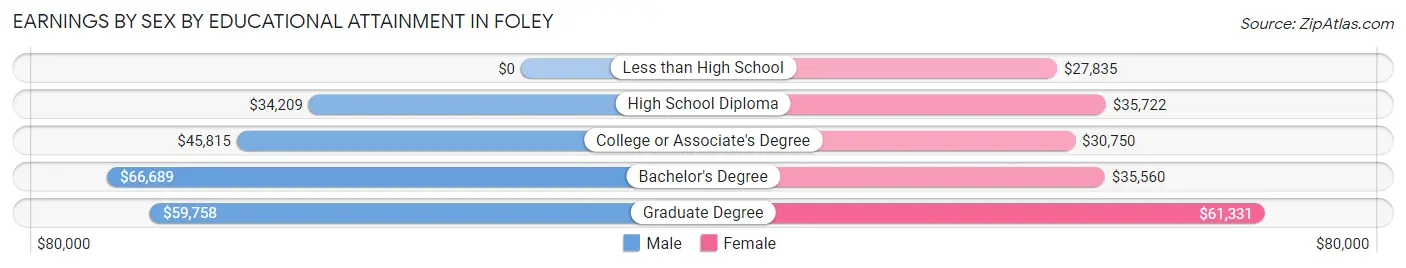
Earnings by Sex by Educational Attainment in Foley
Average earnings in Foley are $46,013 for men and $32,411 for women, a difference of 29.6%. Men with an educational attainment of bachelor's degree enjoy the highest average annual earnings of $66,689, while those with high school diploma education earn the least with $34,209. Women with an educational attainment of graduate degree earn the most with the average annual earnings of $61,331, while those with less than high school education have the smallest earnings of $27,835.
| Educational Attainment | Male Income | Female Income |
| Less than High School | - | - |
| High School Diploma | $34,209 | $35,722 |
| College or Associate's Degree | $45,815 | $30,750 |
| Bachelor's Degree | $66,689 | $35,560 |
| Graduate Degree | $59,758 | $61,331 |
| Total | $46,013 | $32,411 |
Family Income in Foley
Family Income Brackets in Foley
According to the Foley family income data, there are 1,353 families falling into the $50,000 to $74,999 income range, which is the most common income bracket and makes up 24.2% of all families. Conversely, the $10,000 to $14,999 income bracket is the least frequent group with only 95 families (1.7%) belonging to this category.
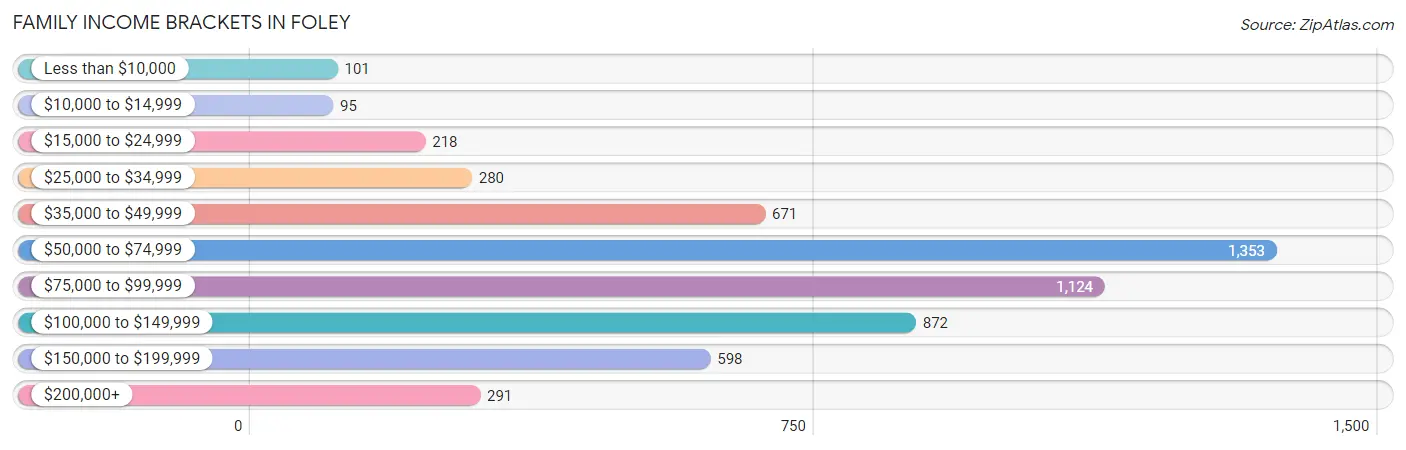
| Income Bracket | # Families | % Families |
| Less than $10,000 | 101 | 1.8% |
| $10,000 to $14,999 | 95 | 1.7% |
| $15,000 to $24,999 | 218 | 3.9% |
| $25,000 to $34,999 | 280 | 5.0% |
| $35,000 to $49,999 | 671 | 12.0% |
| $50,000 to $74,999 | 1,353 | 24.2% |
| $75,000 to $99,999 | 1,124 | 20.1% |
| $100,000 to $149,999 | 872 | 15.6% |
| $150,000 to $199,999 | 598 | 10.7% |
| $200,000+ | 291 | 5.2% |
Family Income by Famaliy Size in Foley
5-person families (211 | 3.8%) account for the highest median family income in Foley with $143,287 per family, while 2-person families (3,769 | 67.4%) have the highest median income of $37,520 per family member.
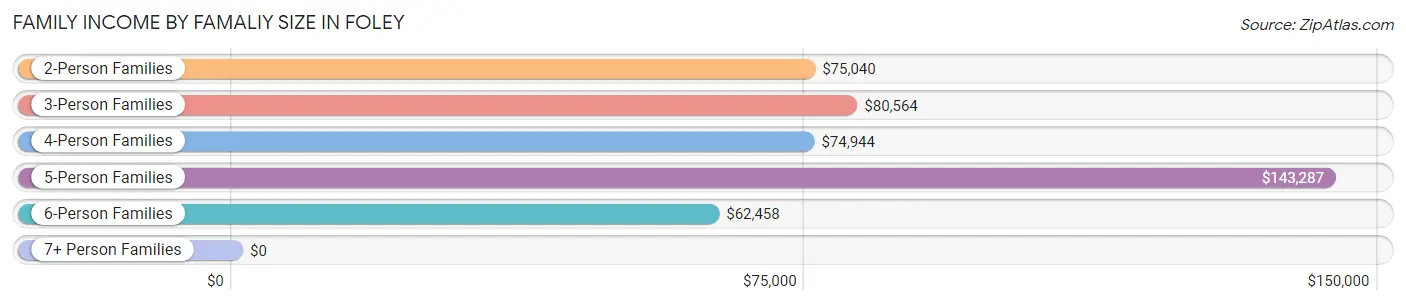
| Income Bracket | # Families | Median Income |
| 2-Person Families | 3,769 (67.4%) | $75,040 |
| 3-Person Families | 779 (13.9%) | $80,564 |
| 4-Person Families | 626 (11.2%) | $74,944 |
| 5-Person Families | 211 (3.8%) | $143,287 |
| 6-Person Families | 177 (3.2%) | $62,458 |
| 7+ Person Families | 30 (0.5%) | $0 |
| Total | 5,592 (100.0%) | $76,073 |
Family Income by Number of Earners in Foley
The median family income in Foley is $76,073, with families comprising 3+ earners (488) having the highest median family income of $97,273, while families with no earners (2,012) have the lowest median family income of $60,833, accounting for 8.7% and 36.0% of families, respectively.
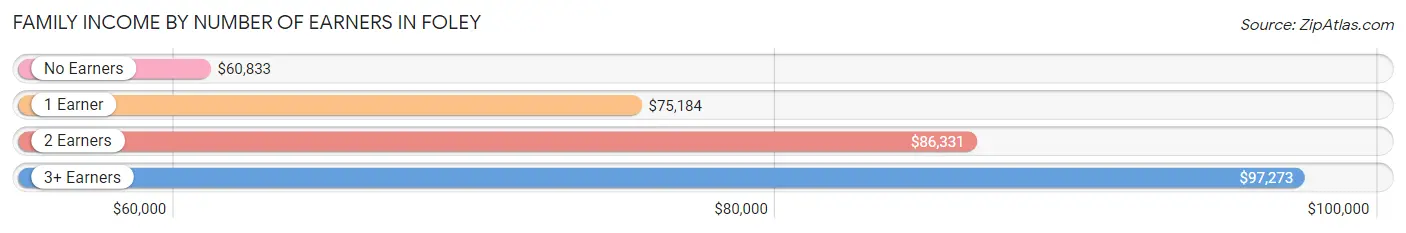
| Number of Earners | # Families | Median Income |
| No Earners | 2,012 (36.0%) | $60,833 |
| 1 Earner | 1,537 (27.5%) | $75,184 |
| 2 Earners | 1,555 (27.8%) | $86,331 |
| 3+ Earners | 488 (8.7%) | $97,273 |
| Total | 5,592 (100.0%) | $76,073 |
Household Income in Foley
Household Income Brackets in Foley
With 2,020 households falling in the category, the $50,000 to $74,999 income range is the most frequent in Foley, accounting for 20.8% of all households. In contrast, only 330 households (3.4%) fall into the $200,000+ income bracket, making it the least populous group.
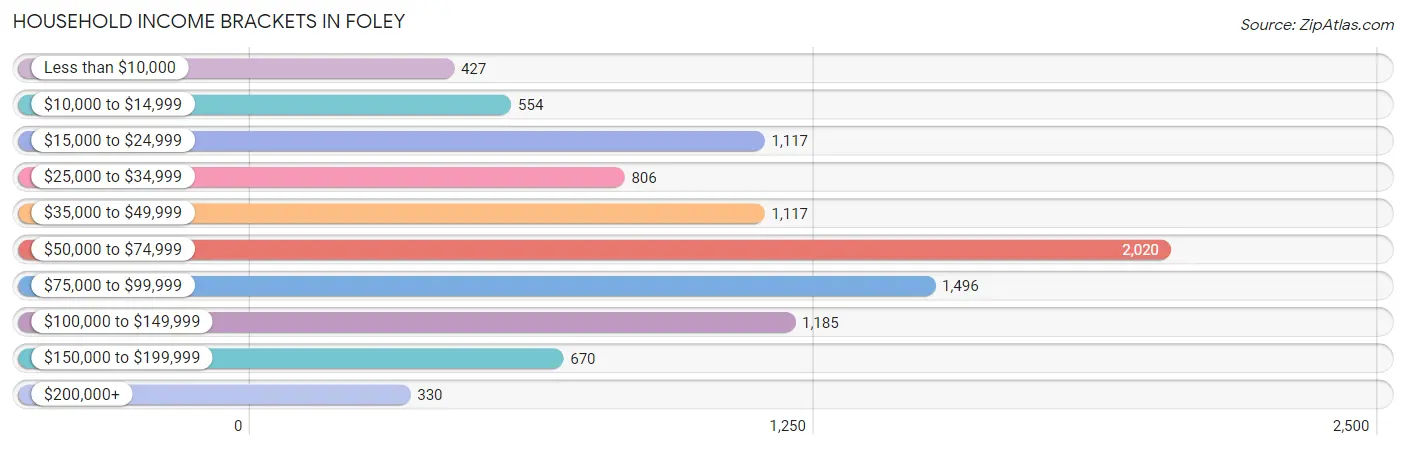
| Income Bracket | # Households | % Households |
| Less than $10,000 | 427 | 4.4% |
| $10,000 to $14,999 | 554 | 5.7% |
| $15,000 to $24,999 | 1,117 | 11.5% |
| $25,000 to $34,999 | 806 | 8.3% |
| $35,000 to $49,999 | 1,117 | 11.5% |
| $50,000 to $74,999 | 2,020 | 20.8% |
| $75,000 to $99,999 | 1,496 | 15.4% |
| $100,000 to $149,999 | 1,185 | 12.2% |
| $150,000 to $199,999 | 670 | 6.9% |
| $200,000+ | 330 | 3.4% |
Household Income by Householder Age in Foley
The median household income in Foley is $60,090, with the highest median household income of $71,920 found in the 45 to 64 years age bracket for the primary householder. A total of 3,245 households (33.4%) fall into this category. Meanwhile, the 15 to 24 years age bracket for the primary householder has the lowest median household income of $22,624, with 402 households (4.1%) in this group.
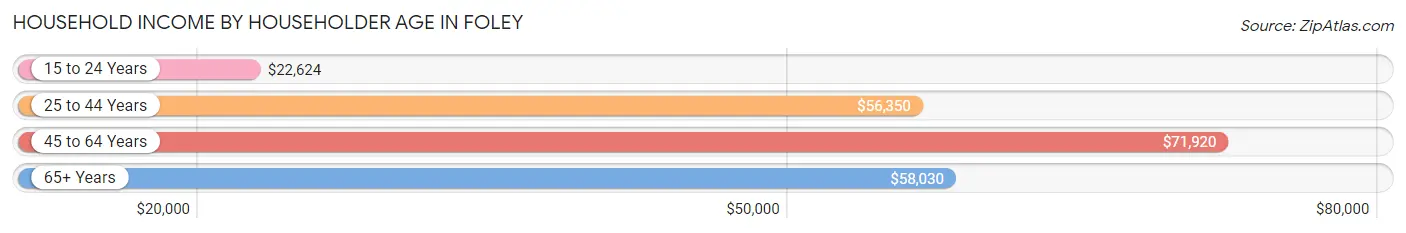
| Income Bracket | # Households | Median Income |
| 15 to 24 Years | 402 (4.1%) | $22,624 |
| 25 to 44 Years | 2,187 (22.5%) | $56,350 |
| 45 to 64 Years | 3,245 (33.4%) | $71,920 |
| 65+ Years | 3,879 (39.9%) | $58,030 |
| Total | 9,713 (100.0%) | $60,090 |
Poverty in Foley
Income Below Poverty by Sex and Age in Foley
With 8.8% poverty level for males and 12.4% for females among the residents of Foley, 5 year old males and 18 to 24 year old females are the most vulnerable to poverty, with 148 males (35.8%) and 195 females (48.6%) in their respective age groups living below the poverty level.
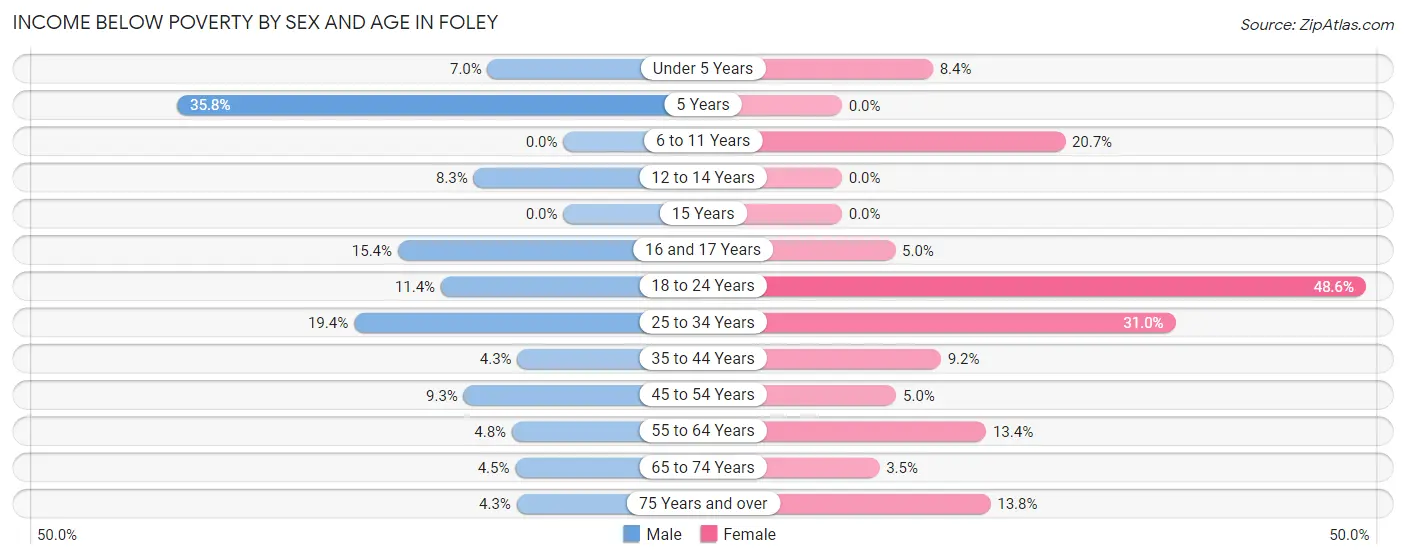
| Age Bracket | Male | Female |
| Under 5 Years | 22 (7.0%) | 20 (8.4%) |
| 5 Years | 148 (35.8%) | 0 (0.0%) |
| 6 to 11 Years | 0 (0.0%) | 76 (20.7%) |
| 12 to 14 Years | 25 (8.3%) | 0 (0.0%) |
| 15 Years | 0 (0.0%) | 0 (0.0%) |
| 16 and 17 Years | 41 (15.4%) | 16 (5.0%) |
| 18 to 24 Years | 81 (11.4%) | 195 (48.6%) |
| 25 to 34 Years | 199 (19.4%) | 392 (31.0%) |
| 35 to 44 Years | 41 (4.3%) | 98 (9.2%) |
| 45 to 54 Years | 97 (9.2%) | 76 (5.0%) |
| 55 to 64 Years | 59 (4.8%) | 239 (13.4%) |
| 65 to 74 Years | 65 (4.5%) | 70 (3.5%) |
| 75 Years and over | 63 (4.3%) | 220 (13.8%) |
| Total | 841 (8.8%) | 1,402 (12.4%) |
Income Above Poverty by Sex and Age in Foley
According to the poverty statistics in Foley, males aged 6 to 11 years and females aged 12 to 14 years are the age groups that are most secure financially, with 100.0% of males and 100.0% of females in these age groups living above the poverty line.
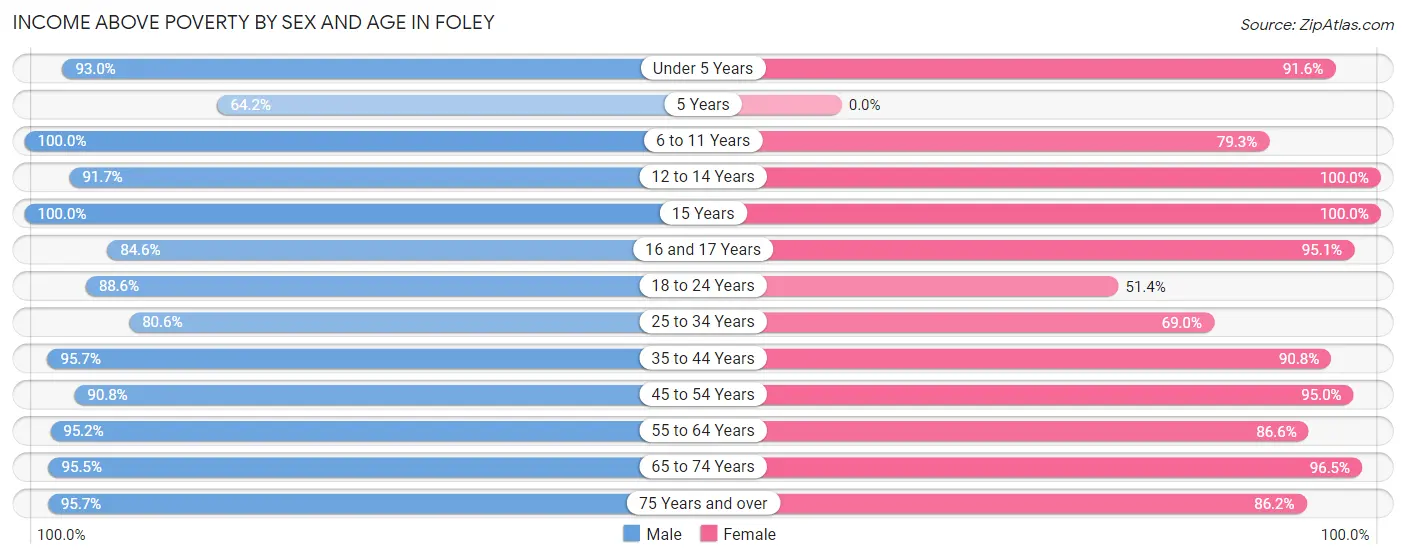
| Age Bracket | Male | Female |
| Under 5 Years | 291 (93.0%) | 217 (91.6%) |
| 5 Years | 265 (64.2%) | 0 (0.0%) |
| 6 to 11 Years | 220 (100.0%) | 291 (79.3%) |
| 12 to 14 Years | 275 (91.7%) | 487 (100.0%) |
| 15 Years | 156 (100.0%) | 258 (100.0%) |
| 16 and 17 Years | 226 (84.6%) | 307 (95.1%) |
| 18 to 24 Years | 632 (88.6%) | 206 (51.4%) |
| 25 to 34 Years | 825 (80.6%) | 874 (69.0%) |
| 35 to 44 Years | 921 (95.7%) | 969 (90.8%) |
| 45 to 54 Years | 952 (90.7%) | 1,431 (95.0%) |
| 55 to 64 Years | 1,177 (95.2%) | 1,547 (86.6%) |
| 65 to 74 Years | 1,394 (95.5%) | 1,946 (96.5%) |
| 75 Years and over | 1,393 (95.7%) | 1,376 (86.2%) |
| Total | 8,727 (91.2%) | 9,909 (87.6%) |
Income Below Poverty Among Married-Couple Families in Foley
The poverty statistics for married-couple families in Foley show that 4.2% or 201 of the total 4,742 families live below the poverty line. Families with 1 or 2 children have the highest poverty rate of 15.1%, comprising of 142 families. On the other hand, families with 3 or 4 children have the lowest poverty rate of 0.0%, which includes 0 families.
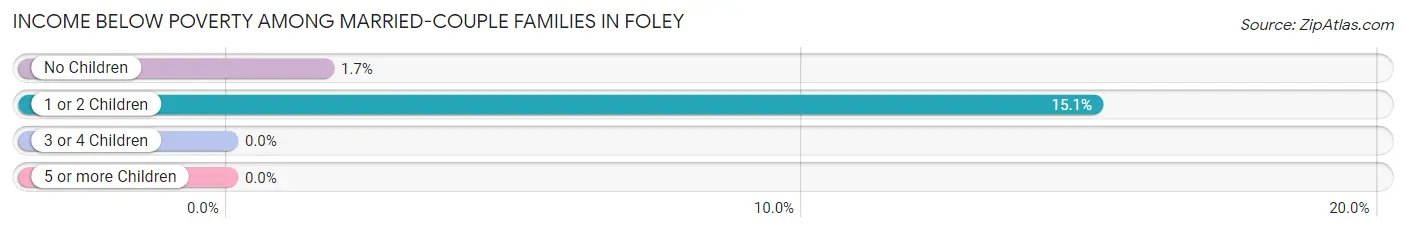
| Children | Above Poverty | Below Poverty |
| No Children | 3,475 (98.3%) | 59 (1.7%) |
| 1 or 2 Children | 800 (84.9%) | 142 (15.1%) |
| 3 or 4 Children | 266 (100.0%) | 0 (0.0%) |
| 5 or more Children | 0 (0.0%) | 0 (0.0%) |
| Total | 4,541 (95.8%) | 201 (4.2%) |
Income Below Poverty Among Single-Parent Households in Foley
According to the poverty data in Foley, 16.0% or 30 single-father households and 17.4% or 115 single-mother households are living below the poverty line. Among single-father households, those with 1 or 2 children have the highest poverty rate, with 30 households (39.5%) experiencing poverty. Likewise, among single-mother households, those with no children have the highest poverty rate, with 86 households (26.9%) falling below the poverty line.
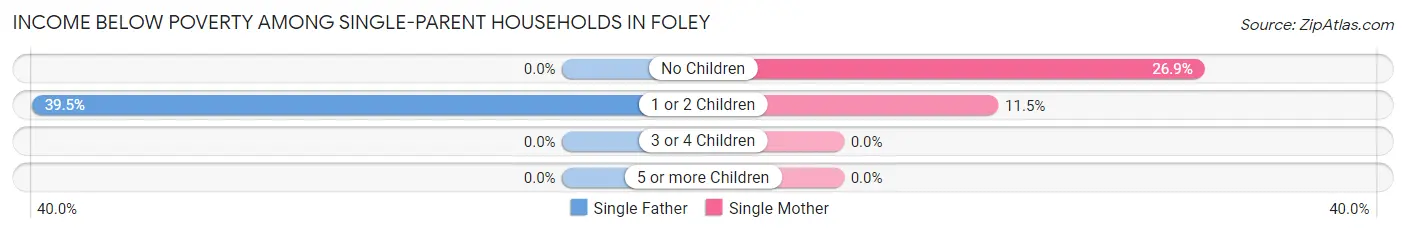
| Children | Single Father | Single Mother |
| No Children | 0 (0.0%) | 86 (26.9%) |
| 1 or 2 Children | 30 (39.5%) | 29 (11.5%) |
| 3 or 4 Children | 0 (0.0%) | 0 (0.0%) |
| 5 or more Children | 0 (0.0%) | 0 (0.0%) |
| Total | 30 (16.0%) | 115 (17.4%) |
Income Below Poverty Among Married-Couple vs Single-Parent Households in Foley
The poverty data for Foley shows that 201 of the married-couple family households (4.2%) and 145 of the single-parent households (17.1%) are living below the poverty level. Within the married-couple family households, those with 1 or 2 children have the highest poverty rate, with 142 households (15.1%) falling below the poverty line. Among the single-parent households, those with no children have the highest poverty rate, with 86 household (19.9%) living below poverty.
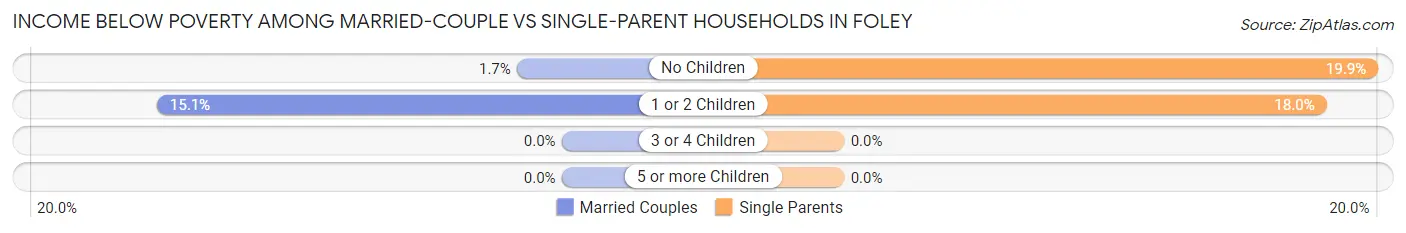
| Children | Married-Couple Families | Single-Parent Households |
| No Children | 59 (1.7%) | 86 (19.9%) |
| 1 or 2 Children | 142 (15.1%) | 59 (18.0%) |
| 3 or 4 Children | 0 (0.0%) | 0 (0.0%) |
| 5 or more Children | 0 (0.0%) | 0 (0.0%) |
| Total | 201 (4.2%) | 145 (17.1%) |
Race in Foley
The most populous races in Foley are White / Caucasian (17,012 | 80.6%), Hispanic or Latino (1,940 | 9.2%), and Black / African American (1,631 | 7.7%).
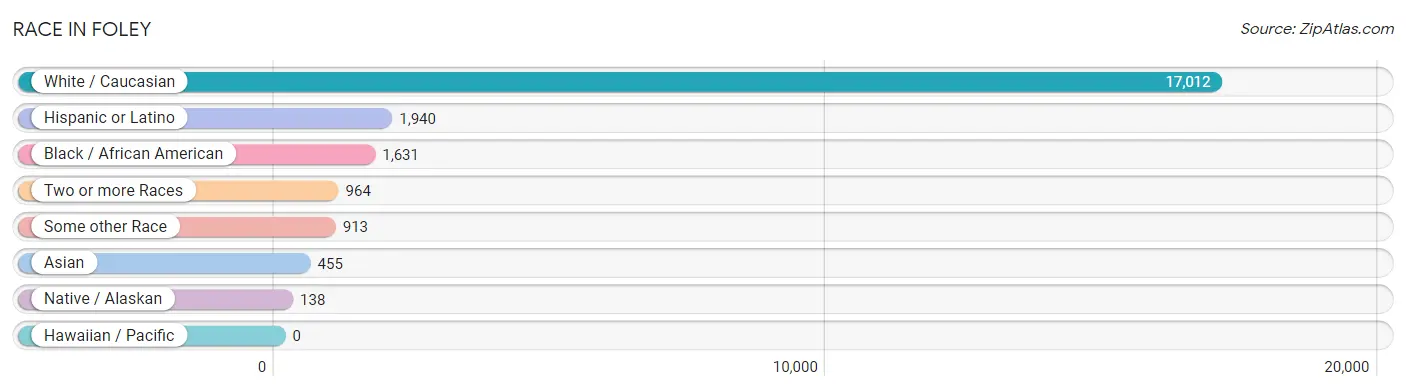
| Race | # Population | % Population |
| Asian | 455 | 2.2% |
| Black / African American | 1,631 | 7.7% |
| Hawaiian / Pacific | 0 | 0.0% |
| Hispanic or Latino | 1,940 | 9.2% |
| Native / Alaskan | 138 | 0.6% |
| White / Caucasian | 17,012 | 80.6% |
| Two or more Races | 964 | 4.6% |
| Some other Race | 913 | 4.3% |
| Total | 21,113 | 100.0% |
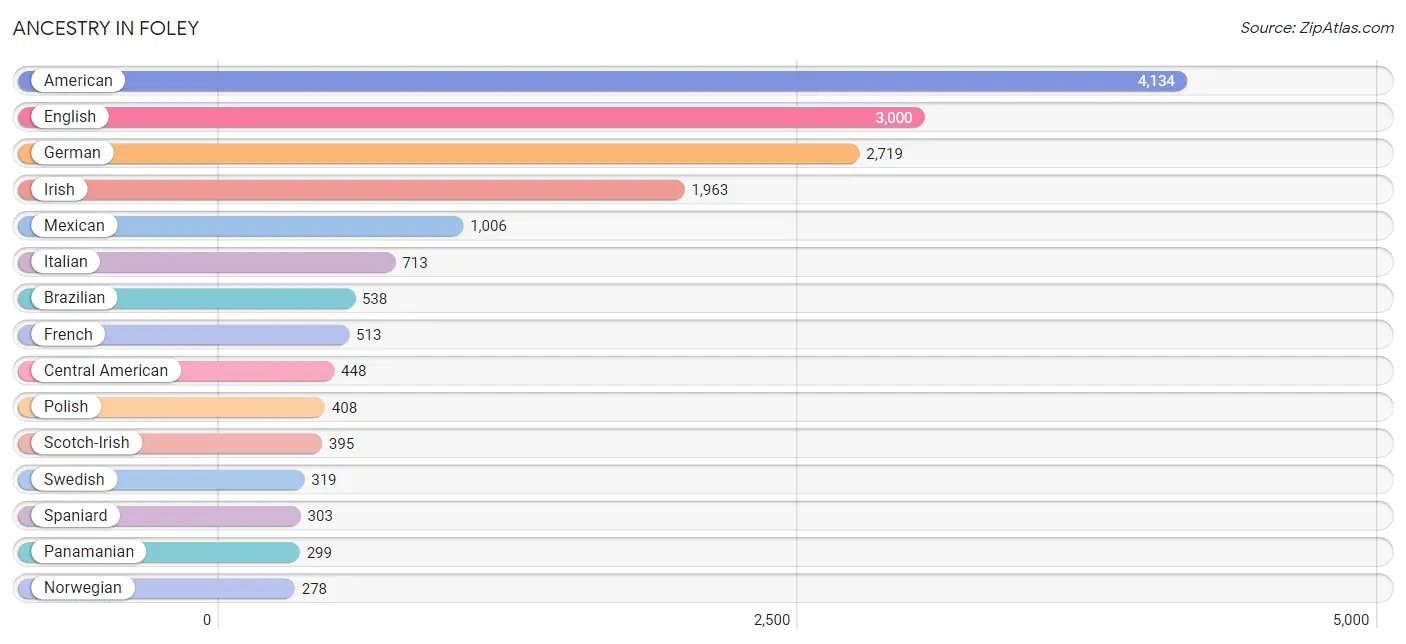
Ancestry in Foley
The most populous ancestries reported in Foley are American (4,134 | 19.6%), English (3,000 | 14.2%), German (2,719 | 12.9%), Irish (1,963 | 9.3%), and Mexican (1,006 | 4.8%), together accounting for 60.7% of all Foley residents.
| Ancestry | # Population | % Population |
| African | 180 | 0.9% |
| American | 4,134 | 19.6% |
| Belgian | 57 | 0.3% |
| Bhutanese | 11 | 0.1% |
| Brazilian | 538 | 2.5% |
| British | 68 | 0.3% |
| Central American | 448 | 2.1% |
| Cherokee | 85 | 0.4% |
| Cheyenne | 22 | 0.1% |
| Chippewa | 33 | 0.2% |
| Colombian | 1 | 0.0% |
| Cuban | 171 | 0.8% |
| Czech | 91 | 0.4% |
| Czechoslovakian | 49 | 0.2% |
| Dutch | 44 | 0.2% |
| Eastern European | 77 | 0.4% |
| English | 3,000 | 14.2% |
| European | 243 | 1.1% |
| Finnish | 36 | 0.2% |
| French | 513 | 2.4% |
| French Canadian | 174 | 0.8% |
| German | 2,719 | 12.9% |
| Guatemalan | 119 | 0.6% |
| Haitian | 56 | 0.3% |
| Hungarian | 5 | 0.0% |
| Indian (Asian) | 262 | 1.2% |
| Iranian | 35 | 0.2% |
| Irish | 1,963 | 9.3% |
| Italian | 713 | 3.4% |
| Jamaican | 41 | 0.2% |
| Korean | 57 | 0.3% |
| Mexican | 1,006 | 4.8% |
| Mexican American Indian | 138 | 0.6% |
| Northern European | 84 | 0.4% |
| Norwegian | 278 | 1.3% |
| Pakistani | 26 | 0.1% |
| Panamanian | 299 | 1.4% |
| Polish | 408 | 1.9% |
| Puerto Rican | 2 | 0.0% |
| Romanian | 15 | 0.1% |
| Russian | 49 | 0.2% |
| Salvadoran | 30 | 0.1% |
| Scandinavian | 33 | 0.2% |
| Scotch-Irish | 395 | 1.9% |
| Scottish | 218 | 1.0% |
| South American | 1 | 0.0% |
| Spaniard | 303 | 1.4% |
| Spanish | 9 | 0.0% |
| Subsaharan African | 180 | 0.9% |
| Swedish | 319 | 1.5% |
| Swiss | 21 | 0.1% |
| Thai | 103 | 0.5% |
| Ukrainian | 21 | 0.1% |
| Welsh | 15 | 0.1% | View All 54 Rows |
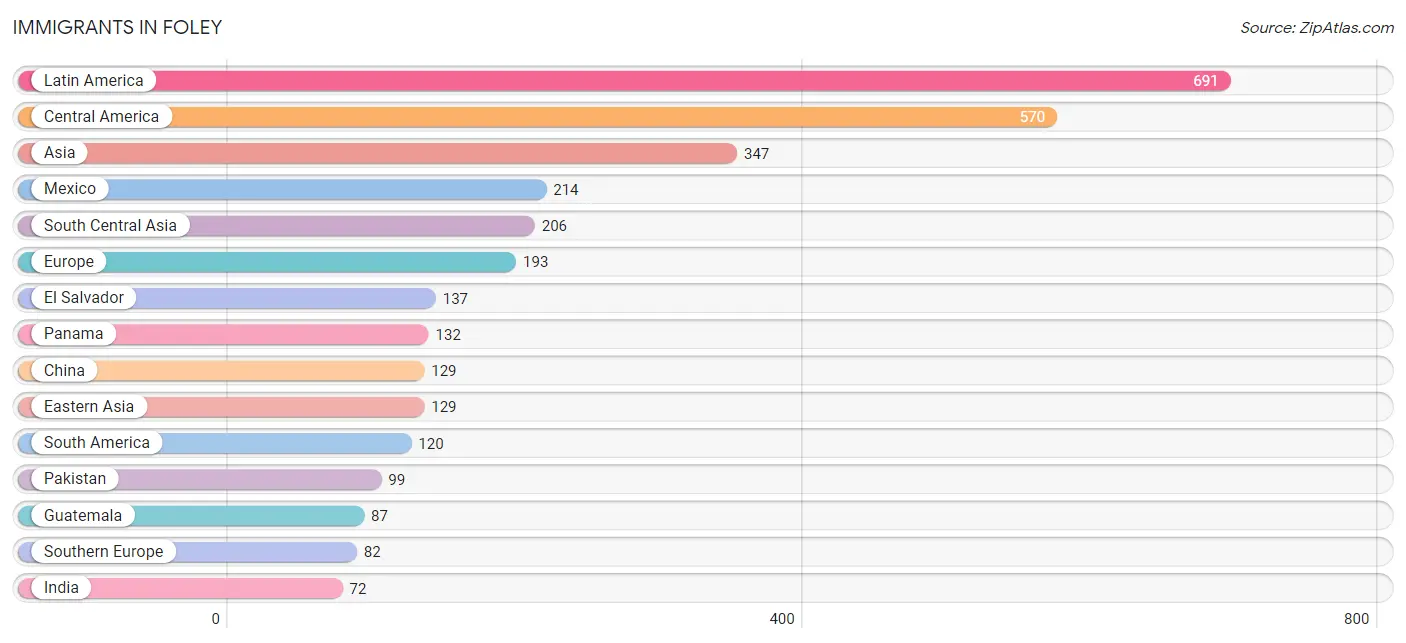
Immigrants in Foley
The most numerous immigrant groups reported in Foley came from Latin America (691 | 3.3%), Central America (570 | 2.7%), Asia (347 | 1.6%), Mexico (214 | 1.0%), and South Central Asia (206 | 1.0%), together accounting for 9.6% of all Foley residents.
| Immigration Origin | # Population | % Population |
| Asia | 347 | 1.6% |
| Brazil | 56 | 0.3% |
| Canada | 30 | 0.1% |
| Caribbean | 1 | 0.0% |
| Central America | 570 | 2.7% |
| China | 129 | 0.6% |
| Colombia | 32 | 0.2% |
| Eastern Asia | 129 | 0.6% |
| Eastern Europe | 15 | 0.1% |
| El Salvador | 137 | 0.6% |
| England | 54 | 0.3% |
| Europe | 193 | 0.9% |
| Germany | 28 | 0.1% |
| Guatemala | 87 | 0.4% |
| India | 72 | 0.3% |
| Iran | 35 | 0.2% |
| Italy | 16 | 0.1% |
| Jamaica | 1 | 0.0% |
| Latin America | 691 | 3.3% |
| Mexico | 214 | 1.0% |
| Moldova | 15 | 0.1% |
| Netherlands | 14 | 0.1% |
| Northern Europe | 54 | 0.3% |
| Pakistan | 99 | 0.5% |
| Panama | 132 | 0.6% |
| Peru | 32 | 0.2% |
| Philippines | 12 | 0.1% |
| South America | 120 | 0.6% |
| South Central Asia | 206 | 1.0% |
| South Eastern Asia | 12 | 0.1% |
| Southern Europe | 82 | 0.4% |
| Spain | 66 | 0.3% |
| Western Europe | 42 | 0.2% | View All 33 Rows |
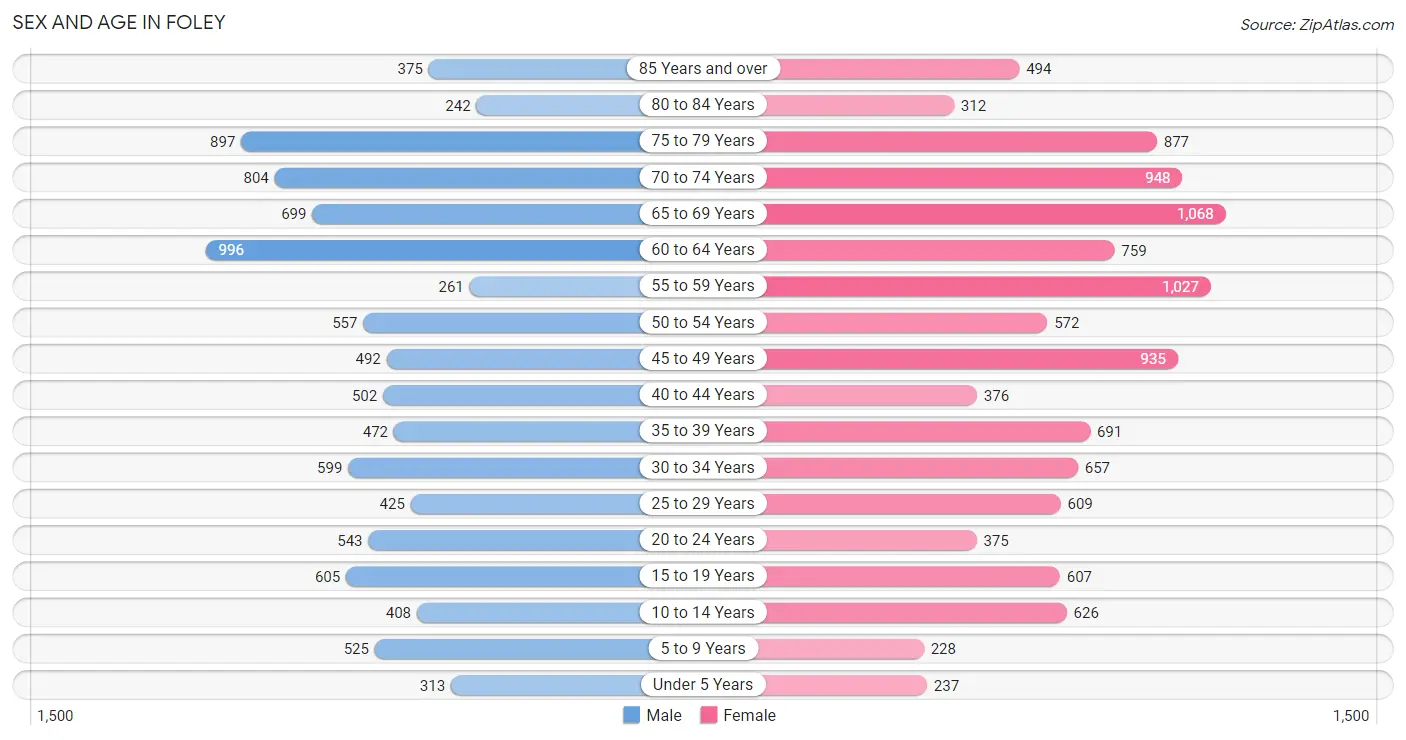
Sex and Age in Foley
Sex and Age in Foley
The most populous age groups in Foley are 60 to 64 Years (996 | 10.2%) for men and 65 to 69 Years (1,068 | 9.4%) for women.
| Age Bracket | Male | Female |
| Under 5 Years | 313 (3.2%) | 237 (2.1%) |
| 5 to 9 Years | 525 (5.4%) | 228 (2.0%) |
| 10 to 14 Years | 408 (4.2%) | 626 (5.5%) |
| 15 to 19 Years | 605 (6.2%) | 607 (5.3%) |
| 20 to 24 Years | 543 (5.6%) | 375 (3.3%) |
| 25 to 29 Years | 425 (4.4%) | 609 (5.3%) |
| 30 to 34 Years | 599 (6.2%) | 657 (5.8%) |
| 35 to 39 Years | 472 (4.9%) | 691 (6.1%) |
| 40 to 44 Years | 502 (5.2%) | 376 (3.3%) |
| 45 to 49 Years | 492 (5.1%) | 935 (8.2%) |
| 50 to 54 Years | 557 (5.7%) | 572 (5.0%) |
| 55 to 59 Years | 261 (2.7%) | 1,027 (9.0%) |
| 60 to 64 Years | 996 (10.2%) | 759 (6.7%) |
| 65 to 69 Years | 699 (7.2%) | 1,068 (9.4%) |
| 70 to 74 Years | 804 (8.3%) | 948 (8.3%) |
| 75 to 79 Years | 897 (9.2%) | 877 (7.7%) |
| 80 to 84 Years | 242 (2.5%) | 312 (2.7%) |
| 85 Years and over | 375 (3.9%) | 494 (4.3%) |
| Total | 9,715 (100.0%) | 11,398 (100.0%) |
Families and Households in Foley
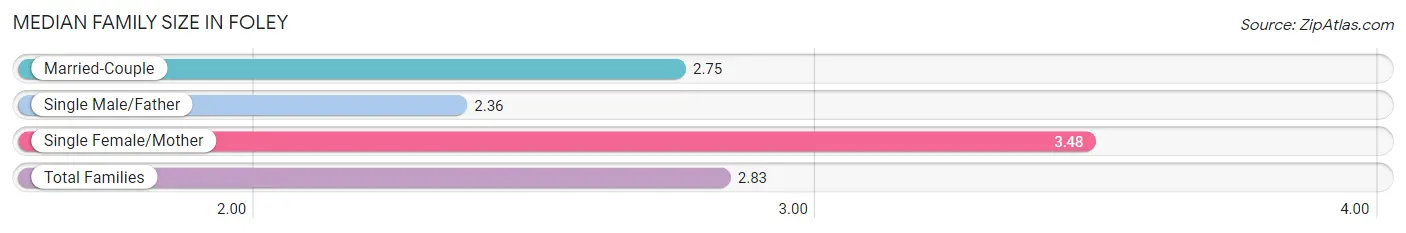
Median Family Size in Foley
The median family size in Foley is 2.83 persons per family, with single female/mother families (662 | 11.8%) accounting for the largest median family size of 3.48 persons per family. On the other hand, single male/father families (188 | 3.4%) represent the smallest median family size with 2.36 persons per family.
| Family Type | # Families | Family Size |
| Married-Couple | 4,742 (84.8%) | 2.75 |
| Single Male/Father | 188 (3.4%) | 2.36 |
| Single Female/Mother | 662 (11.8%) | 3.48 |
| Total Families | 5,592 (100.0%) | 2.83 |
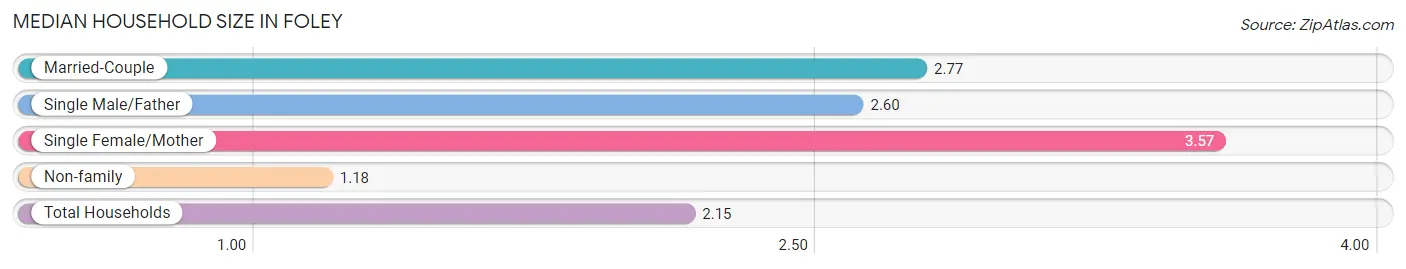
Median Household Size in Foley
The median household size in Foley is 2.15 persons per household, with single female/mother households (662 | 6.8%) accounting for the largest median household size of 3.57 persons per household. non-family households (4,121 | 42.4%) represent the smallest median household size with 1.18 persons per household.
| Household Type | # Households | Household Size |
| Married-Couple | 4,742 (48.8%) | 2.77 |
| Single Male/Father | 188 (1.9%) | 2.60 |
| Single Female/Mother | 662 (6.8%) | 3.57 |
| Non-family | 4,121 (42.4%) | 1.18 |
| Total Households | 9,713 (100.0%) | 2.15 |
Household Size by Marriage Status in Foley
Out of a total of 9,713 households in Foley, 5,592 (57.6%) are family households, while 4,121 (42.4%) are nonfamily households. The most numerous type of family households are 2-person households, comprising 3,694, and the most common type of nonfamily households are 1-person households, comprising 3,559.
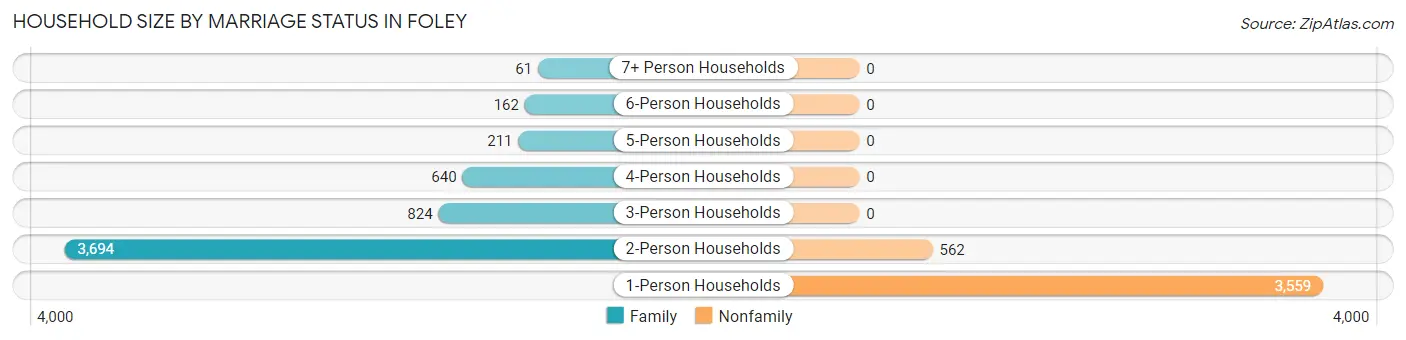
| Household Size | Family Households | Nonfamily Households |
| 1-Person Households | - | 3,559 (36.6%) |
| 2-Person Households | 3,694 (38.0%) | 562 (5.8%) |
| 3-Person Households | 824 (8.5%) | 0 (0.0%) |
| 4-Person Households | 640 (6.6%) | 0 (0.0%) |
| 5-Person Households | 211 (2.2%) | 0 (0.0%) |
| 6-Person Households | 162 (1.7%) | 0 (0.0%) |
| 7+ Person Households | 61 (0.6%) | 0 (0.0%) |
| Total | 5,592 (57.6%) | 4,121 (42.4%) |
Female Fertility in Foley
Fertility by Age in Foley
Average fertility rate in Foley is 38.0 births per 1,000 women. Women in the age bracket of 20 to 34 years have the highest fertility rate with 77.0 births per 1,000 women. Women in the age bracket of 20 to 34 years acount for 78.3% of all women with births.
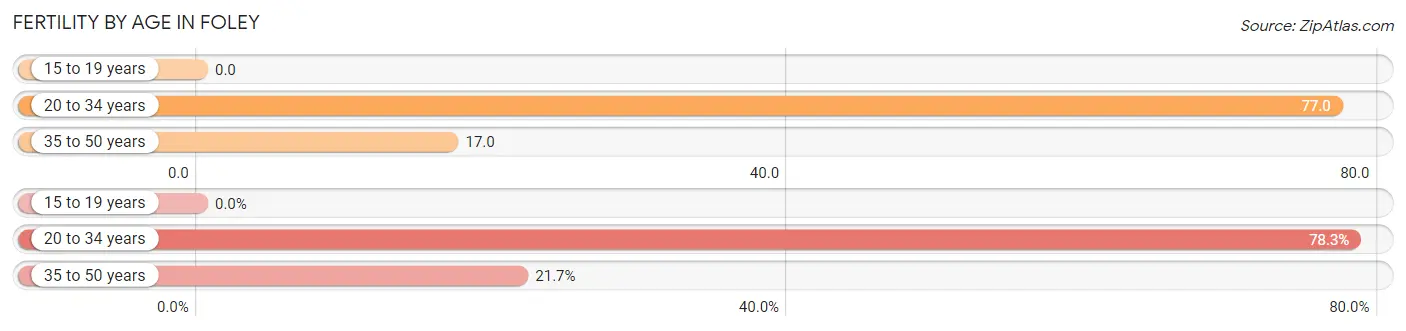
| Age Bracket | Women with Births | Births / 1,000 Women |
| 15 to 19 years | 0 (0.0%) | 0.0 |
| 20 to 34 years | 126 (78.3%) | 77.0 |
| 35 to 50 years | 35 (21.7%) | 17.0 |
| Total | 161 (100.0%) | 38.0 |
Fertility by Age by Marriage Status in Foley
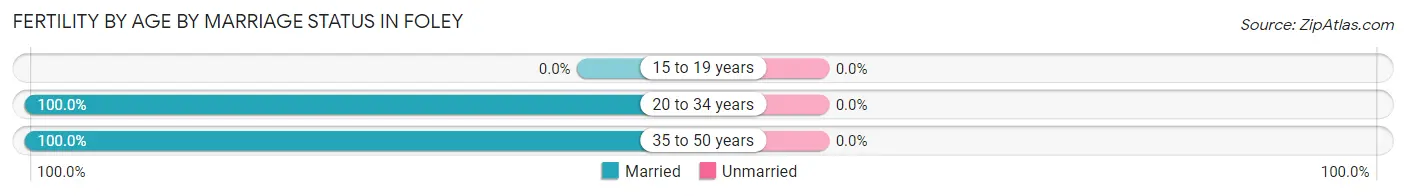
| Age Bracket | Married | Unmarried |
| 15 to 19 years | 0 (0.0%) | 0 (0.0%) |
| 20 to 34 years | 126 (100.0%) | 0 (0.0%) |
| 35 to 50 years | 35 (100.0%) | 0 (0.0%) |
| Total | 161 (100.0%) | 0 (0.0%) |
Fertility by Education in Foley
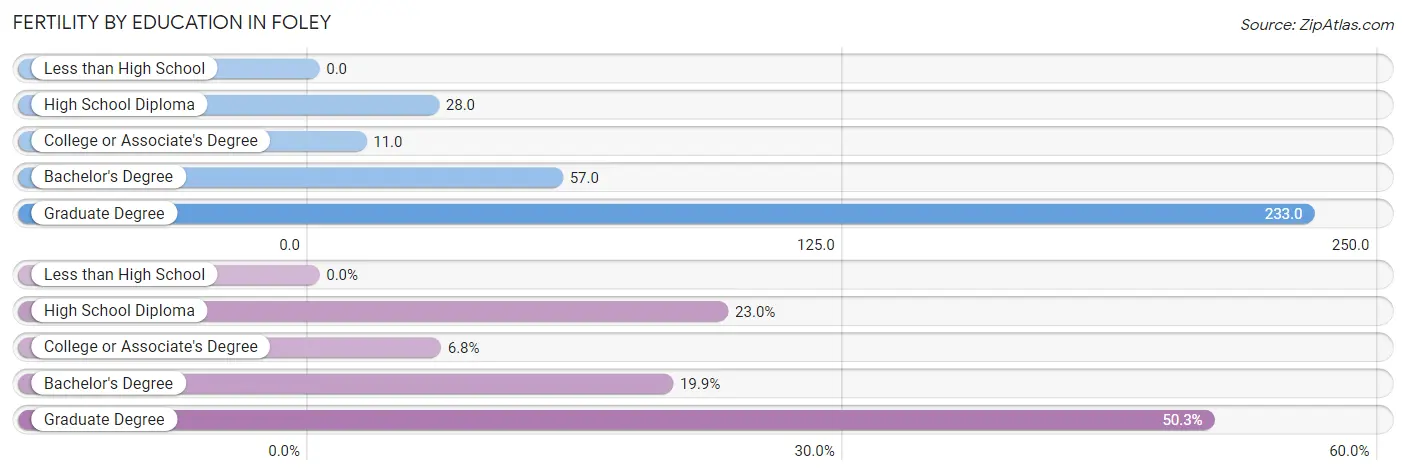
| Educational Attainment | Women with Births | Births / 1,000 Women |
| Less than High School | 0 (0.0%) | 0.0 |
| High School Diploma | 37 (23.0%) | 28.0 |
| College or Associate's Degree | 11 (6.8%) | 11.0 |
| Bachelor's Degree | 32 (19.9%) | 57.0 |
| Graduate Degree | 81 (50.3%) | 233.0 |
| Total | 161 (100.0%) | 38.0 |
Fertility by Education by Marriage Status in Foley
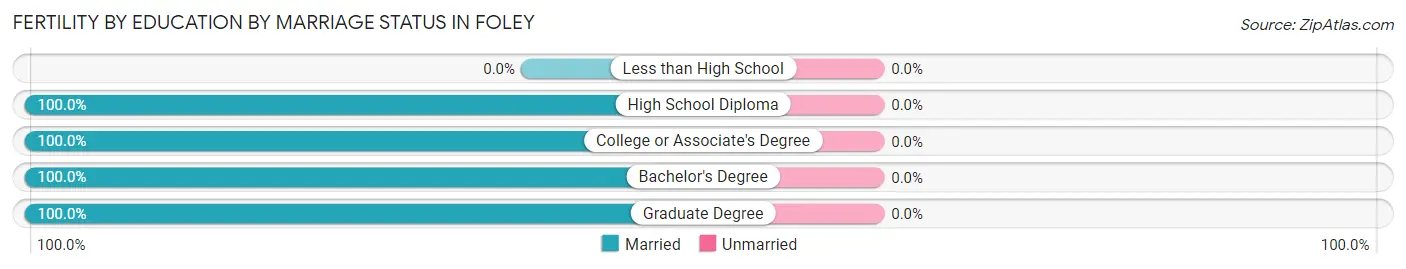
| Educational Attainment | Married | Unmarried |
| Less than High School | 0 (0.0%) | 0 (0.0%) |
| High School Diploma | 37 (100.0%) | 0 (0.0%) |
| College or Associate's Degree | 11 (100.0%) | 0 (0.0%) |
| Bachelor's Degree | 32 (100.0%) | 0 (0.0%) |
| Graduate Degree | 81 (100.0%) | 0 (0.0%) |
| Total | 161 (100.0%) | 0 (0.0%) |
Employment Characteristics in Foley
Employment by Class of Employer in Foley
Among the 8,129 employed individuals in Foley, private company employees (5,774 | 71.0%), self-employed (not incorporated) (636 | 7.8%), and local government employees (518 | 6.4%) make up the most common classes of employment.
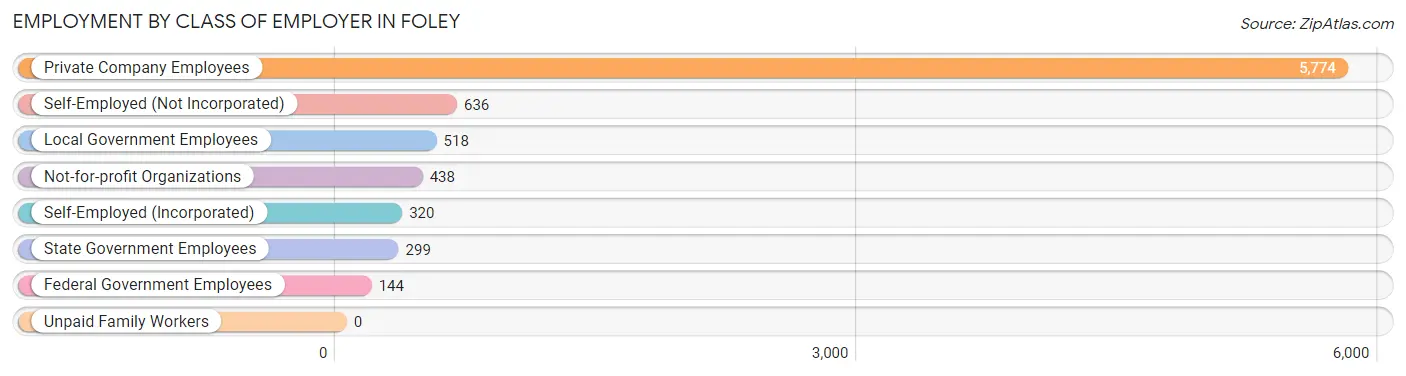
| Employer Class | # Employees | % Employees |
| Private Company Employees | 5,774 | 71.0% |
| Self-Employed (Incorporated) | 320 | 3.9% |
| Self-Employed (Not Incorporated) | 636 | 7.8% |
| Not-for-profit Organizations | 438 | 5.4% |
| Local Government Employees | 518 | 6.4% |
| State Government Employees | 299 | 3.7% |
| Federal Government Employees | 144 | 1.8% |
| Unpaid Family Workers | 0 | 0.0% |
| Total | 8,129 | 100.0% |
Employment Status by Age in Foley
According to the labor force statistics for Foley, out of the total population over 16 years of age (18,362), 48.3% or 8,869 individuals are in the labor force, with 4.9% or 435 of them unemployed. The age group with the highest labor force participation rate is 25 to 29 years, with 98.0% or 1,013 individuals in the labor force. Within the labor force, the 35 to 44 years age range has the highest percentage of unemployed individuals, with 14.4% or 225 of them being unemployed.
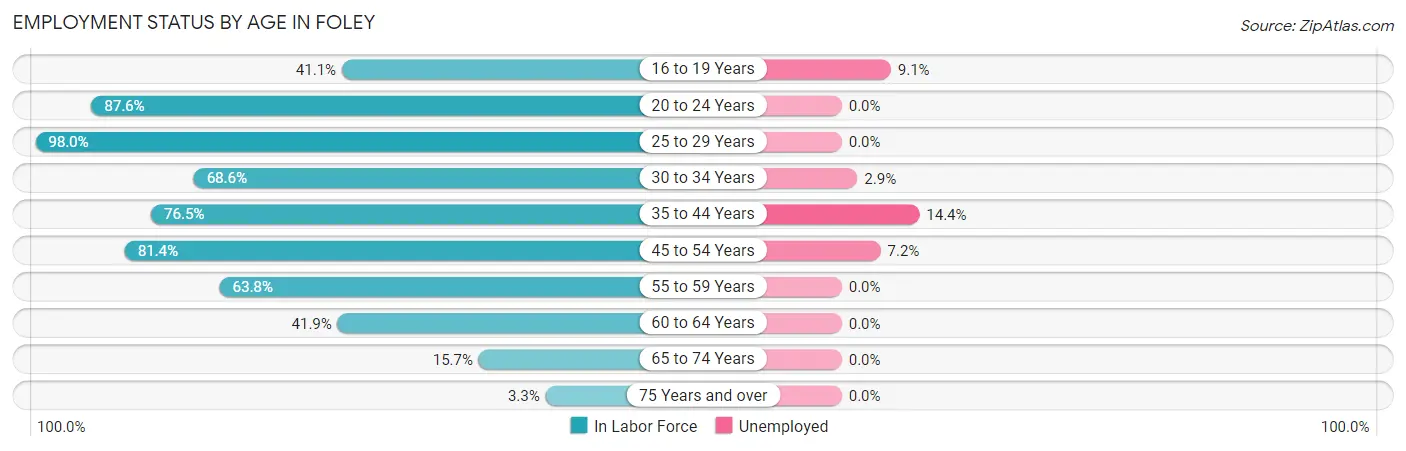
| Age Bracket | In Labor Force | Unemployed |
| 16 to 19 Years | 328 (41.1%) | 30 (9.1%) |
| 20 to 24 Years | 804 (87.6%) | 0 (0.0%) |
| 25 to 29 Years | 1,013 (98.0%) | 0 (0.0%) |
| 30 to 34 Years | 862 (68.6%) | 25 (2.9%) |
| 35 to 44 Years | 1,561 (76.5%) | 225 (14.4%) |
| 45 to 54 Years | 2,081 (81.4%) | 150 (7.2%) |
| 55 to 59 Years | 822 (63.8%) | 0 (0.0%) |
| 60 to 64 Years | 735 (41.9%) | 0 (0.0%) |
| 65 to 74 Years | 552 (15.7%) | 0 (0.0%) |
| 75 Years and over | 106 (3.3%) | 0 (0.0%) |
| Total | 8,869 (48.3%) | 435 (4.9%) |
Employment Status by Educational Attainment in Foley
According to labor force statistics for Foley, 71.2% of individuals (7,070) out of the total population between 25 and 64 years of age (9,930) are in the labor force, with 5.7% or 403 of them being unemployed. The group with the highest labor force participation rate are those with the educational attainment of bachelor's degree or higher, with 82.6% or 2,090 individuals in the labor force. Within the labor force, individuals with less than high school education have the highest percentage of unemployment, with 23.2% or 190 of them being unemployed.
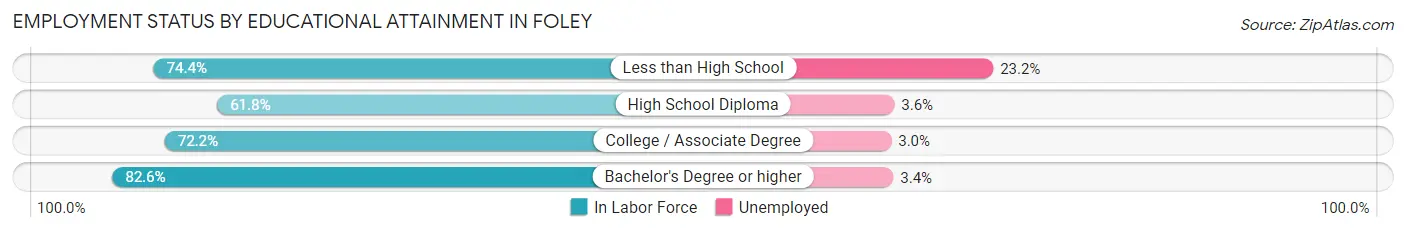
| Educational Attainment | In Labor Force | Unemployed |
| Less than High School | 818 (74.4%) | 255 (23.2%) |
| High School Diploma | 2,295 (61.8%) | 134 (3.6%) |
| College / Associate Degree | 1,868 (72.2%) | 78 (3.0%) |
| Bachelor's Degree or higher | 2,090 (82.6%) | 86 (3.4%) |
| Total | 7,070 (71.2%) | 566 (5.7%) |
Employment Occupations by Sex in Foley
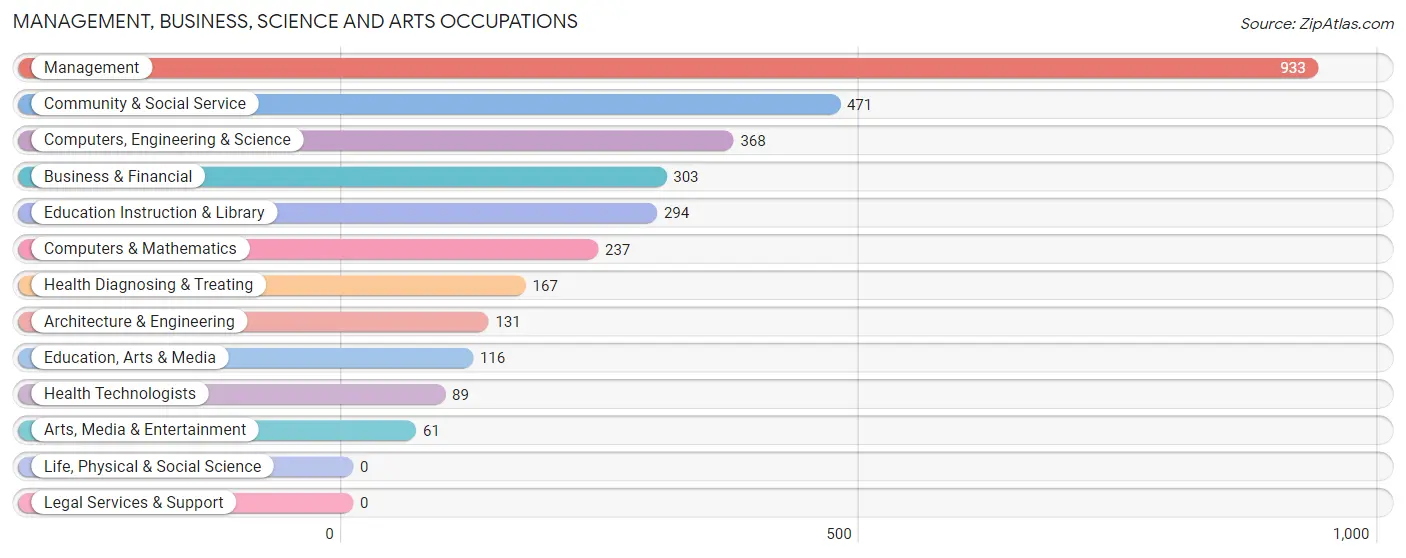
Management, Business, Science and Arts Occupations
The most common Management, Business, Science and Arts occupations in Foley are Management (933 | 11.1%), Community & Social Service (471 | 5.6%), Computers, Engineering & Science (368 | 4.4%), Business & Financial (303 | 3.6%), and Education Instruction & Library (294 | 3.5%).
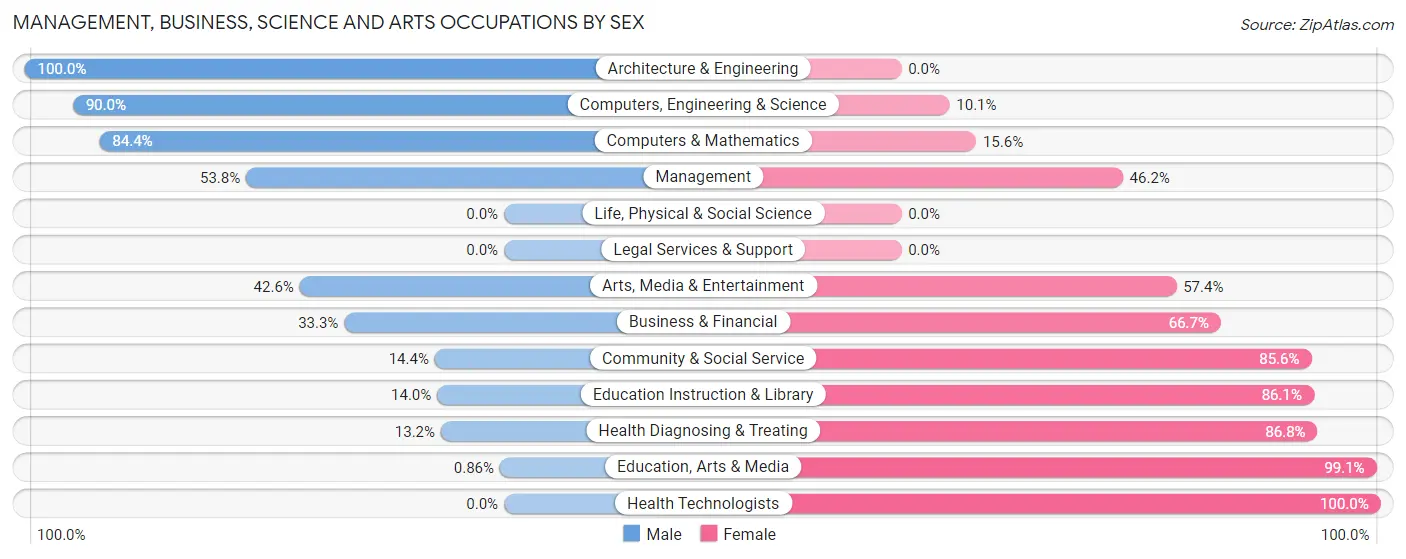
Management, Business, Science and Arts Occupations by Sex
Within the Management, Business, Science and Arts occupations in Foley, the most male-oriented occupations are Architecture & Engineering (100.0%), Computers, Engineering & Science (89.9%), and Computers & Mathematics (84.4%), while the most female-oriented occupations are Health Technologists (100.0%), Education, Arts & Media (99.1%), and Health Diagnosing & Treating (86.8%).
| Occupation | Male | Female |
| Management | 502 (53.8%) | 431 (46.2%) |
| Business & Financial | 101 (33.3%) | 202 (66.7%) |
| Computers, Engineering & Science | 331 (89.9%) | 37 (10.1%) |
| Computers & Mathematics | 200 (84.4%) | 37 (15.6%) |
| Architecture & Engineering | 131 (100.0%) | 0 (0.0%) |
| Life, Physical & Social Science | 0 (0.0%) | 0 (0.0%) |
| Community & Social Service | 68 (14.4%) | 403 (85.6%) |
| Education, Arts & Media | 1 (0.9%) | 115 (99.1%) |
| Legal Services & Support | 0 (0.0%) | 0 (0.0%) |
| Education Instruction & Library | 41 (14.0%) | 253 (86.1%) |
| Arts, Media & Entertainment | 26 (42.6%) | 35 (57.4%) |
| Health Diagnosing & Treating | 22 (13.2%) | 145 (86.8%) |
| Health Technologists | 0 (0.0%) | 89 (100.0%) |
| Total (Category) | 1,024 (45.7%) | 1,218 (54.3%) |
| Total (Overall) | 4,051 (48.0%) | 4,384 (52.0%) |
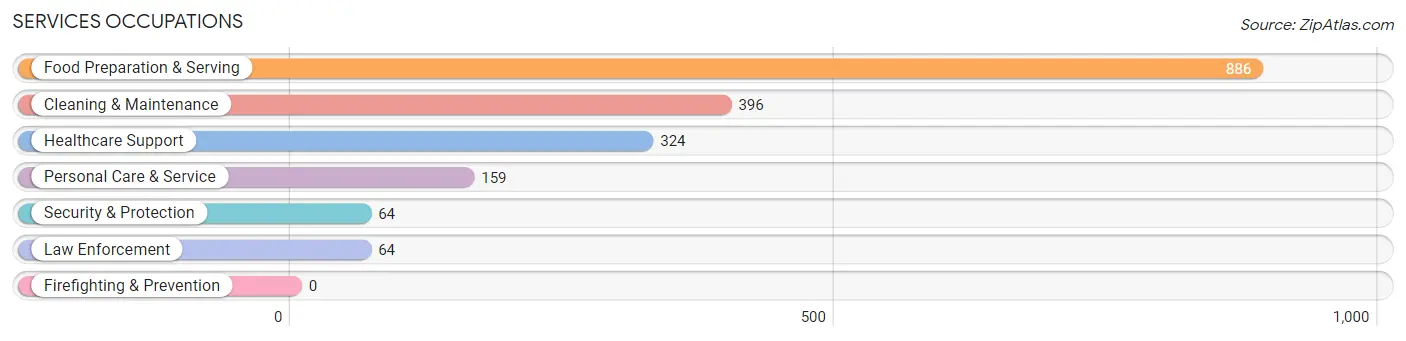
Services Occupations
The most common Services occupations in Foley are Food Preparation & Serving (886 | 10.5%), Cleaning & Maintenance (396 | 4.7%), Healthcare Support (324 | 3.8%), Personal Care & Service (159 | 1.9%), and Security & Protection (64 | 0.8%).
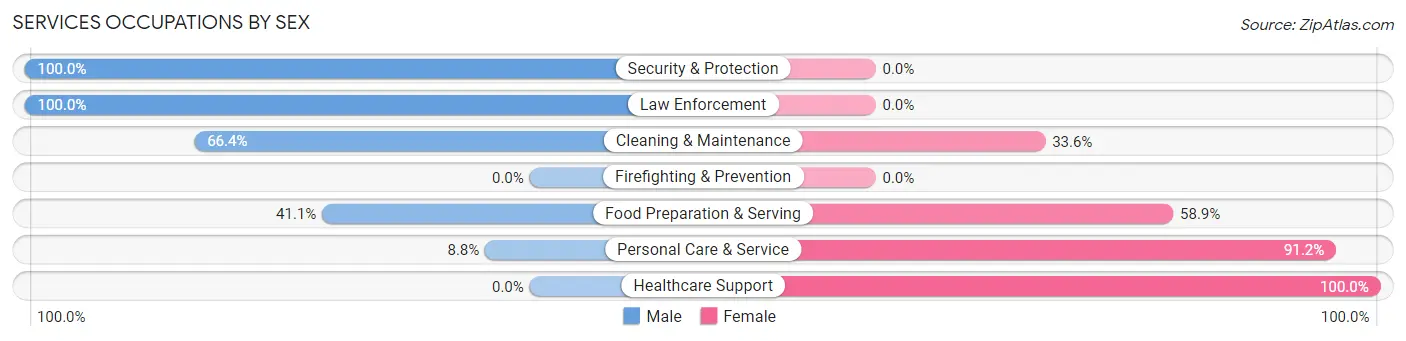
Services Occupations by Sex
Within the Services occupations in Foley, the most male-oriented occupations are Security & Protection (100.0%), Law Enforcement (100.0%), and Cleaning & Maintenance (66.4%), while the most female-oriented occupations are Healthcare Support (100.0%), Personal Care & Service (91.2%), and Food Preparation & Serving (58.9%).
| Occupation | Male | Female |
| Healthcare Support | 0 (0.0%) | 324 (100.0%) |
| Security & Protection | 64 (100.0%) | 0 (0.0%) |
| Firefighting & Prevention | 0 (0.0%) | 0 (0.0%) |
| Law Enforcement | 64 (100.0%) | 0 (0.0%) |
| Food Preparation & Serving | 364 (41.1%) | 522 (58.9%) |
| Cleaning & Maintenance | 263 (66.4%) | 133 (33.6%) |
| Personal Care & Service | 14 (8.8%) | 145 (91.2%) |
| Total (Category) | 705 (38.6%) | 1,124 (61.5%) |
| Total (Overall) | 4,051 (48.0%) | 4,384 (52.0%) |
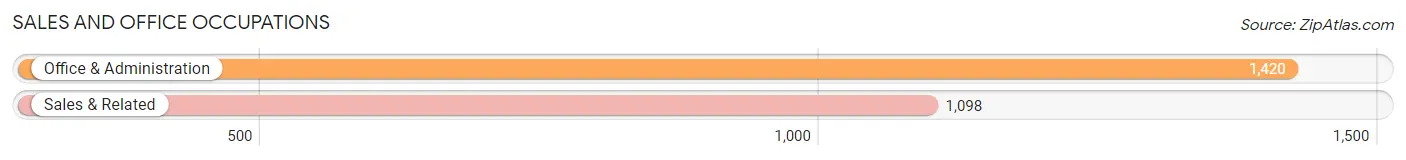
Sales and Office Occupations
The most common Sales and Office occupations in Foley are Office & Administration (1,420 | 16.8%), and Sales & Related (1,098 | 13.0%).
Sales and Office Occupations by Sex
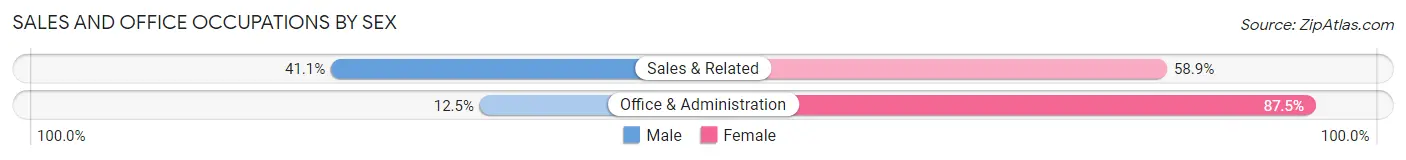
| Occupation | Male | Female |
| Sales & Related | 451 (41.1%) | 647 (58.9%) |
| Office & Administration | 177 (12.5%) | 1,243 (87.5%) |
| Total (Category) | 628 (24.9%) | 1,890 (75.1%) |
| Total (Overall) | 4,051 (48.0%) | 4,384 (52.0%) |
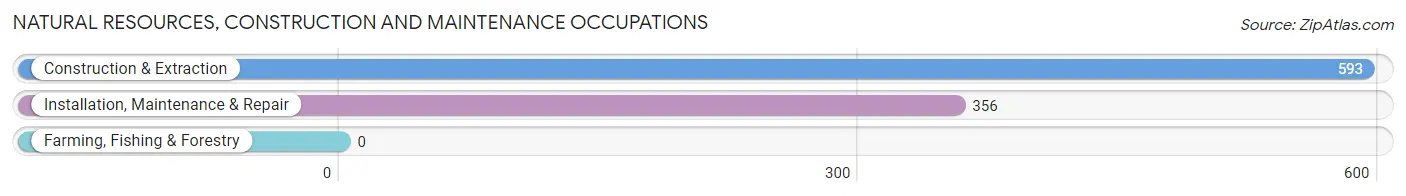
Natural Resources, Construction and Maintenance Occupations
The most common Natural Resources, Construction and Maintenance occupations in Foley are Construction & Extraction (593 | 7.0%), and Installation, Maintenance & Repair (356 | 4.2%).
Natural Resources, Construction and Maintenance Occupations by Sex
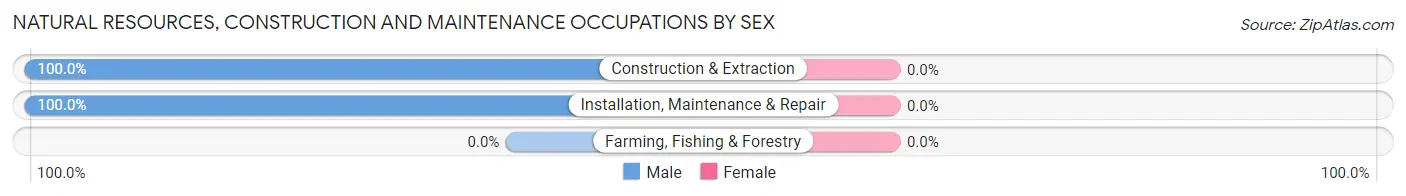
| Occupation | Male | Female |
| Farming, Fishing & Forestry | 0 (0.0%) | 0 (0.0%) |
| Construction & Extraction | 593 (100.0%) | 0 (0.0%) |
| Installation, Maintenance & Repair | 356 (100.0%) | 0 (0.0%) |
| Total (Category) | 949 (100.0%) | 0 (0.0%) |
| Total (Overall) | 4,051 (48.0%) | 4,384 (52.0%) |
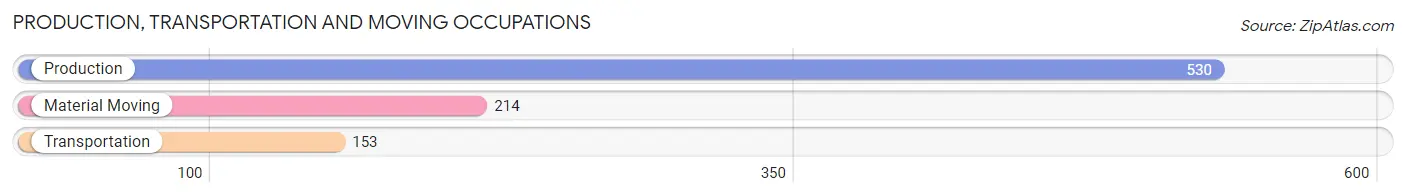
Production, Transportation and Moving Occupations
The most common Production, Transportation and Moving occupations in Foley are Production (530 | 6.3%), Material Moving (214 | 2.5%), and Transportation (153 | 1.8%).
Production, Transportation and Moving Occupations by Sex
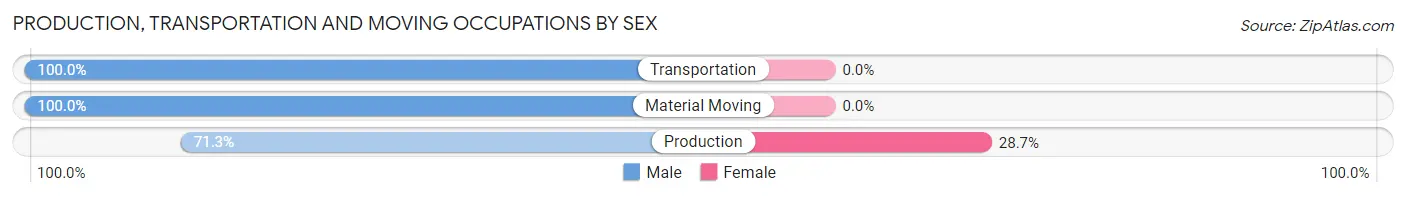
| Occupation | Male | Female |
| Production | 378 (71.3%) | 152 (28.7%) |
| Transportation | 153 (100.0%) | 0 (0.0%) |
| Material Moving | 214 (100.0%) | 0 (0.0%) |
| Total (Category) | 745 (83.1%) | 152 (17.0%) |
| Total (Overall) | 4,051 (48.0%) | 4,384 (52.0%) |
Employment Industries by Sex in Foley
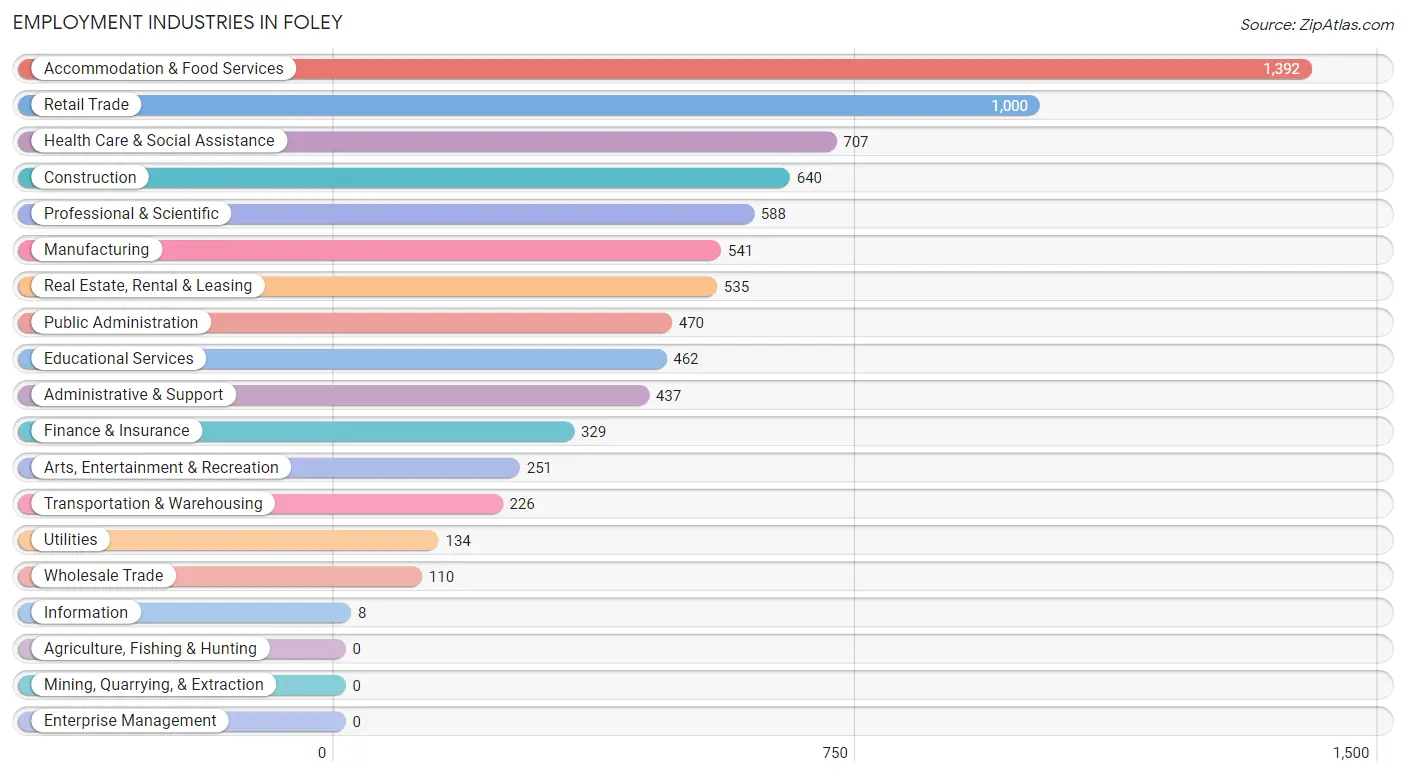
Employment Industries in Foley
The major employment industries in Foley include Accommodation & Food Services (1,392 | 16.5%), Retail Trade (1,000 | 11.9%), Health Care & Social Assistance (707 | 8.4%), Construction (640 | 7.6%), and Professional & Scientific (588 | 7.0%).
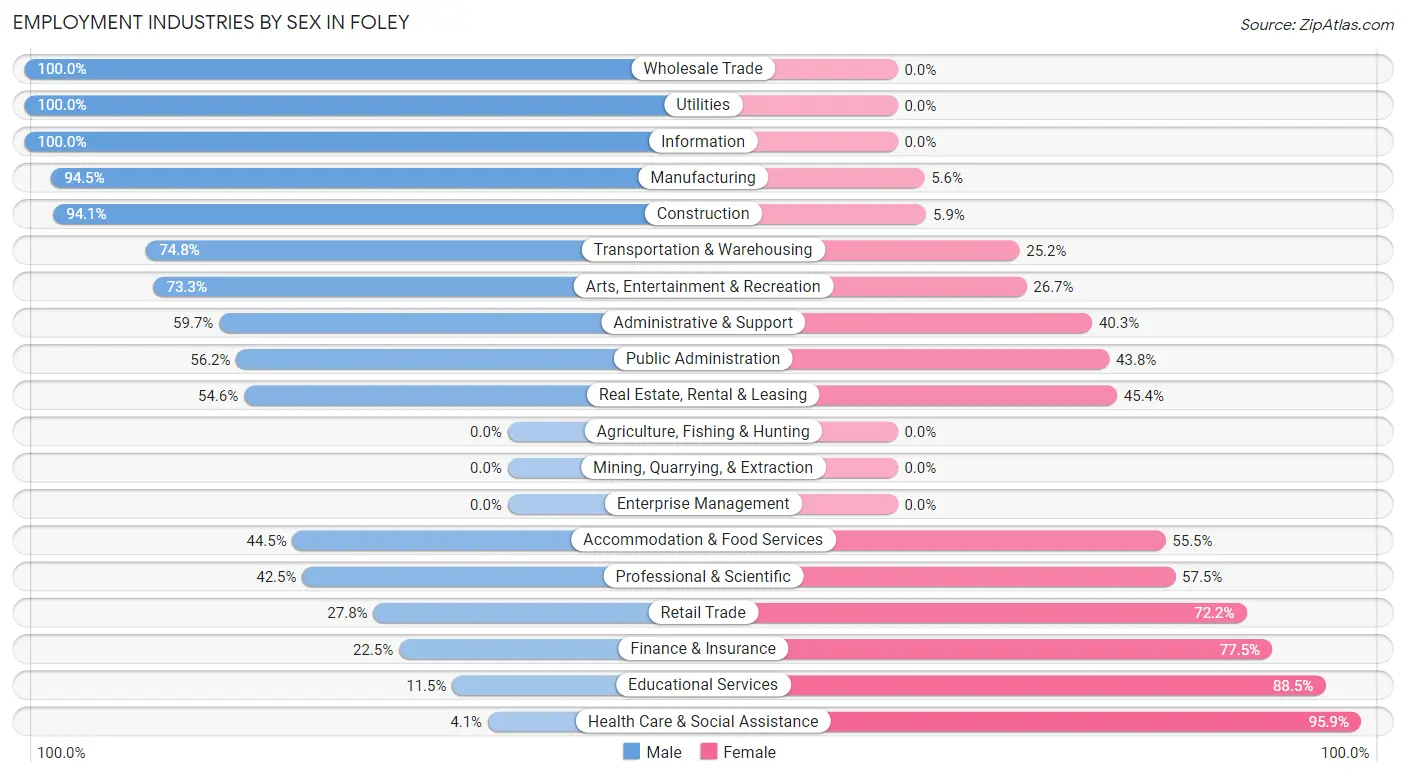
Employment Industries by Sex in Foley
The Foley industries that see more men than women are Wholesale Trade (100.0%), Utilities (100.0%), and Information (100.0%), whereas the industries that tend to have a higher number of women are Health Care & Social Assistance (95.9%), Educational Services (88.5%), and Finance & Insurance (77.5%).
| Industry | Male | Female |
| Agriculture, Fishing & Hunting | 0 (0.0%) | 0 (0.0%) |
| Mining, Quarrying, & Extraction | 0 (0.0%) | 0 (0.0%) |
| Construction | 602 (94.1%) | 38 (5.9%) |
| Manufacturing | 511 (94.5%) | 30 (5.6%) |
| Wholesale Trade | 110 (100.0%) | 0 (0.0%) |
| Retail Trade | 278 (27.8%) | 722 (72.2%) |
| Transportation & Warehousing | 169 (74.8%) | 57 (25.2%) |
| Utilities | 134 (100.0%) | 0 (0.0%) |
| Information | 8 (100.0%) | 0 (0.0%) |
| Finance & Insurance | 74 (22.5%) | 255 (77.5%) |
| Real Estate, Rental & Leasing | 292 (54.6%) | 243 (45.4%) |
| Professional & Scientific | 250 (42.5%) | 338 (57.5%) |
| Enterprise Management | 0 (0.0%) | 0 (0.0%) |
| Administrative & Support | 261 (59.7%) | 176 (40.3%) |
| Educational Services | 53 (11.5%) | 409 (88.5%) |
| Health Care & Social Assistance | 29 (4.1%) | 678 (95.9%) |
| Arts, Entertainment & Recreation | 184 (73.3%) | 67 (26.7%) |
| Accommodation & Food Services | 620 (44.5%) | 772 (55.5%) |
| Public Administration | 264 (56.2%) | 206 (43.8%) |
| Total | 4,051 (48.0%) | 4,384 (52.0%) |
Education in Foley
School Enrollment in Foley
The most common levels of schooling among the 3,552 students in Foley are high school (1,059 | 29.8%), middle school (805 | 22.7%), and college / undergraduate (436 | 12.3%).
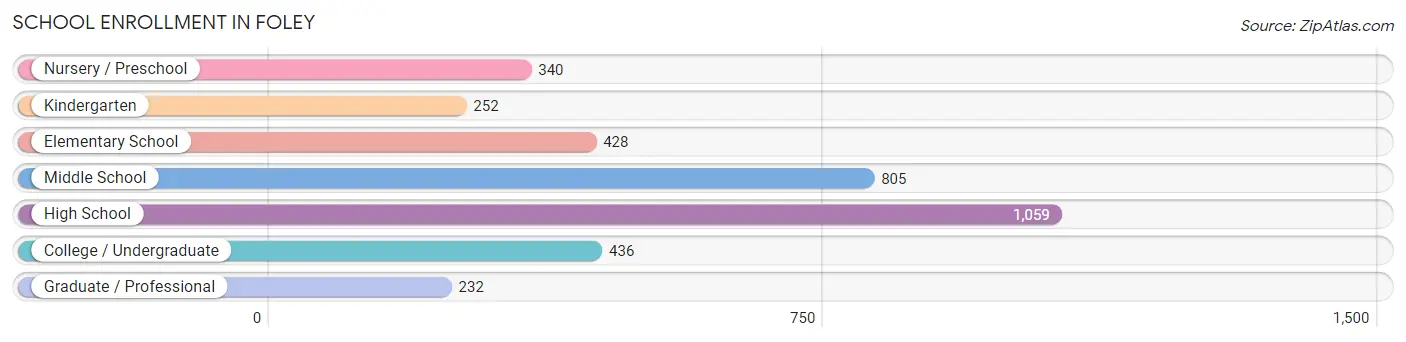
| School Level | # Students | % Students |
| Nursery / Preschool | 340 | 9.6% |
| Kindergarten | 252 | 7.1% |
| Elementary School | 428 | 12.0% |
| Middle School | 805 | 22.7% |
| High School | 1,059 | 29.8% |
| College / Undergraduate | 436 | 12.3% |
| Graduate / Professional | 232 | 6.5% |
| Total | 3,552 | 100.0% |
School Enrollment by Age by Funding Source in Foley
Out of a total of 3,552 students who are enrolled in schools in Foley, 458 (12.9%) attend a private institution, while the remaining 3,094 (87.1%) are enrolled in public schools. The age group of 3 to 4 year olds has the highest likelihood of being enrolled in private schools, with 131 (100.0% in the age bracket) enrolled. Conversely, the age group of 10 to 14 year olds has the lowest likelihood of being enrolled in a private school, with 996 (100.0% in the age bracket) attending a public institution.
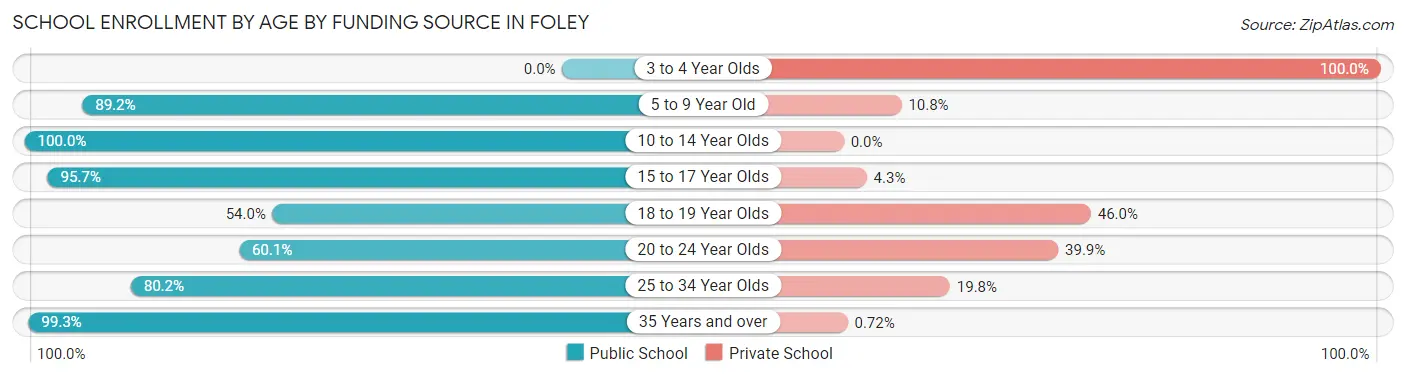
| Age Bracket | Public School | Private School |
| 3 to 4 Year Olds | 0 (0.0%) | 131 (100.0%) |
| 5 to 9 Year Old | 672 (89.2%) | 81 (10.8%) |
| 10 to 14 Year Olds | 996 (100.0%) | 0 (0.0%) |
| 15 to 17 Year Olds | 961 (95.7%) | 43 (4.3%) |
| 18 to 19 Year Olds | 68 (54.0%) | 58 (46.0%) |
| 20 to 24 Year Olds | 188 (60.1%) | 125 (39.9%) |
| 25 to 34 Year Olds | 73 (80.2%) | 18 (19.8%) |
| 35 Years and over | 137 (99.3%) | 1 (0.7%) |
| Total | 3,094 (87.1%) | 458 (12.9%) |
Educational Attainment by Field of Study in Foley
Business (1,185 | 27.2%), education (552 | 12.7%), engineering (381 | 8.7%), science & technology (363 | 8.3%), and social sciences (343 | 7.9%) are the most common fields of study among 4,356 individuals in Foley who have obtained a bachelor's degree or higher.
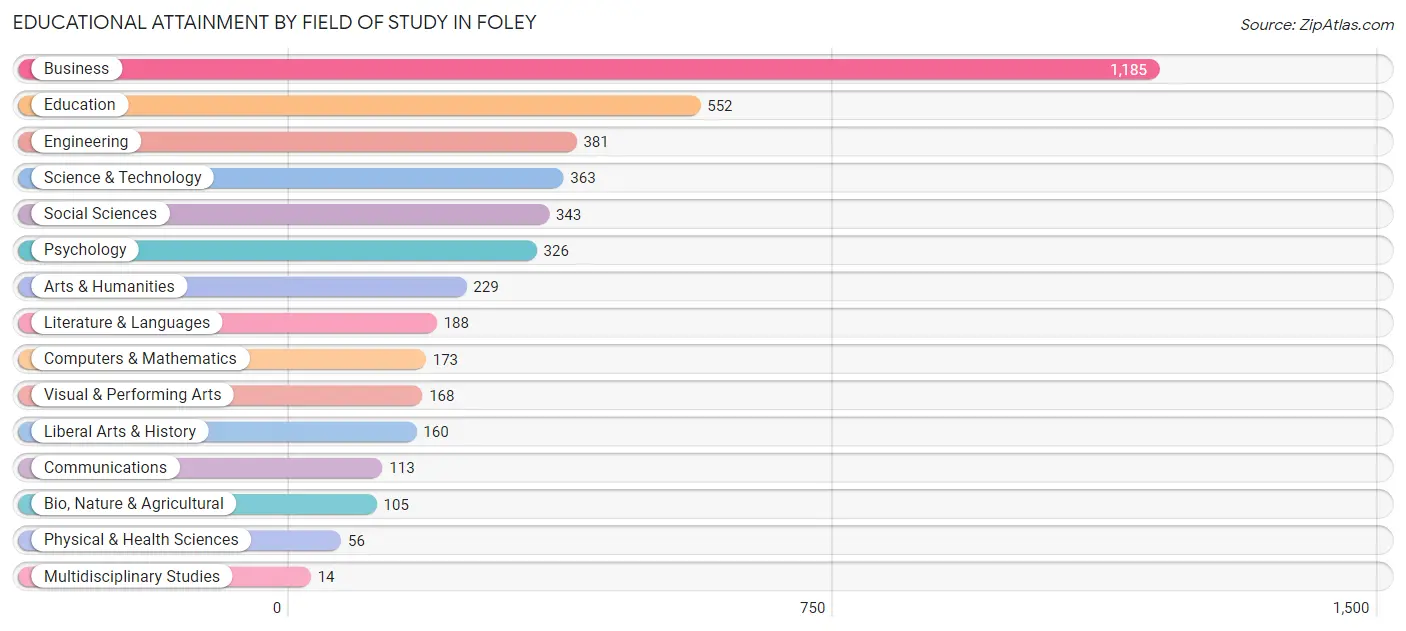
| Field of Study | # Graduates | % Graduates |
| Computers & Mathematics | 173 | 4.0% |
| Bio, Nature & Agricultural | 105 | 2.4% |
| Physical & Health Sciences | 56 | 1.3% |
| Psychology | 326 | 7.5% |
| Social Sciences | 343 | 7.9% |
| Engineering | 381 | 8.7% |
| Multidisciplinary Studies | 14 | 0.3% |
| Science & Technology | 363 | 8.3% |
| Business | 1,185 | 27.2% |
| Education | 552 | 12.7% |
| Literature & Languages | 188 | 4.3% |
| Liberal Arts & History | 160 | 3.7% |
| Visual & Performing Arts | 168 | 3.9% |
| Communications | 113 | 2.6% |
| Arts & Humanities | 229 | 5.3% |
| Total | 4,356 | 100.0% |
Transportation & Commute in Foley
Vehicle Availability by Sex in Foley
The most prevalent vehicle ownership categories in Foley are males with 2 vehicles (1,335, accounting for 34.6%) and females with 2 vehicles (1,670, making up 31.3%).
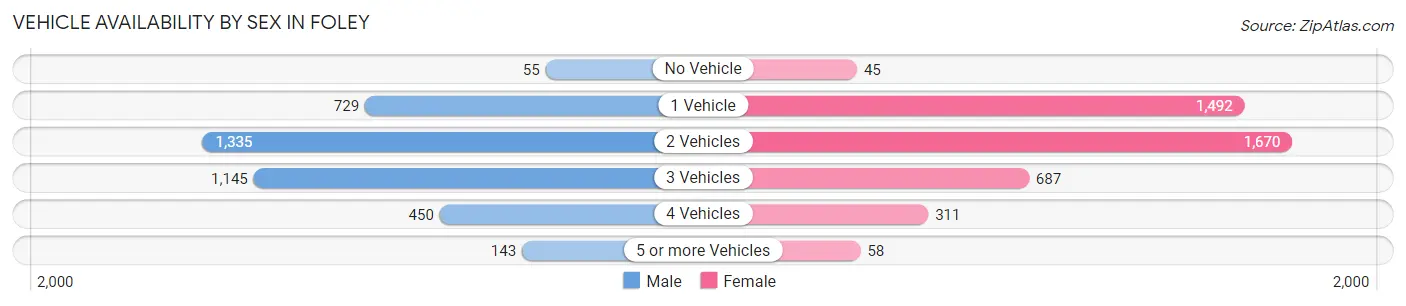
| Vehicles Available | Male | Female |
| No Vehicle | 55 (1.4%) | 45 (1.1%) |
| 1 Vehicle | 729 (18.9%) | 1,492 (35.0%) |
| 2 Vehicles | 1,335 (34.6%) | 1,670 (39.2%) |
| 3 Vehicles | 1,145 (29.7%) | 687 (16.1%) |
| 4 Vehicles | 450 (11.7%) | 311 (7.3%) |
| 5 or more Vehicles | 143 (3.7%) | 58 (1.4%) |
| Total | 3,857 (100.0%) | 4,263 (100.0%) |
Commute Time in Foley
The most frequently occuring commute durations in Foley are 20 to 24 minutes (1,580 commuters, 21.2%), 15 to 19 minutes (1,553 commuters, 20.8%), and 10 to 14 minutes (1,010 commuters, 13.6%).
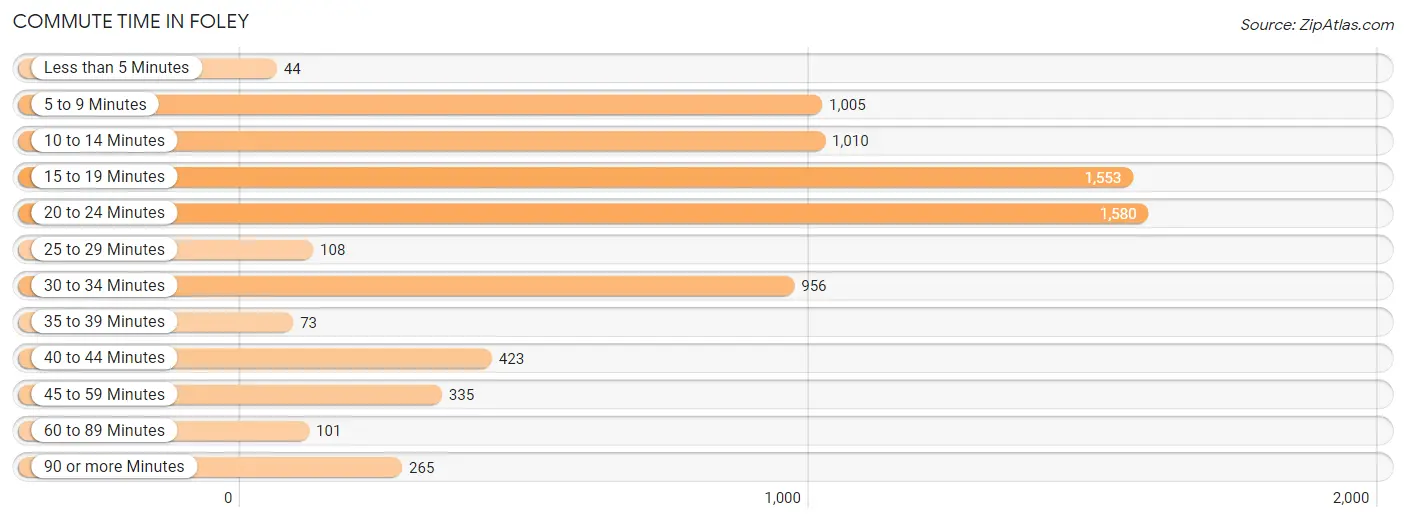
| Commute Time | # Commuters | % Commuters |
| Less than 5 Minutes | 44 | 0.6% |
| 5 to 9 Minutes | 1,005 | 13.5% |
| 10 to 14 Minutes | 1,010 | 13.6% |
| 15 to 19 Minutes | 1,553 | 20.8% |
| 20 to 24 Minutes | 1,580 | 21.2% |
| 25 to 29 Minutes | 108 | 1.5% |
| 30 to 34 Minutes | 956 | 12.8% |
| 35 to 39 Minutes | 73 | 1.0% |
| 40 to 44 Minutes | 423 | 5.7% |
| 45 to 59 Minutes | 335 | 4.5% |
| 60 to 89 Minutes | 101 | 1.4% |
| 90 or more Minutes | 265 | 3.6% |
Commute Time by Sex in Foley
The most common commute times in Foley are 15 to 19 minutes (861 commuters, 24.4%) for males and 20 to 24 minutes (918 commuters, 23.4%) for females.
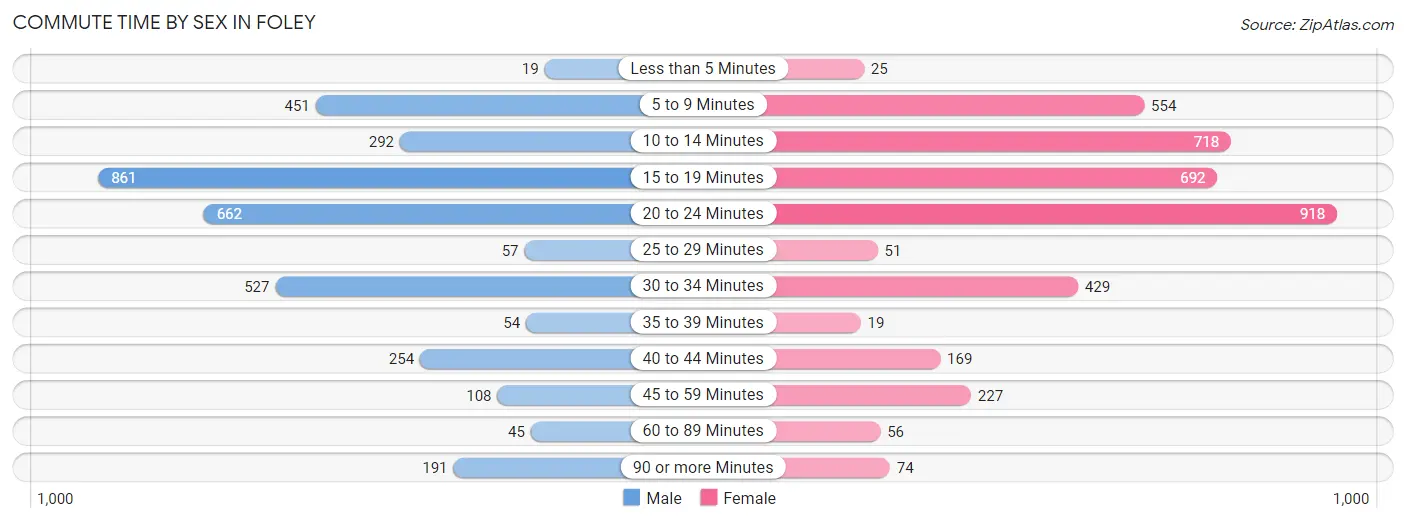
| Commute Time | Male | Female |
| Less than 5 Minutes | 19 (0.5%) | 25 (0.6%) |
| 5 to 9 Minutes | 451 (12.8%) | 554 (14.1%) |
| 10 to 14 Minutes | 292 (8.3%) | 718 (18.3%) |
| 15 to 19 Minutes | 861 (24.4%) | 692 (17.6%) |
| 20 to 24 Minutes | 662 (18.8%) | 918 (23.4%) |
| 25 to 29 Minutes | 57 (1.6%) | 51 (1.3%) |
| 30 to 34 Minutes | 527 (15.0%) | 429 (10.9%) |
| 35 to 39 Minutes | 54 (1.5%) | 19 (0.5%) |
| 40 to 44 Minutes | 254 (7.2%) | 169 (4.3%) |
| 45 to 59 Minutes | 108 (3.1%) | 227 (5.8%) |
| 60 to 89 Minutes | 45 (1.3%) | 56 (1.4%) |
| 90 or more Minutes | 191 (5.4%) | 74 (1.9%) |
Time of Departure to Work by Sex in Foley
The most frequent times of departure to work in Foley are 7:30 AM to 7:59 AM (728, 20.7%) for males and 7:30 AM to 7:59 AM (858, 21.8%) for females.
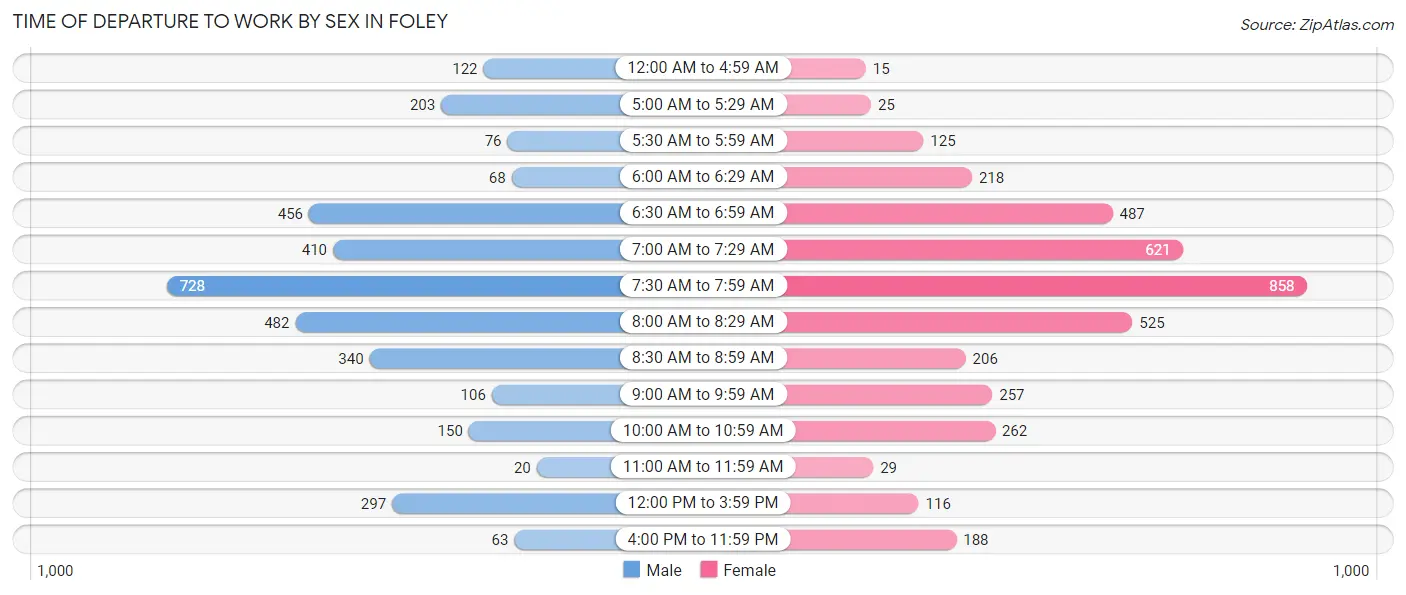
| Time of Departure | Male | Female |
| 12:00 AM to 4:59 AM | 122 (3.5%) | 15 (0.4%) |
| 5:00 AM to 5:29 AM | 203 (5.8%) | 25 (0.6%) |
| 5:30 AM to 5:59 AM | 76 (2.2%) | 125 (3.2%) |
| 6:00 AM to 6:29 AM | 68 (1.9%) | 218 (5.5%) |
| 6:30 AM to 6:59 AM | 456 (13.0%) | 487 (12.4%) |
| 7:00 AM to 7:29 AM | 410 (11.6%) | 621 (15.8%) |
| 7:30 AM to 7:59 AM | 728 (20.7%) | 858 (21.8%) |
| 8:00 AM to 8:29 AM | 482 (13.7%) | 525 (13.4%) |
| 8:30 AM to 8:59 AM | 340 (9.7%) | 206 (5.2%) |
| 9:00 AM to 9:59 AM | 106 (3.0%) | 257 (6.5%) |
| 10:00 AM to 10:59 AM | 150 (4.3%) | 262 (6.7%) |
| 11:00 AM to 11:59 AM | 20 (0.6%) | 29 (0.7%) |
| 12:00 PM to 3:59 PM | 297 (8.4%) | 116 (2.9%) |
| 4:00 PM to 11:59 PM | 63 (1.8%) | 188 (4.8%) |
| Total | 3,521 (100.0%) | 3,932 (100.0%) |
Housing Occupancy in Foley
Occupancy by Ownership in Foley
Of the total 9,713 dwellings in Foley, owner-occupied units account for 7,107 (73.2%), while renter-occupied units make up 2,606 (26.8%).
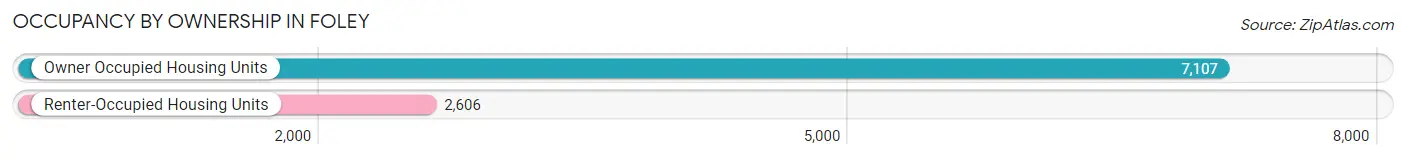
| Occupancy | # Housing Units | % Housing Units |
| Owner Occupied Housing Units | 7,107 | 73.2% |
| Renter-Occupied Housing Units | 2,606 | 26.8% |
| Total Occupied Housing Units | 9,713 | 100.0% |
Occupancy by Household Size in Foley
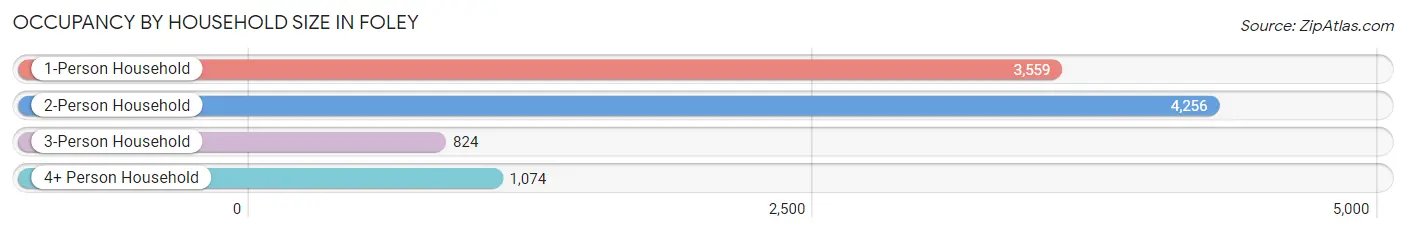
| Household Size | # Housing Units | % Housing Units |
| 1-Person Household | 3,559 | 36.6% |
| 2-Person Household | 4,256 | 43.8% |
| 3-Person Household | 824 | 8.5% |
| 4+ Person Household | 1,074 | 11.1% |
| Total Housing Units | 9,713 | 100.0% |
Occupancy by Ownership by Household Size in Foley
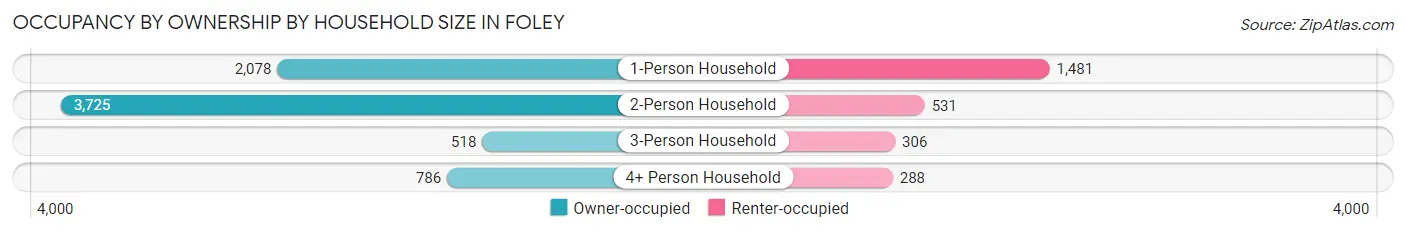
| Household Size | Owner-occupied | Renter-occupied |
| 1-Person Household | 2,078 (58.4%) | 1,481 (41.6%) |
| 2-Person Household | 3,725 (87.5%) | 531 (12.5%) |
| 3-Person Household | 518 (62.9%) | 306 (37.1%) |
| 4+ Person Household | 786 (73.2%) | 288 (26.8%) |
| Total Housing Units | 7,107 (73.2%) | 2,606 (26.8%) |
Occupancy by Educational Attainment in Foley
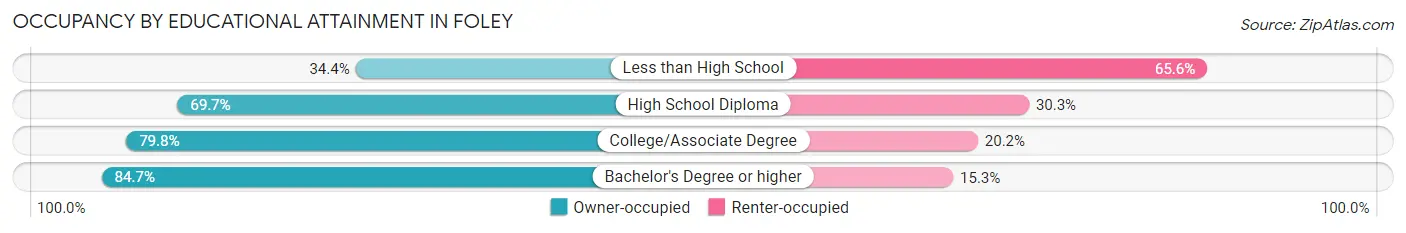
| Household Size | Owner-occupied | Renter-occupied |
| Less than High School | 345 (34.4%) | 658 (65.6%) |
| High School Diploma | 2,274 (69.7%) | 988 (30.3%) |
| College/Associate Degree | 2,095 (79.8%) | 529 (20.2%) |
| Bachelor's Degree or higher | 2,393 (84.7%) | 431 (15.3%) |
Occupancy by Age of Householder in Foley
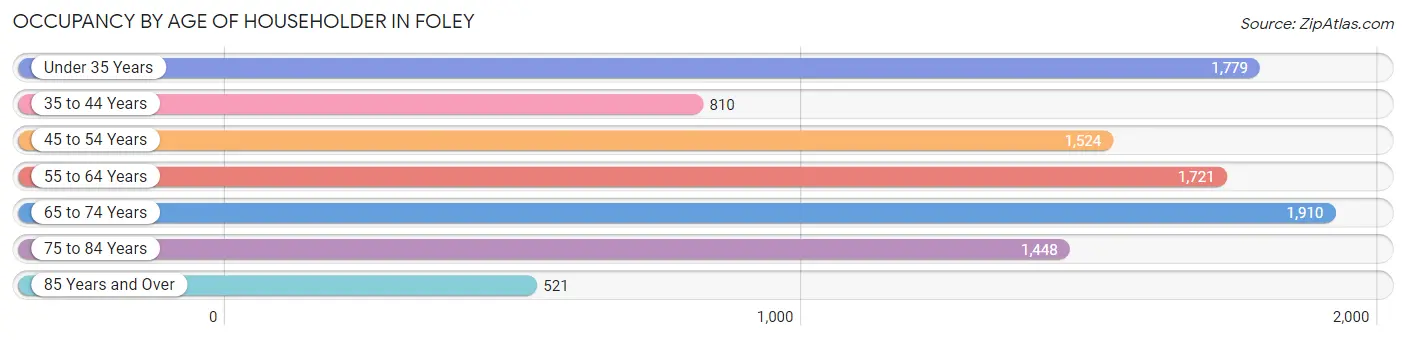
| Age Bracket | # Households | % Households |
| Under 35 Years | 1,779 | 18.3% |
| 35 to 44 Years | 810 | 8.3% |
| 45 to 54 Years | 1,524 | 15.7% |
| 55 to 64 Years | 1,721 | 17.7% |
| 65 to 74 Years | 1,910 | 19.7% |
| 75 to 84 Years | 1,448 | 14.9% |
| 85 Years and Over | 521 | 5.4% |
| Total | 9,713 | 100.0% |
Housing Finances in Foley
Median Income by Occupancy in Foley
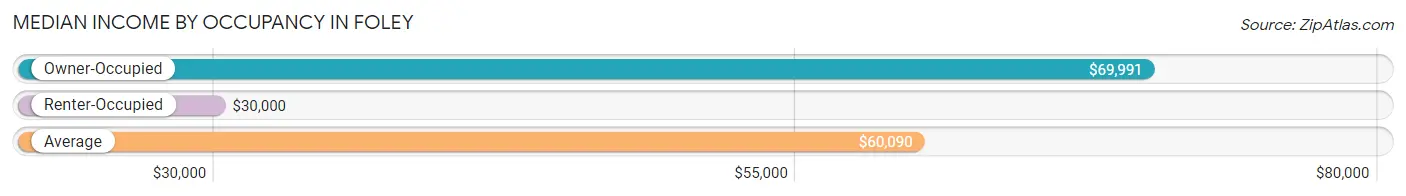
| Occupancy Type | # Households | Median Income |
| Owner-Occupied | 7,107 (73.2%) | $69,991 |
| Renter-Occupied | 2,606 (26.8%) | $30,000 |
| Average | 9,713 (100.0%) | $60,090 |
Occupancy by Householder Income Bracket in Foley
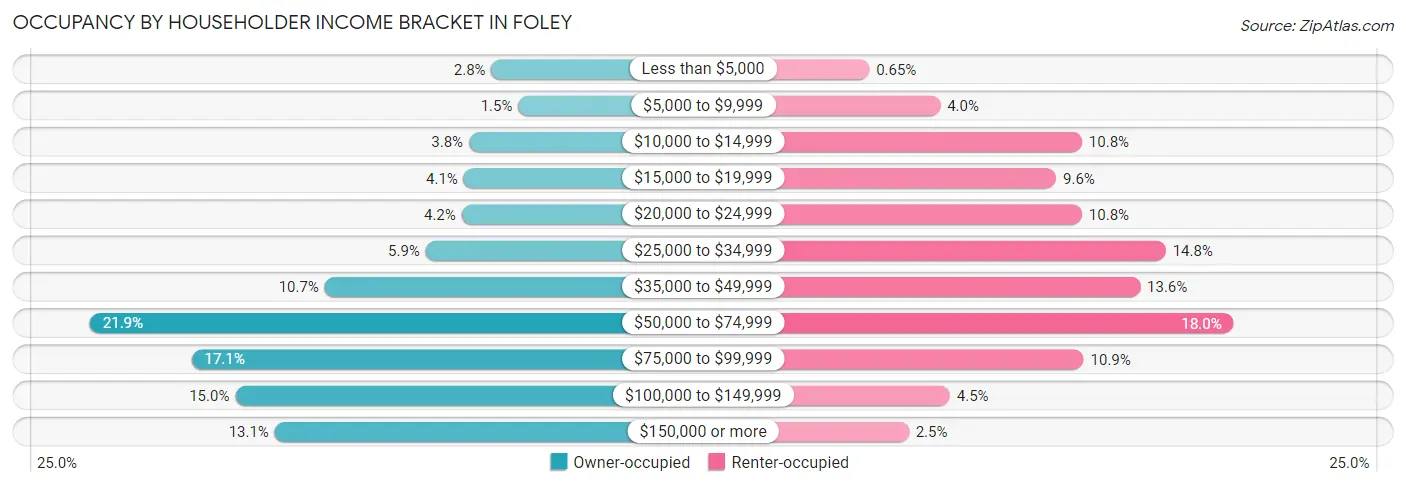
| Income Bracket | Owner-occupied | Renter-occupied |
| Less than $5,000 | 197 (2.8%) | 17 (0.6%) |
| $5,000 to $9,999 | 106 (1.5%) | 105 (4.0%) |
| $10,000 to $14,999 | 273 (3.8%) | 281 (10.8%) |
| $15,000 to $19,999 | 291 (4.1%) | 249 (9.6%) |
| $20,000 to $24,999 | 298 (4.2%) | 281 (10.8%) |
| $25,000 to $34,999 | 419 (5.9%) | 385 (14.8%) |
| $35,000 to $49,999 | 761 (10.7%) | 353 (13.6%) |
| $50,000 to $74,999 | 1,556 (21.9%) | 469 (18.0%) |
| $75,000 to $99,999 | 1,212 (17.1%) | 283 (10.9%) |
| $100,000 to $149,999 | 1,064 (15.0%) | 117 (4.5%) |
| $150,000 or more | 930 (13.1%) | 66 (2.5%) |
| Total | 7,107 (100.0%) | 2,606 (100.0%) |
Monthly Housing Cost Tiers in Foley
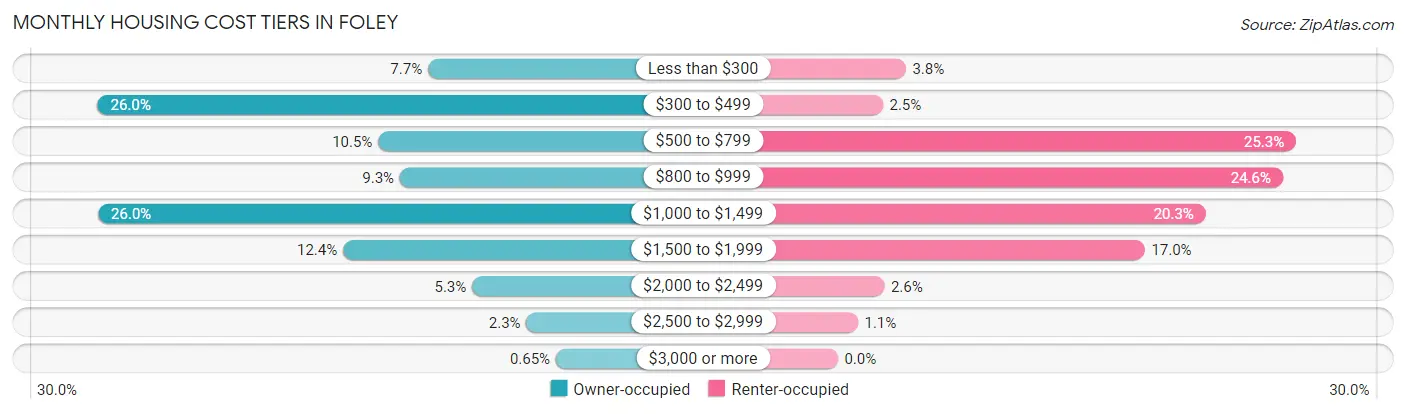
| Monthly Cost | Owner-occupied | Renter-occupied |
| Less than $300 | 549 (7.7%) | 98 (3.8%) |
| $300 to $499 | 1,846 (26.0%) | 65 (2.5%) |
| $500 to $799 | 744 (10.5%) | 660 (25.3%) |
| $800 to $999 | 659 (9.3%) | 641 (24.6%) |
| $1,000 to $1,499 | 1,844 (26.0%) | 530 (20.3%) |
| $1,500 to $1,999 | 882 (12.4%) | 442 (17.0%) |
| $2,000 to $2,499 | 375 (5.3%) | 67 (2.6%) |
| $2,500 to $2,999 | 162 (2.3%) | 29 (1.1%) |
| $3,000 or more | 46 (0.6%) | 0 (0.0%) |
| Total | 7,107 (100.0%) | 2,606 (100.0%) |
Physical Housing Characteristics in Foley
Housing Structures in Foley
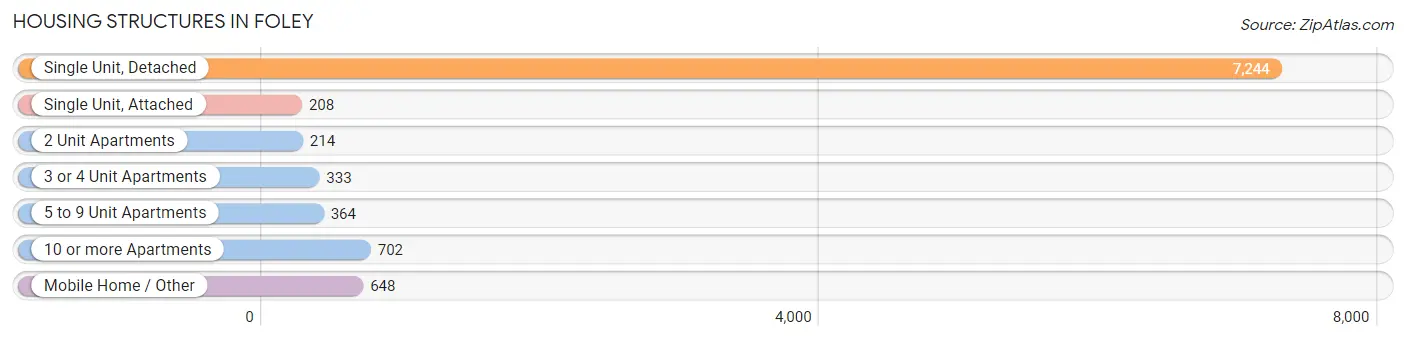
| Structure Type | # Housing Units | % Housing Units |
| Single Unit, Detached | 7,244 | 74.6% |
| Single Unit, Attached | 208 | 2.1% |
| 2 Unit Apartments | 214 | 2.2% |
| 3 or 4 Unit Apartments | 333 | 3.4% |
| 5 to 9 Unit Apartments | 364 | 3.7% |
| 10 or more Apartments | 702 | 7.2% |
| Mobile Home / Other | 648 | 6.7% |
| Total | 9,713 | 100.0% |
Housing Structures by Occupancy in Foley
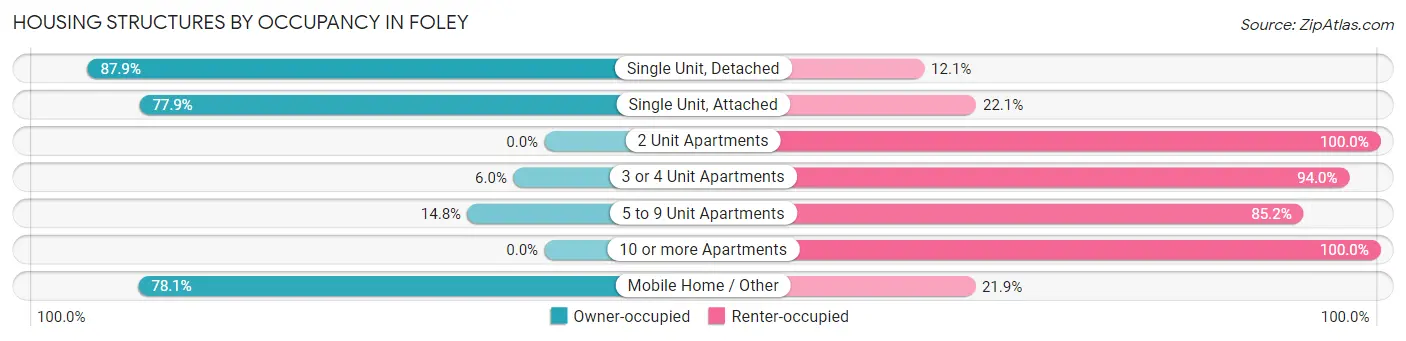
| Structure Type | Owner-occupied | Renter-occupied |
| Single Unit, Detached | 6,365 (87.9%) | 879 (12.1%) |
| Single Unit, Attached | 162 (77.9%) | 46 (22.1%) |
| 2 Unit Apartments | 0 (0.0%) | 214 (100.0%) |
| 3 or 4 Unit Apartments | 20 (6.0%) | 313 (94.0%) |
| 5 to 9 Unit Apartments | 54 (14.8%) | 310 (85.2%) |
| 10 or more Apartments | 0 (0.0%) | 702 (100.0%) |
| Mobile Home / Other | 506 (78.1%) | 142 (21.9%) |
| Total | 7,107 (73.2%) | 2,606 (26.8%) |
Housing Structures by Number of Rooms in Foley
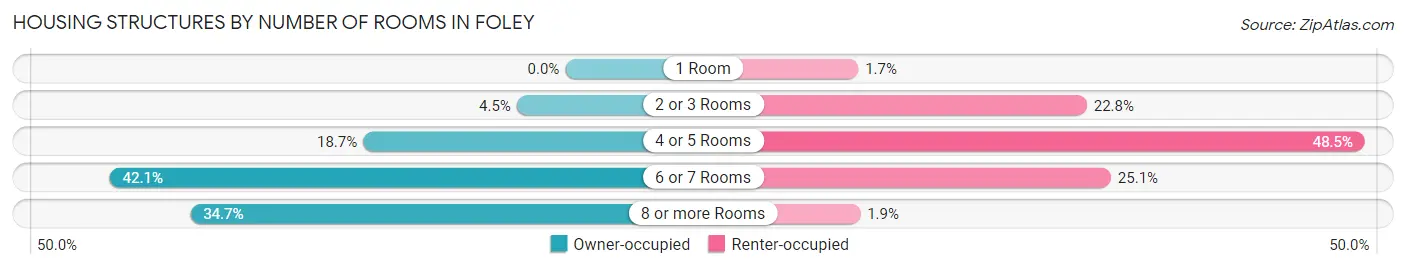
| Number of Rooms | Owner-occupied | Renter-occupied |
| 1 Room | 0 (0.0%) | 44 (1.7%) |
| 2 or 3 Rooms | 319 (4.5%) | 595 (22.8%) |
| 4 or 5 Rooms | 1,329 (18.7%) | 1,265 (48.5%) |
| 6 or 7 Rooms | 2,994 (42.1%) | 653 (25.1%) |
| 8 or more Rooms | 2,465 (34.7%) | 49 (1.9%) |
| Total | 7,107 (100.0%) | 2,606 (100.0%) |
Housing Structure by Heating Type in Foley
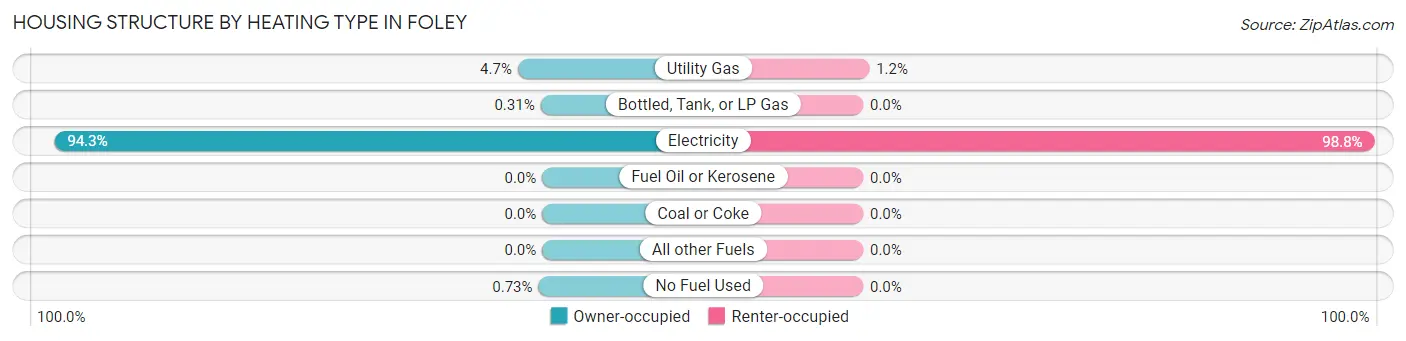
| Heating Type | Owner-occupied | Renter-occupied |
| Utility Gas | 335 (4.7%) | 31 (1.2%) |
| Bottled, Tank, or LP Gas | 22 (0.3%) | 0 (0.0%) |
| Electricity | 6,698 (94.3%) | 2,575 (98.8%) |
| Fuel Oil or Kerosene | 0 (0.0%) | 0 (0.0%) |
| Coal or Coke | 0 (0.0%) | 0 (0.0%) |
| All other Fuels | 0 (0.0%) | 0 (0.0%) |
| No Fuel Used | 52 (0.7%) | 0 (0.0%) |
| Total | 7,107 (100.0%) | 2,606 (100.0%) |
Household Vehicle Usage in Foley
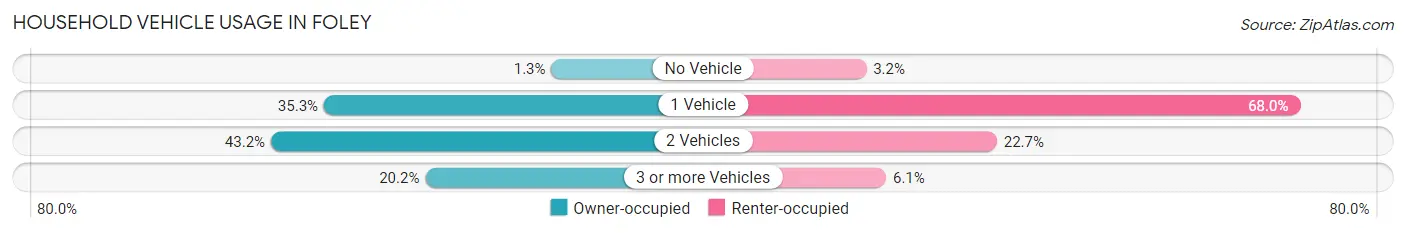
| Vehicles per Household | Owner-occupied | Renter-occupied |
| No Vehicle | 94 (1.3%) | 83 (3.2%) |
| 1 Vehicle | 2,509 (35.3%) | 1,772 (68.0%) |
| 2 Vehicles | 3,071 (43.2%) | 591 (22.7%) |
| 3 or more Vehicles | 1,433 (20.2%) | 160 (6.1%) |
| Total | 7,107 (100.0%) | 2,606 (100.0%) |
Real Estate & Mortgages in Foley
Real Estate and Mortgage Overview in Foley
| Characteristic | Without Mortgage | With Mortgage |
| Housing Units | 3,067 | 4,040 |
| Median Property Value | $246,600 | $231,300 |
| Median Household Income | $65,620 | $570 |
| Monthly Housing Costs | $425 | $46 |
| Real Estate Taxes | $713 | $589 |
Property Value by Mortgage Status in Foley
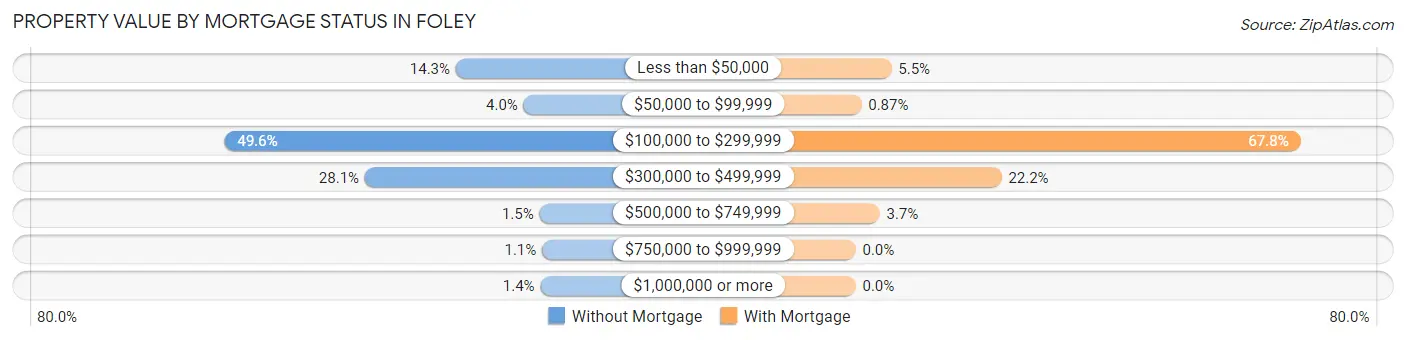
| Property Value | Without Mortgage | With Mortgage |
| Less than $50,000 | 438 (14.3%) | 220 (5.4%) |
| $50,000 to $99,999 | 121 (4.0%) | 35 (0.9%) |
| $100,000 to $299,999 | 1,520 (49.6%) | 2,739 (67.8%) |
| $300,000 to $499,999 | 863 (28.1%) | 898 (22.2%) |
| $500,000 to $749,999 | 47 (1.5%) | 148 (3.7%) |
| $750,000 to $999,999 | 35 (1.1%) | 0 (0.0%) |
| $1,000,000 or more | 43 (1.4%) | 0 (0.0%) |
| Total | 3,067 (100.0%) | 4,040 (100.0%) |
Household Income by Mortgage Status in Foley
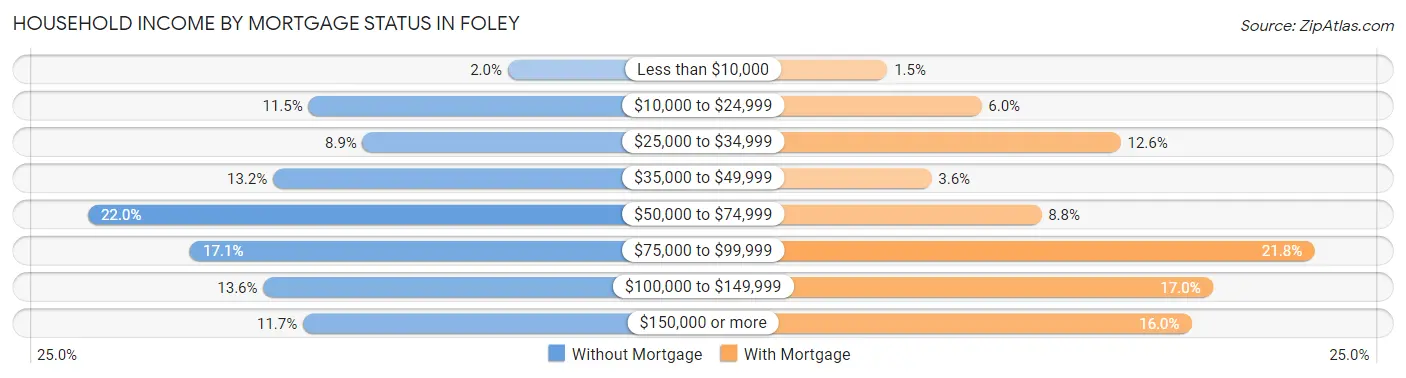
| Household Income | Without Mortgage | With Mortgage |
| Less than $10,000 | 61 (2.0%) | 61 (1.5%) |
| $10,000 to $24,999 | 352 (11.5%) | 242 (6.0%) |
| $25,000 to $34,999 | 273 (8.9%) | 510 (12.6%) |
| $35,000 to $49,999 | 404 (13.2%) | 146 (3.6%) |
| $50,000 to $74,999 | 674 (22.0%) | 357 (8.8%) |
| $75,000 to $99,999 | 525 (17.1%) | 882 (21.8%) |
| $100,000 to $149,999 | 418 (13.6%) | 687 (17.0%) |
| $150,000 or more | 360 (11.7%) | 646 (16.0%) |
| Total | 3,067 (100.0%) | 4,040 (100.0%) |
Property Value to Household Income Ratio in Foley
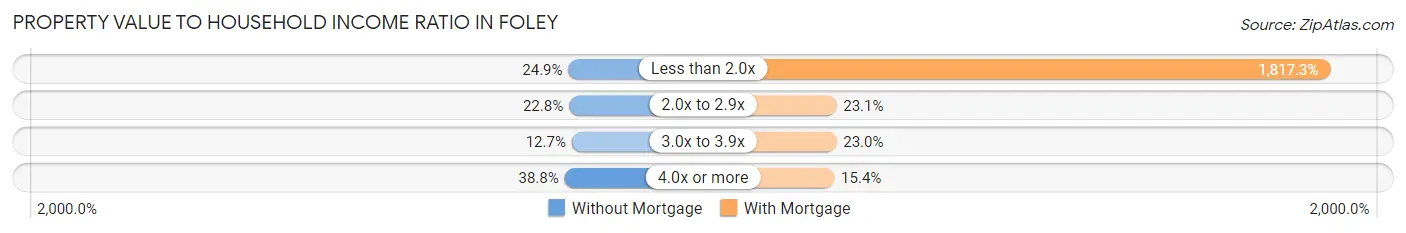
| Value-to-Income Ratio | Without Mortgage | With Mortgage |
| Less than 2.0x | 762 (24.8%) | 73,419 (1,817.3%) |
| 2.0x to 2.9x | 698 (22.8%) | 932 (23.1%) |
| 3.0x to 3.9x | 389 (12.7%) | 930 (23.0%) |
| 4.0x or more | 1,190 (38.8%) | 621 (15.4%) |
| Total | 3,067 (100.0%) | 4,040 (100.0%) |
Real Estate Taxes by Mortgage Status in Foley
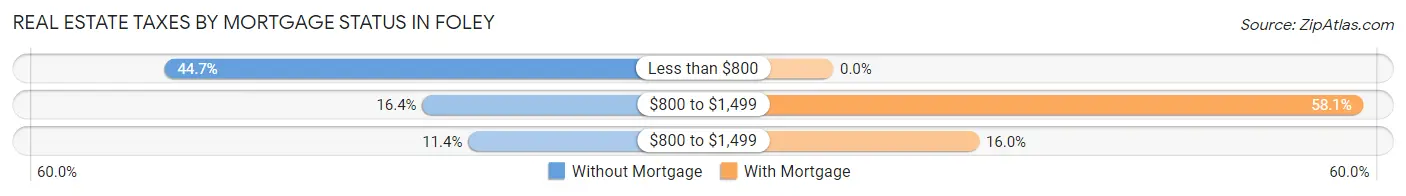
| Property Taxes | Without Mortgage | With Mortgage |
| Less than $800 | 1,370 (44.7%) | 0 (0.0%) |
| $800 to $1,499 | 503 (16.4%) | 2,349 (58.1%) |
| $800 to $1,499 | 349 (11.4%) | 646 (16.0%) |
| Total | 3,067 (100.0%) | 4,040 (100.0%) |
Health & Disability in Foley
Health Insurance Coverage by Age in Foley
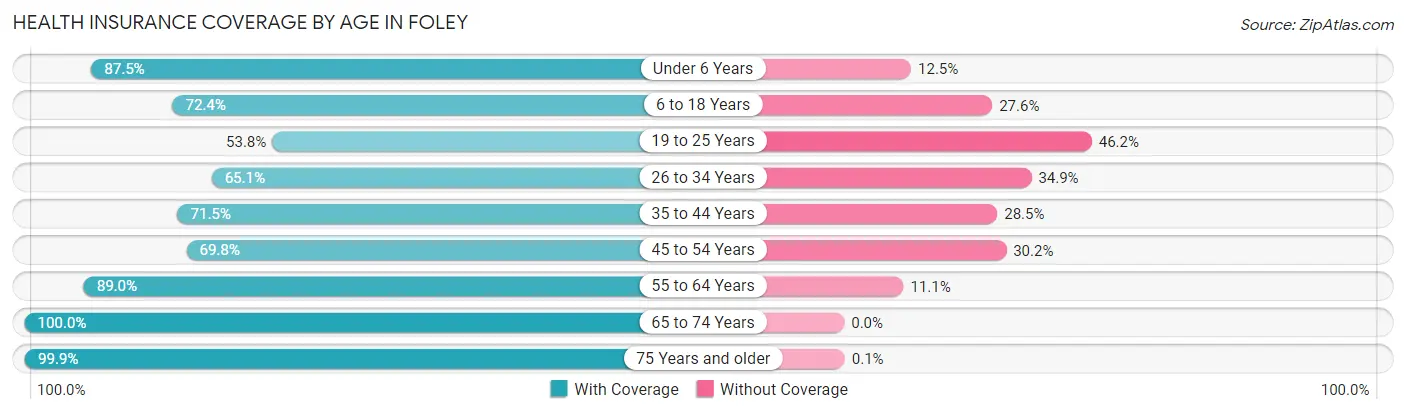
| Age Bracket | With Coverage | Without Coverage |
| Under 6 Years | 843 (87.5%) | 120 (12.5%) |
| 6 to 18 Years | 1,745 (72.4%) | 665 (27.6%) |
| 19 to 25 Years | 785 (53.8%) | 673 (46.2%) |
| 26 to 34 Years | 1,246 (65.1%) | 668 (34.9%) |
| 35 to 44 Years | 1,450 (71.5%) | 579 (28.5%) |
| 45 to 54 Years | 1,784 (69.8%) | 772 (30.2%) |
| 55 to 64 Years | 2,688 (88.9%) | 334 (11.1%) |
| 65 to 74 Years | 3,475 (100.0%) | 0 (0.0%) |
| 75 Years and older | 3,049 (99.9%) | 3 (0.1%) |
| Total | 17,065 (81.7%) | 3,814 (18.3%) |
Health Insurance Coverage by Citizenship Status in Foley
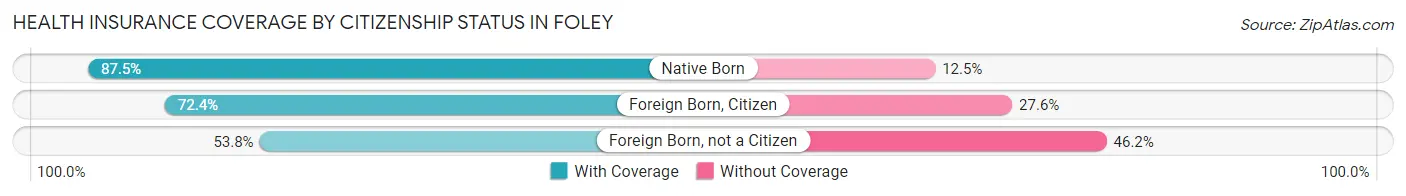
| Citizenship Status | With Coverage | Without Coverage |
| Native Born | 843 (87.5%) | 120 (12.5%) |
| Foreign Born, Citizen | 1,745 (72.4%) | 665 (27.6%) |
| Foreign Born, not a Citizen | 785 (53.8%) | 673 (46.2%) |
Health Insurance Coverage by Household Income in Foley
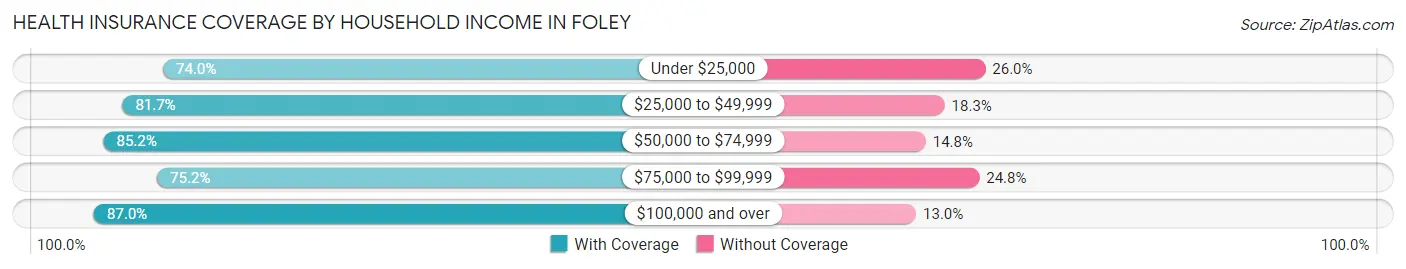
| Household Income | With Coverage | Without Coverage |
| Under $25,000 | 2,319 (74.0%) | 813 (26.0%) |
| $25,000 to $49,999 | 2,711 (81.7%) | 609 (18.3%) |
| $50,000 to $74,999 | 3,909 (85.2%) | 679 (14.8%) |
| $75,000 to $99,999 | 2,770 (75.2%) | 915 (24.8%) |
| $100,000 and over | 5,338 (87.0%) | 797 (13.0%) |
Public vs Private Health Insurance Coverage by Age in Foley
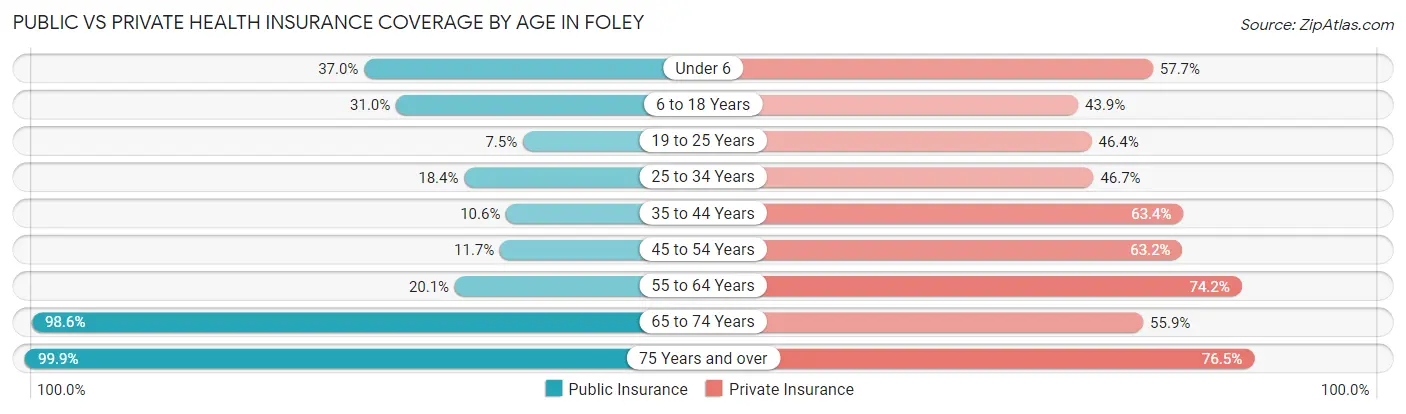
| Age Bracket | Public Insurance | Private Insurance |
| Under 6 | 356 (37.0%) | 556 (57.7%) |
| 6 to 18 Years | 748 (31.0%) | 1,057 (43.9%) |
| 19 to 25 Years | 109 (7.5%) | 676 (46.4%) |
| 25 to 34 Years | 352 (18.4%) | 894 (46.7%) |
| 35 to 44 Years | 215 (10.6%) | 1,286 (63.4%) |
| 45 to 54 Years | 300 (11.7%) | 1,616 (63.2%) |
| 55 to 64 Years | 608 (20.1%) | 2,242 (74.2%) |
| 65 to 74 Years | 3,427 (98.6%) | 1,944 (55.9%) |
| 75 Years and over | 3,049 (99.9%) | 2,335 (76.5%) |
| Total | 9,164 (43.9%) | 12,606 (60.4%) |
Disability Status by Sex by Age in Foley
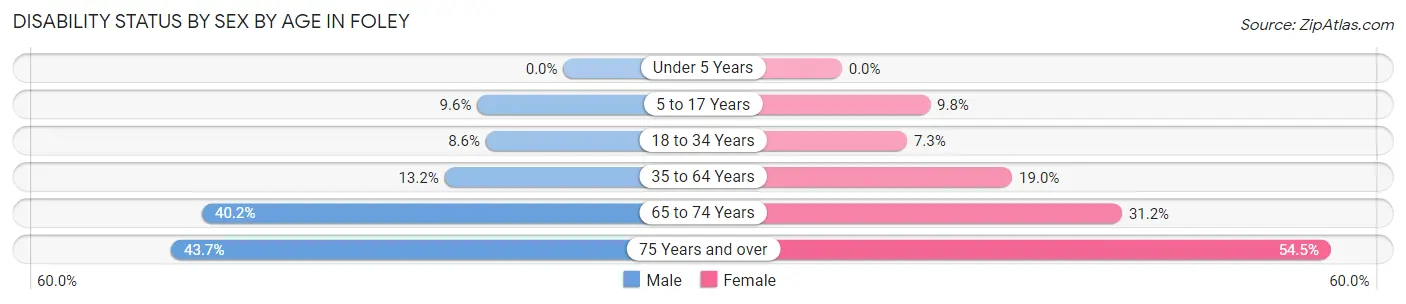
| Age Bracket | Male | Female |
| Under 5 Years | 0 (0.0%) | 0 (0.0%) |
| 5 to 17 Years | 130 (9.6%) | 141 (9.8%) |
| 18 to 34 Years | 150 (8.6%) | 121 (7.3%) |
| 35 to 64 Years | 430 (13.2%) | 827 (19.0%) |
| 65 to 74 Years | 587 (40.2%) | 629 (31.2%) |
| 75 Years and over | 636 (43.7%) | 869 (54.4%) |
Disability Class by Sex by Age in Foley
Disability Class: Hearing Difficulty
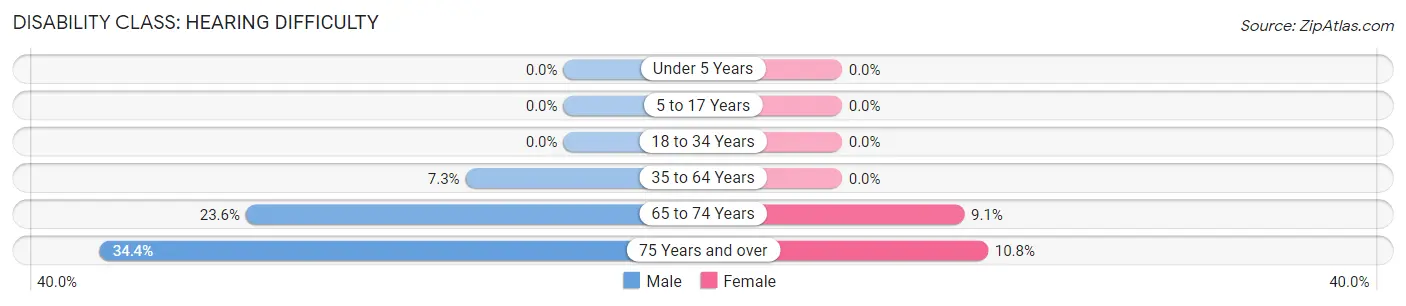
| Age Bracket | Male | Female |
| Under 5 Years | 0 (0.0%) | 0 (0.0%) |
| 5 to 17 Years | 0 (0.0%) | 0 (0.0%) |
| 18 to 34 Years | 0 (0.0%) | 0 (0.0%) |
| 35 to 64 Years | 236 (7.3%) | 0 (0.0%) |
| 65 to 74 Years | 344 (23.6%) | 183 (9.1%) |
| 75 Years and over | 501 (34.4%) | 173 (10.8%) |
Disability Class: Vision Difficulty
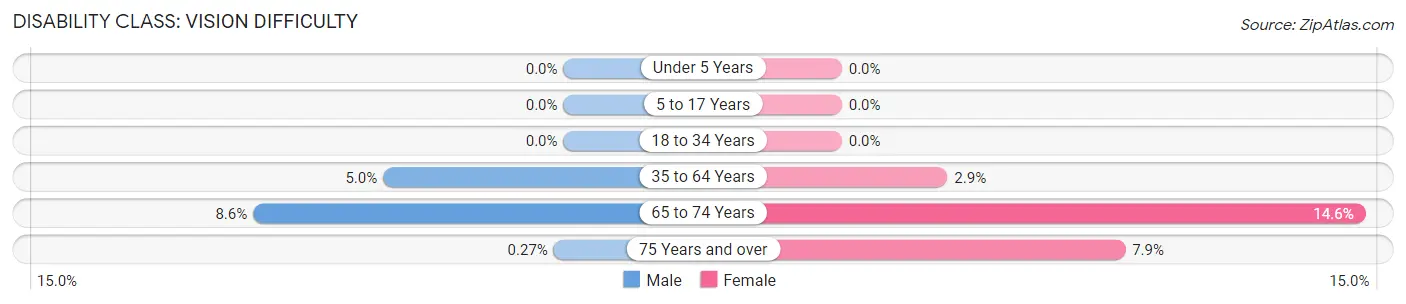
| Age Bracket | Male | Female |
| Under 5 Years | 0 (0.0%) | 0 (0.0%) |
| 5 to 17 Years | 0 (0.0%) | 0 (0.0%) |
| 18 to 34 Years | 0 (0.0%) | 0 (0.0%) |
| 35 to 64 Years | 163 (5.0%) | 128 (2.9%) |
| 65 to 74 Years | 126 (8.6%) | 294 (14.6%) |
| 75 Years and over | 4 (0.3%) | 126 (7.9%) |
Disability Class: Cognitive Difficulty
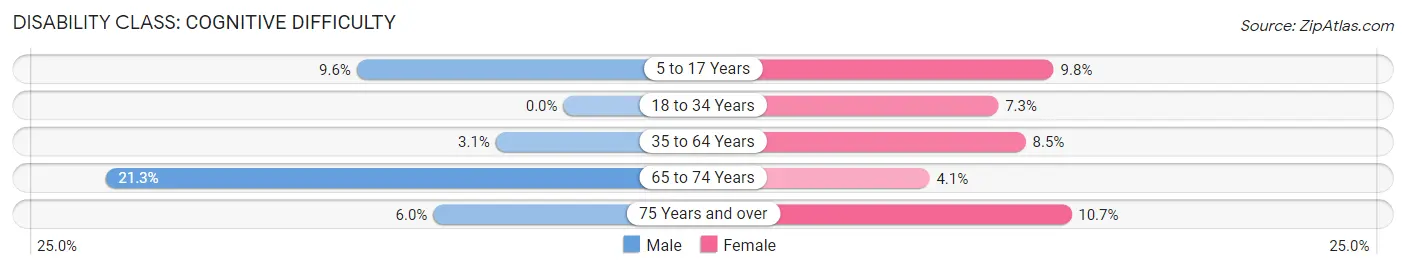
| Age Bracket | Male | Female |
| 5 to 17 Years | 130 (9.6%) | 141 (9.8%) |
| 18 to 34 Years | 0 (0.0%) | 121 (7.3%) |
| 35 to 64 Years | 102 (3.1%) | 372 (8.5%) |
| 65 to 74 Years | 310 (21.2%) | 82 (4.1%) |
| 75 Years and over | 88 (6.0%) | 170 (10.6%) |
Disability Class: Ambulatory Difficulty
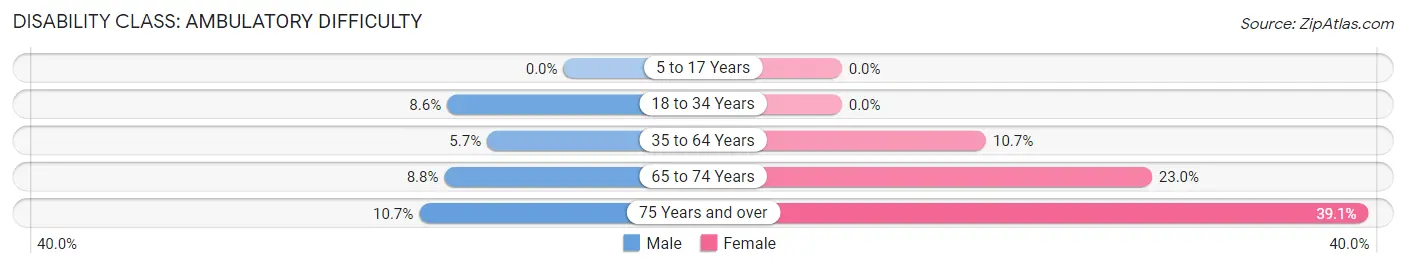
| Age Bracket | Male | Female |
| 5 to 17 Years | 0 (0.0%) | 0 (0.0%) |
| 18 to 34 Years | 150 (8.6%) | 0 (0.0%) |
| 35 to 64 Years | 184 (5.7%) | 467 (10.7%) |
| 65 to 74 Years | 129 (8.8%) | 464 (23.0%) |
| 75 Years and over | 156 (10.7%) | 624 (39.1%) |
Disability Class: Self-Care Difficulty
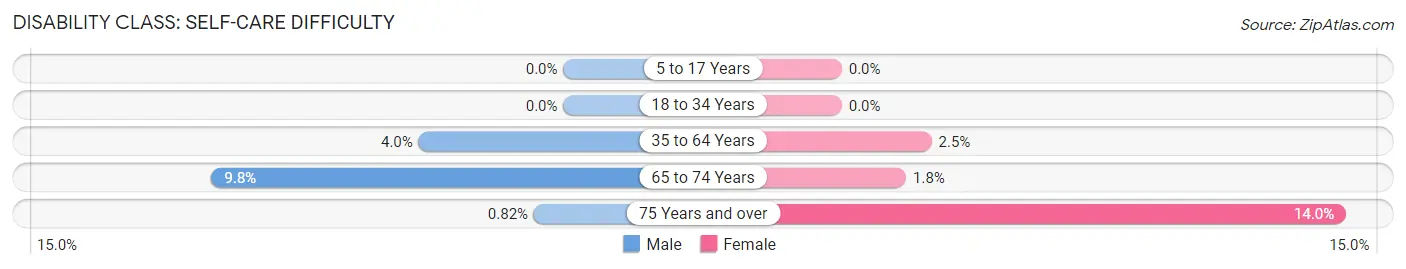
| Age Bracket | Male | Female |
| 5 to 17 Years | 0 (0.0%) | 0 (0.0%) |
| 18 to 34 Years | 0 (0.0%) | 0 (0.0%) |
| 35 to 64 Years | 131 (4.0%) | 109 (2.5%) |
| 65 to 74 Years | 143 (9.8%) | 36 (1.8%) |
| 75 Years and over | 12 (0.8%) | 224 (14.0%) |
Technology Access in Foley
Computing Device Access in Foley
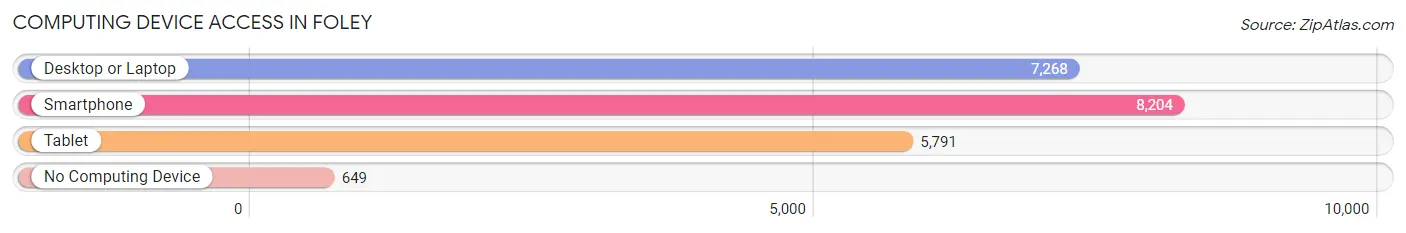
| Device Type | # Households | % Households |
| Desktop or Laptop | 7,268 | 74.8% |
| Smartphone | 8,204 | 84.5% |
| Tablet | 5,791 | 59.6% |
| No Computing Device | 649 | 6.7% |
| Total | 9,713 | 100.0% |
Internet Access in Foley
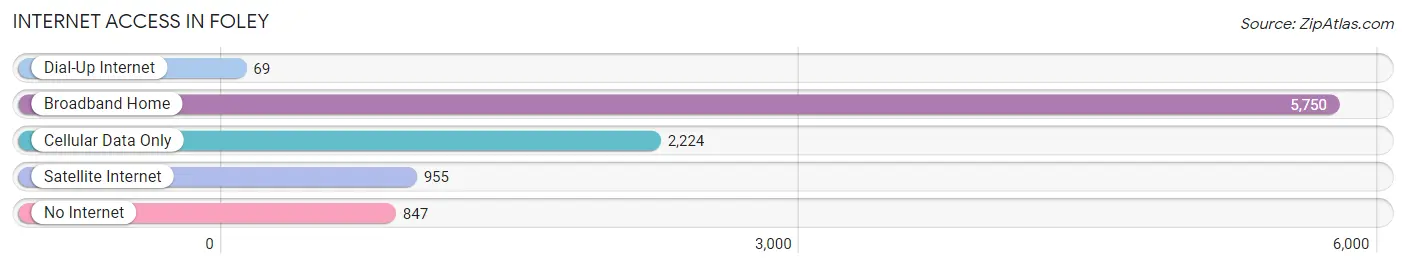
| Internet Type | # Households | % Households |
| Dial-Up Internet | 69 | 0.7% |
| Broadband Home | 5,750 | 59.2% |
| Cellular Data Only | 2,224 | 22.9% |
| Satellite Internet | 955 | 9.8% |
| No Internet | 847 | 8.7% |
| Total | 9,713 | 100.0% |
Foley Summary
Foley, Alabama is a city located in Baldwin County, Alabama, United States. It is situated along the Gulf Coast, approximately 40 miles east of Mobile and 25 miles west of Pensacola, Florida. The city is part of the Daphne-Fairhope-Foley metropolitan area, which has a population of over 200,000.
History
Foley was founded in 1905 by John B. Foley, a railroad engineer from Chicago. He purchased land in the area and began to develop it into a town. The town was named after him and incorporated in 1915.
Foley was a small farming community until the 1950s, when it began to experience rapid growth due to the development of the nearby beaches and resorts. The city was also home to a large paper mill, which provided jobs for many of the residents.
In the late 1970s, Foley began to experience a decline in population due to the closure of the paper mill and the decline of the local economy. However, in the 1990s, the city began to experience a resurgence due to the development of the nearby beaches and resorts.
Geography
Foley is located in Baldwin County, Alabama, along the Gulf Coast. It is situated approximately 40 miles east of Mobile and 25 miles west of Pensacola, Florida. The city is part of the Daphne-Fairhope-Foley metropolitan area, which has a population of over 200,000.
The city has a total area of 16.2 square miles, of which 15.9 square miles is land and 0.3 square miles is water. The city is located at an elevation of 30 feet above sea level.
Economy
Foley’s economy is largely based on tourism and retail. The city is home to several large retail stores, including Walmart, Target, and Lowe’s. The city is also home to several large resorts and hotels, which attract tourists from all over the world.
The city is also home to several manufacturing companies, including Gulf Coast Paper Company, which produces paper products, and Foley Products, which produces plastic products.
Demographics
As of the 2010 census, Foley had a population of 14,618. The racial makeup of the city was 79.2% White, 15.3% African American, 0.5% Native American, 1.2% Asian, 0.1% Pacific Islander, 1.7% from other races, and 2.1% from two or more races. Hispanic or Latino of any race were 4.2% of the population.
The median income for a household in the city was $41,945, and the median income for a family was $50,945. The per capita income for the city was $21,945. About 11.2% of families and 14.2% of the population were below the poverty line, including 19.2% of those under age 18 and 8.2% of those age 65 or over.
Common Questions
What is Per Capita Income in Foley?
Per Capita income in Foley is $33,427.
What is the Median Family Income in Foley?
Median Family Income in Foley is $76,073.
What is the Median Household income in Foley?
Median Household Income in Foley is $60,090.
What is Income or Wage Gap in Foley?
Income or Wage Gap in Foley is 25.5%.
Women in Foley earn 74.5 cents for every dollar earned by a man.
What is Inequality or Gini Index in Foley?
Inequality or Gini Index in Foley is 0.42.
What is the Total Population of Foley?
Total Population of Foley is 21,113.
What is the Total Male Population of Foley?
Total Male Population of Foley is 9,715.
What is the Total Female Population of Foley?
Total Female Population of Foley is 11,398.
What is the Ratio of Males per 100 Females in Foley?
There are 85.23 Males per 100 Females in Foley.
What is the Ratio of Females per 100 Males in Foley?
There are 117.32 Females per 100 Males in Foley.
What is the Median Population Age in Foley?
Median Population Age in Foley is 52.1 Years.
What is the Average Family Size in Foley
Average Family Size in Foley is 2.8 People.
What is the Average Household Size in Foley
Average Household Size in Foley is 2.1 People.
How Large is the Labor Force in Foley?
There are 8,869 People in the Labor Forcein in Foley.
What is the Percentage of People in the Labor Force in Foley?
48.3% of People are in the Labor Force in Foley.
What is the Unemployment Rate in Foley?
Unemployment Rate in Foley is 4.9%.