Meridianville, AL Map & Demographics
Meridianville Map
Meridianville Overview
$40,086
PER CAPITA INCOME
$104,323
AVG FAMILY INCOME
$92,443
AVG HOUSEHOLD INCOME
50.0%
WAGE / INCOME GAP [ % ]
50.0¢/ $1
WAGE / INCOME GAP [ $ ]
0.40
INEQUALITY / GINI INDEX
9,528
TOTAL POPULATION
4,519
MALE POPULATION
5,009
FEMALE POPULATION
90.22
MALES / 100 FEMALES
110.84
FEMALES / 100 MALES
38.8
MEDIAN AGE
3.2
AVG FAMILY SIZE
2.7
AVG HOUSEHOLD SIZE
5,051
LABOR FORCE [ PEOPLE ]
67.1%
PERCENT IN LABOR FORCE
7.2%
UNEMPLOYMENT RATE
Meridianville Zip Codes
Meridianville Area Codes
Income in Meridianville
Income Overview in Meridianville
Per Capita Income in Meridianville is $40,086, while median incomes of families and households are $104,323 and $92,443 respectively.
| Characteristic | Number | Measure |
| Per Capita Income | 9,528 | $40,086 |
| Median Family Income | 2,643 | $104,323 |
| Mean Family Income | 2,643 | $127,827 |
| Median Household Income | 3,496 | $92,443 |
| Mean Household Income | 3,496 | $109,091 |
| Income Deficit | 2,643 | $0 |
| Wage / Income Gap (%) | 9,528 | 50.01% |
| Wage / Income Gap ($) | 9,528 | 49.99¢ per $1 |
| Gini / Inequality Index | 9,528 | 0.40 |
Earnings by Sex in Meridianville
Average Earnings in Meridianville are $57,984, $73,512 for men and $36,752 for women, a difference of 50.0%.
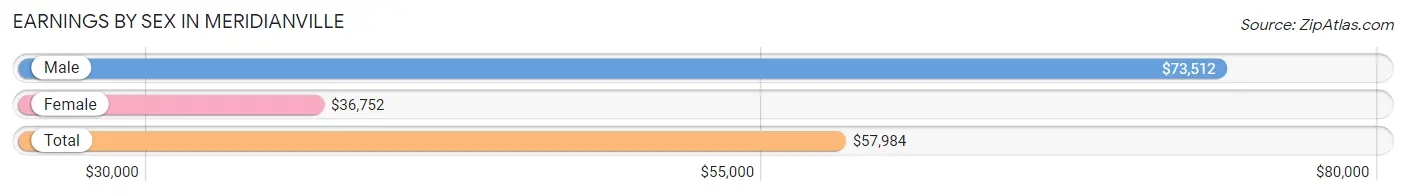
| Sex | Number | Average Earnings |
| Male | 2,307 (47.2%) | $73,512 |
| Female | 2,583 (52.8%) | $36,752 |
| Total | 4,890 (100.0%) | $57,984 |
Earnings by Sex by Income Bracket in Meridianville
The most common earnings brackets in Meridianville are $100,000+ for men (825 | 35.8%) and $100,000+ for women (319 | 12.3%).
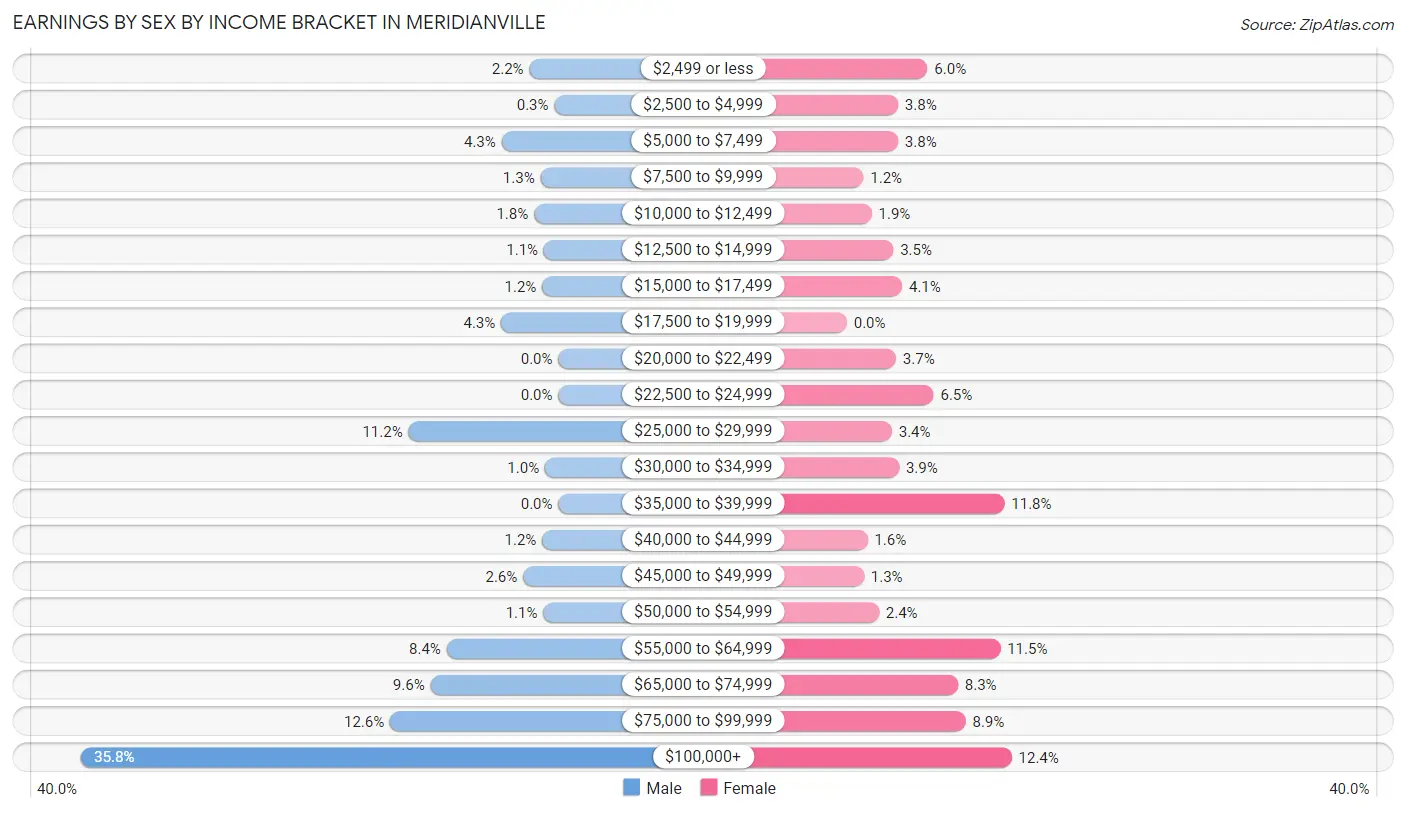
| Income | Male | Female |
| $2,499 or less | 50 (2.2%) | 156 (6.0%) |
| $2,500 to $4,999 | 7 (0.3%) | 99 (3.8%) |
| $5,000 to $7,499 | 98 (4.3%) | 99 (3.8%) |
| $7,500 to $9,999 | 31 (1.3%) | 32 (1.2%) |
| $10,000 to $12,499 | 42 (1.8%) | 48 (1.9%) |
| $12,500 to $14,999 | 25 (1.1%) | 90 (3.5%) |
| $15,000 to $17,499 | 28 (1.2%) | 107 (4.1%) |
| $17,500 to $19,999 | 99 (4.3%) | 0 (0.0%) |
| $20,000 to $22,499 | 0 (0.0%) | 95 (3.7%) |
| $22,500 to $24,999 | 0 (0.0%) | 168 (6.5%) |
| $25,000 to $29,999 | 259 (11.2%) | 87 (3.4%) |
| $30,000 to $34,999 | 23 (1.0%) | 101 (3.9%) |
| $35,000 to $39,999 | 0 (0.0%) | 305 (11.8%) |
| $40,000 to $44,999 | 28 (1.2%) | 40 (1.5%) |
| $45,000 to $49,999 | 61 (2.6%) | 33 (1.3%) |
| $50,000 to $54,999 | 26 (1.1%) | 62 (2.4%) |
| $55,000 to $64,999 | 193 (8.4%) | 297 (11.5%) |
| $65,000 to $74,999 | 221 (9.6%) | 215 (8.3%) |
| $75,000 to $99,999 | 291 (12.6%) | 230 (8.9%) |
| $100,000+ | 825 (35.8%) | 319 (12.3%) |
| Total | 2,307 (100.0%) | 2,583 (100.0%) |
Earnings by Sex by Educational Attainment in Meridianville
Average earnings in Meridianville are $86,574 for men and $47,765 for women, a difference of 44.8%. Men with an educational attainment of graduate degree enjoy the highest average annual earnings of $135,156, while those with less than high school education earn the least with $26,798. Women with an educational attainment of graduate degree earn the most with the average annual earnings of $71,232, while those with college or associate's degree education have the smallest earnings of $35,615.
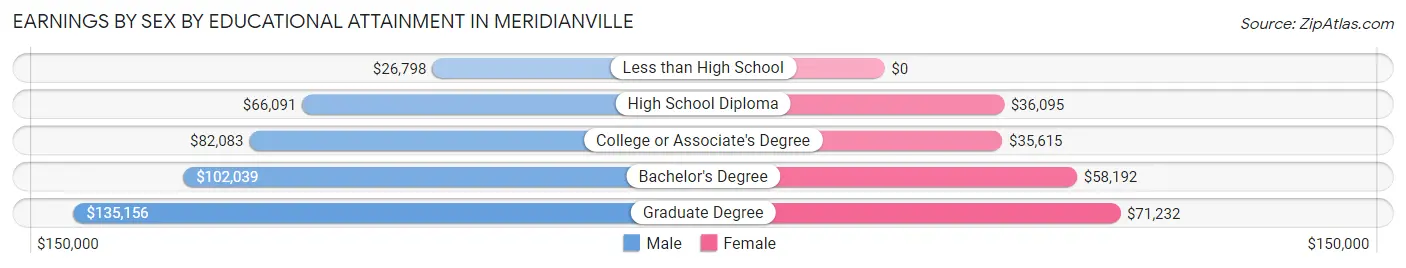
| Educational Attainment | Male Income | Female Income |
| Less than High School | $26,798 | $0 |
| High School Diploma | $66,091 | $36,095 |
| College or Associate's Degree | $82,083 | $35,615 |
| Bachelor's Degree | $102,039 | $58,192 |
| Graduate Degree | $135,156 | $71,232 |
| Total | $86,574 | $47,765 |
Family Income in Meridianville
Family Income Brackets in Meridianville
According to the Meridianville family income data, there are 634 families falling into the $100,000 to $149,999 income range, which is the most common income bracket and makes up 24.0% of all families. Conversely, the less than $10,000 income bracket is the least frequent group with only 21 families (0.8%) belonging to this category.
| Income Bracket | # Families | % Families |
| Less than $10,000 | 21 | 0.8% |
| $10,000 to $14,999 | 24 | 0.9% |
| $15,000 to $24,999 | 45 | 1.7% |
| $25,000 to $34,999 | 100 | 3.8% |
| $35,000 to $49,999 | 148 | 5.6% |
| $50,000 to $74,999 | 404 | 15.3% |
| $75,000 to $99,999 | 494 | 18.7% |
| $100,000 to $149,999 | 634 | 24.0% |
| $150,000 to $199,999 | 301 | 11.4% |
| $200,000+ | 476 | 18.0% |
Family Income by Famaliy Size in Meridianville
5-person families (315 | 11.9%) account for the highest median family income in Meridianville with $184,193 per family, while 2-person families (1,193 | 45.1%) have the highest median income of $43,238 per family member.
| Income Bracket | # Families | Median Income |
| 2-Person Families | 1,193 (45.1%) | $86,477 |
| 3-Person Families | 495 (18.7%) | $124,837 |
| 4-Person Families | 484 (18.3%) | $134,000 |
| 5-Person Families | 315 (11.9%) | $184,193 |
| 6-Person Families | 129 (4.9%) | $108,125 |
| 7+ Person Families | 27 (1.0%) | $0 |
| Total | 2,643 (100.0%) | $104,323 |
Family Income by Number of Earners in Meridianville
The median family income in Meridianville is $104,323, with families comprising 3+ earners (343) having the highest median family income of $142,361, while families with 1 earner (617) have the lowest median family income of $73,956, accounting for 13.0% and 23.3% of families, respectively.
| Number of Earners | # Families | Median Income |
| No Earners | 424 (16.0%) | $78,333 |
| 1 Earner | 617 (23.3%) | $73,956 |
| 2 Earners | 1,259 (47.6%) | $138,813 |
| 3+ Earners | 343 (13.0%) | $142,361 |
| Total | 2,643 (100.0%) | $104,323 |
Household Income in Meridianville
Household Income Brackets in Meridianville
With 713 households falling in the category, the $100,000 to $149,999 income range is the most frequent in Meridianville, accounting for 20.4% of all households. In contrast, only 91 households (2.6%) fall into the less than $10,000 income bracket, making it the least populous group.
| Income Bracket | # Households | % Households |
| Less than $10,000 | 91 | 2.6% |
| $10,000 to $14,999 | 122 | 3.5% |
| $15,000 to $24,999 | 189 | 5.4% |
| $25,000 to $34,999 | 350 | 10.0% |
| $35,000 to $49,999 | 192 | 5.5% |
| $50,000 to $74,999 | 440 | 12.6% |
| $75,000 to $99,999 | 549 | 15.7% |
| $100,000 to $149,999 | 713 | 20.4% |
| $150,000 to $199,999 | 374 | 10.7% |
| $200,000+ | 475 | 13.6% |
Household Income by Householder Age in Meridianville
The median household income in Meridianville is $92,443, with the highest median household income of $128,611 found in the 25 to 44 years age bracket for the primary householder. A total of 1,010 households (28.9%) fall into this category.
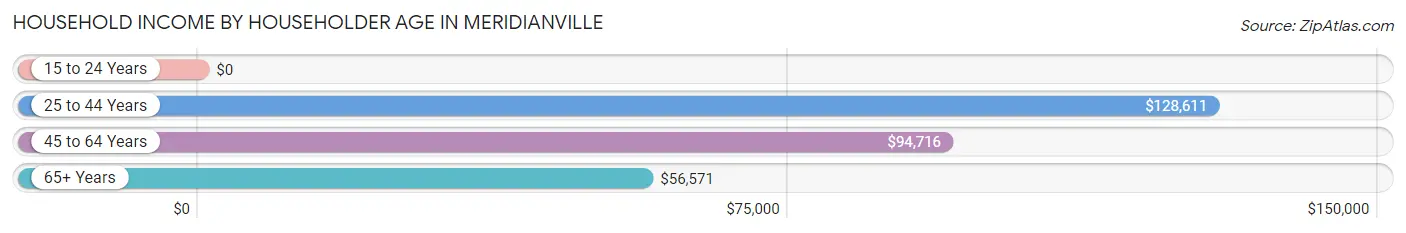
| Income Bracket | # Households | Median Income |
| 15 to 24 Years | 0 (0.0%) | $0 |
| 25 to 44 Years | 1,010 (28.9%) | $128,611 |
| 45 to 64 Years | 1,700 (48.6%) | $94,716 |
| 65+ Years | 786 (22.5%) | $56,571 |
| Total | 3,496 (100.0%) | $92,443 |
Poverty in Meridianville
Income Below Poverty by Sex and Age in Meridianville
With 5.1% poverty level for males and 4.6% for females among the residents of Meridianville, 16 and 17 year old males and 75 year old and over females are the most vulnerable to poverty, with 25 males (24.5%) and 84 females (18.9%) in their respective age groups living below the poverty level.
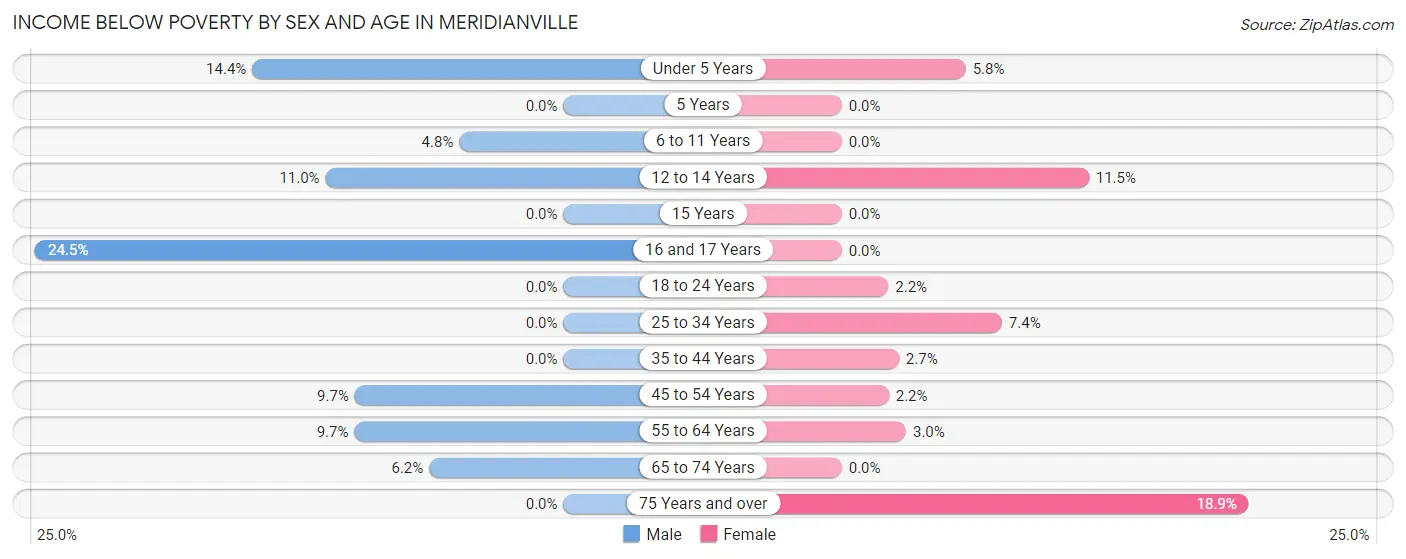
| Age Bracket | Male | Female |
| Under 5 Years | 26 (14.4%) | 21 (5.8%) |
| 5 Years | 0 (0.0%) | 0 (0.0%) |
| 6 to 11 Years | 25 (4.8%) | 0 (0.0%) |
| 12 to 14 Years | 18 (11.0%) | 22 (11.5%) |
| 15 Years | 0 (0.0%) | 0 (0.0%) |
| 16 and 17 Years | 25 (24.5%) | 0 (0.0%) |
| 18 to 24 Years | 0 (0.0%) | 6 (2.2%) |
| 25 to 34 Years | 0 (0.0%) | 35 (7.4%) |
| 35 to 44 Years | 0 (0.0%) | 21 (2.6%) |
| 45 to 54 Years | 48 (9.7%) | 20 (2.2%) |
| 55 to 64 Years | 68 (9.7%) | 21 (3.0%) |
| 65 to 74 Years | 21 (6.2%) | 0 (0.0%) |
| 75 Years and over | 0 (0.0%) | 84 (18.9%) |
| Total | 231 (5.1%) | 230 (4.6%) |
Income Above Poverty by Sex and Age in Meridianville
According to the poverty statistics in Meridianville, males aged 5 years and females aged 5 years are the age groups that are most secure financially, with 100.0% of males and 100.0% of females in these age groups living above the poverty line.
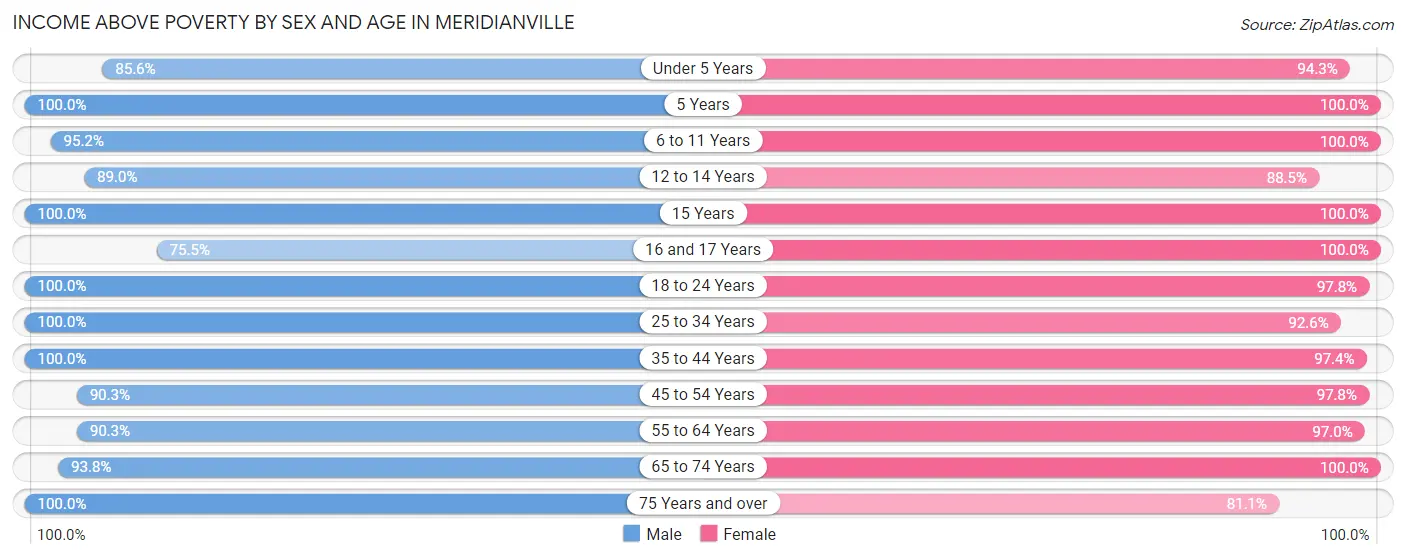
| Age Bracket | Male | Female |
| Under 5 Years | 154 (85.6%) | 344 (94.3%) |
| 5 Years | 69 (100.0%) | 28 (100.0%) |
| 6 to 11 Years | 493 (95.2%) | 328 (100.0%) |
| 12 to 14 Years | 145 (89.0%) | 170 (88.5%) |
| 15 Years | 108 (100.0%) | 50 (100.0%) |
| 16 and 17 Years | 77 (75.5%) | 140 (100.0%) |
| 18 to 24 Years | 421 (100.0%) | 272 (97.8%) |
| 25 to 34 Years | 695 (100.0%) | 436 (92.6%) |
| 35 to 44 Years | 577 (100.0%) | 772 (97.4%) |
| 45 to 54 Years | 448 (90.3%) | 896 (97.8%) |
| 55 to 64 Years | 633 (90.3%) | 683 (97.0%) |
| 65 to 74 Years | 316 (93.8%) | 299 (100.0%) |
| 75 Years and over | 152 (100.0%) | 361 (81.1%) |
| Total | 4,288 (94.9%) | 4,779 (95.4%) |
Income Below Poverty Among Married-Couple Families in Meridianville
The poverty statistics for married-couple families in Meridianville show that 2.2% or 44 of the total 1,998 families live below the poverty line. Families with 3 or 4 children have the highest poverty rate of 6.3%, comprising of 23 families. On the other hand, families with 1 or 2 children have the lowest poverty rate of 0.0%, which includes 0 families.
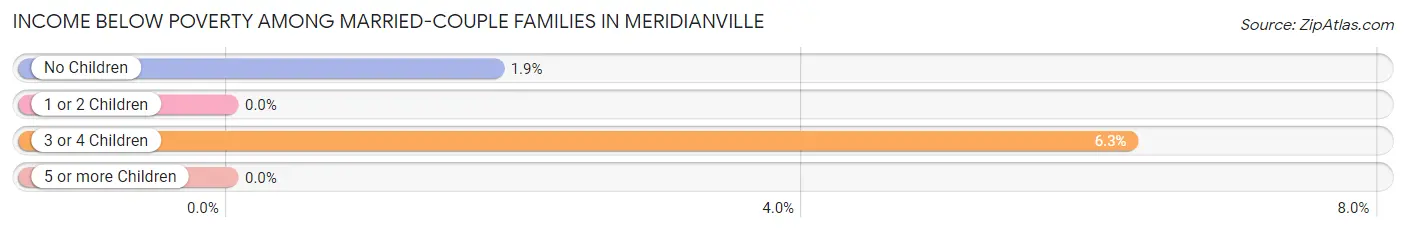
| Children | Above Poverty | Below Poverty |
| No Children | 1,116 (98.2%) | 21 (1.8%) |
| 1 or 2 Children | 467 (100.0%) | 0 (0.0%) |
| 3 or 4 Children | 344 (93.7%) | 23 (6.3%) |
| 5 or more Children | 27 (100.0%) | 0 (0.0%) |
| Total | 1,954 (97.8%) | 44 (2.2%) |
Income Below Poverty Among Single-Parent Households in Meridianville
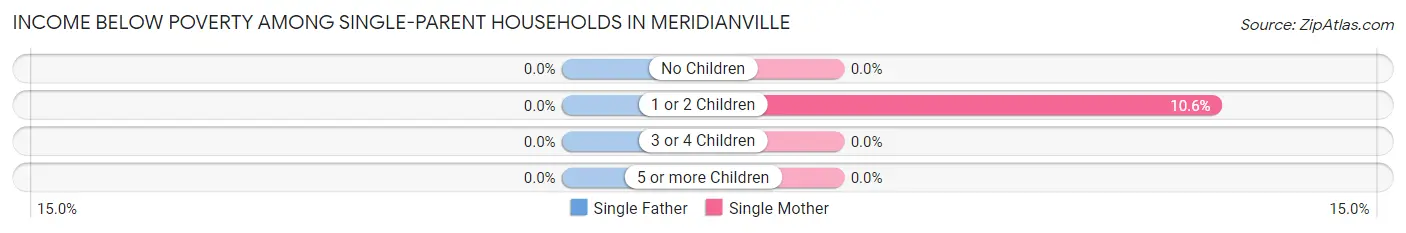
| Children | Single Father | Single Mother |
| No Children | 0 (0.0%) | 0 (0.0%) |
| 1 or 2 Children | 0 (0.0%) | 20 (10.6%) |
| 3 or 4 Children | 0 (0.0%) | 0 (0.0%) |
| 5 or more Children | 0 (0.0%) | 0 (0.0%) |
| Total | 0 (0.0%) | 20 (4.8%) |
Income Below Poverty Among Married-Couple vs Single-Parent Households in Meridianville
The poverty data for Meridianville shows that 44 of the married-couple family households (2.2%) and 20 of the single-parent households (3.1%) are living below the poverty level. Within the married-couple family households, those with 3 or 4 children have the highest poverty rate, with 23 households (6.3%) falling below the poverty line. Among the single-parent households, those with 1 or 2 children have the highest poverty rate, with 20 household (8.3%) living below poverty.
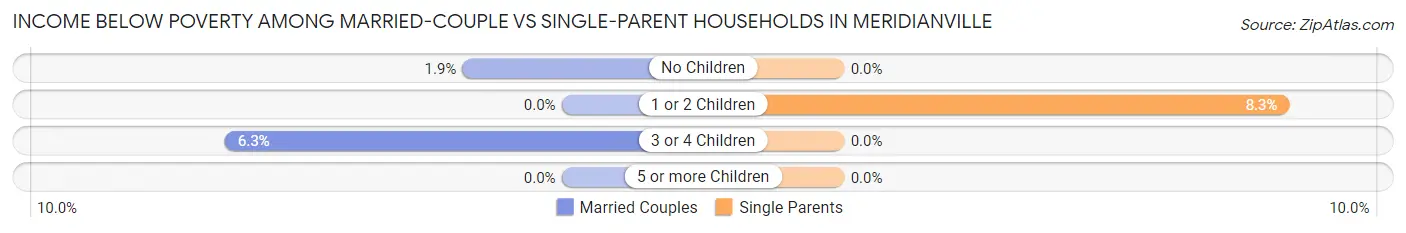
| Children | Married-Couple Families | Single-Parent Households |
| No Children | 21 (1.8%) | 0 (0.0%) |
| 1 or 2 Children | 0 (0.0%) | 20 (8.3%) |
| 3 or 4 Children | 23 (6.3%) | 0 (0.0%) |
| 5 or more Children | 0 (0.0%) | 0 (0.0%) |
| Total | 44 (2.2%) | 20 (3.1%) |
Race in Meridianville
The most populous races in Meridianville are White / Caucasian (5,247 | 55.1%), Black / African American (3,000 | 31.5%), and Two or more Races (494 | 5.2%).
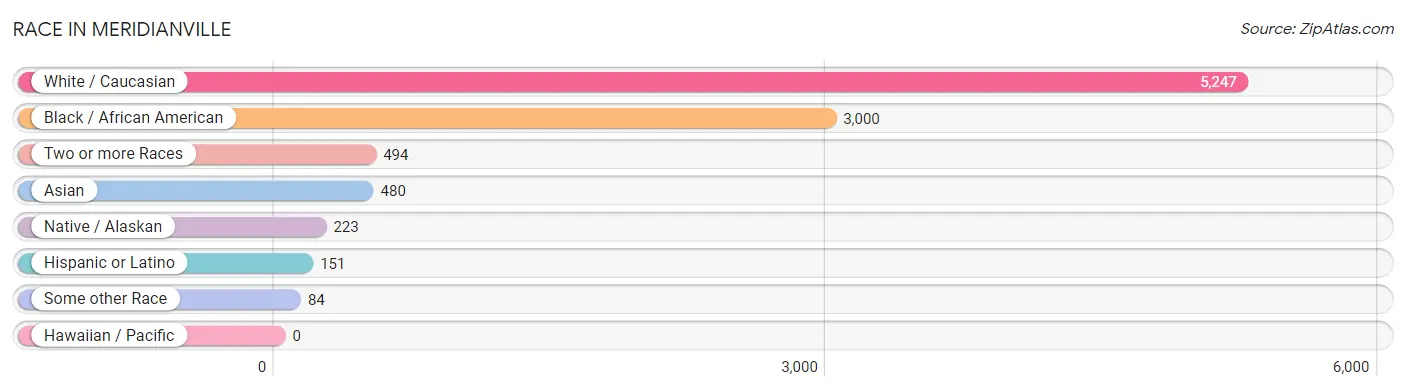
| Race | # Population | % Population |
| Asian | 480 | 5.0% |
| Black / African American | 3,000 | 31.5% |
| Hawaiian / Pacific | 0 | 0.0% |
| Hispanic or Latino | 151 | 1.6% |
| Native / Alaskan | 223 | 2.3% |
| White / Caucasian | 5,247 | 55.1% |
| Two or more Races | 494 | 5.2% |
| Some other Race | 84 | 0.9% |
| Total | 9,528 | 100.0% |
Ancestry in Meridianville
The most populous ancestries reported in Meridianville are Irish (1,186 | 12.4%), English (1,120 | 11.7%), German (1,010 | 10.6%), American (640 | 6.7%), and Indian (Asian) (320 | 3.4%), together accounting for 44.9% of all Meridianville residents.
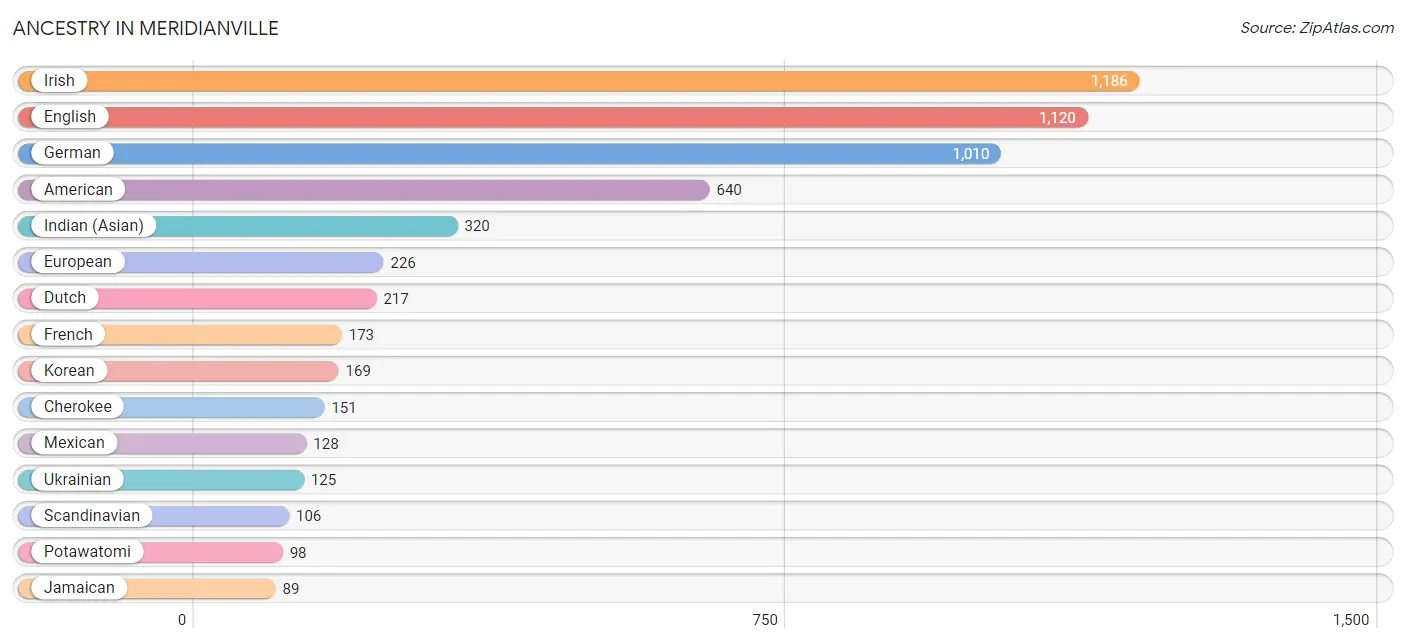
| Ancestry | # Population | % Population |
| American | 640 | 6.7% |
| Arab | 15 | 0.2% |
| British | 31 | 0.3% |
| Burmese | 9 | 0.1% |
| Central American | 23 | 0.2% |
| Cherokee | 151 | 1.6% |
| Dutch | 217 | 2.3% |
| English | 1,120 | 11.7% |
| European | 226 | 2.4% |
| French | 173 | 1.8% |
| French Canadian | 12 | 0.1% |
| German | 1,010 | 10.6% |
| Greek | 12 | 0.1% |
| Honduran | 23 | 0.2% |
| Indian (Asian) | 320 | 3.4% |
| Irish | 1,186 | 12.4% |
| Italian | 40 | 0.4% |
| Jamaican | 89 | 0.9% |
| Korean | 169 | 1.8% |
| Mexican | 128 | 1.3% |
| Norwegian | 36 | 0.4% |
| Polish | 48 | 0.5% |
| Potawatomi | 98 | 1.0% |
| Scandinavian | 106 | 1.1% |
| Scotch-Irish | 35 | 0.4% |
| Scottish | 59 | 0.6% |
| Swedish | 41 | 0.4% |
| Swiss | 22 | 0.2% |
| Thai | 86 | 0.9% |
| Ukrainian | 125 | 1.3% |
| Welsh | 28 | 0.3% | View All 31 Rows |
Immigrants in Meridianville
The most numerous immigrant groups reported in Meridianville came from Asia (240 | 2.5%), South Central Asia (120 | 1.3%), Europe (119 | 1.3%), Germany (87 | 0.9%), and Western Europe (87 | 0.9%), together accounting for 6.8% of all Meridianville residents.
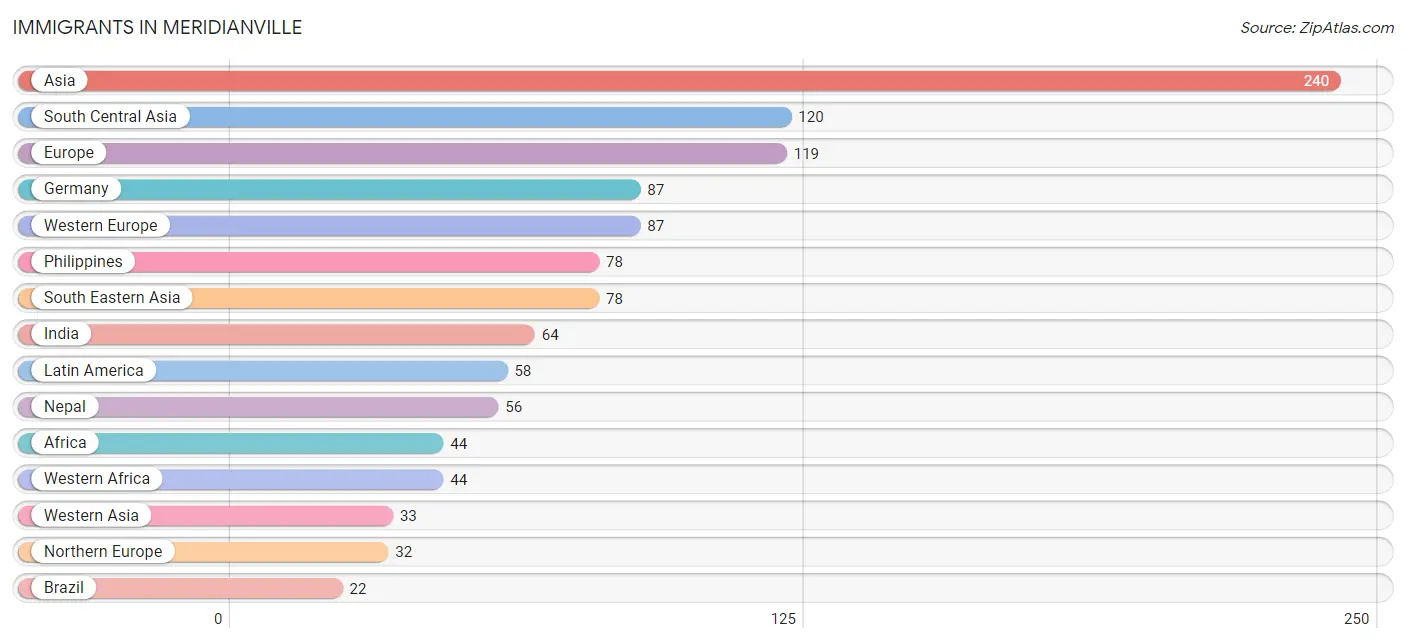
| Immigration Origin | # Population | % Population |
| Africa | 44 | 0.5% |
| Asia | 240 | 2.5% |
| Brazil | 22 | 0.2% |
| Caribbean | 21 | 0.2% |
| Central America | 15 | 0.2% |
| Eastern Asia | 9 | 0.1% |
| England | 16 | 0.2% |
| Europe | 119 | 1.3% |
| Germany | 87 | 0.9% |
| Honduras | 15 | 0.2% |
| India | 64 | 0.7% |
| Jamaica | 21 | 0.2% |
| Japan | 9 | 0.1% |
| Latin America | 58 | 0.6% |
| Nepal | 56 | 0.6% |
| Northern Europe | 32 | 0.3% |
| Philippines | 78 | 0.8% |
| South America | 22 | 0.2% |
| South Central Asia | 120 | 1.3% |
| South Eastern Asia | 78 | 0.8% |
| Western Africa | 44 | 0.5% |
| Western Asia | 33 | 0.4% |
| Western Europe | 87 | 0.9% | View All 23 Rows |
Sex and Age in Meridianville
Sex and Age in Meridianville
The most populous age groups in Meridianville are 30 to 34 Years (465 | 10.3%) for men and 35 to 39 Years (587 | 11.7%) for women.
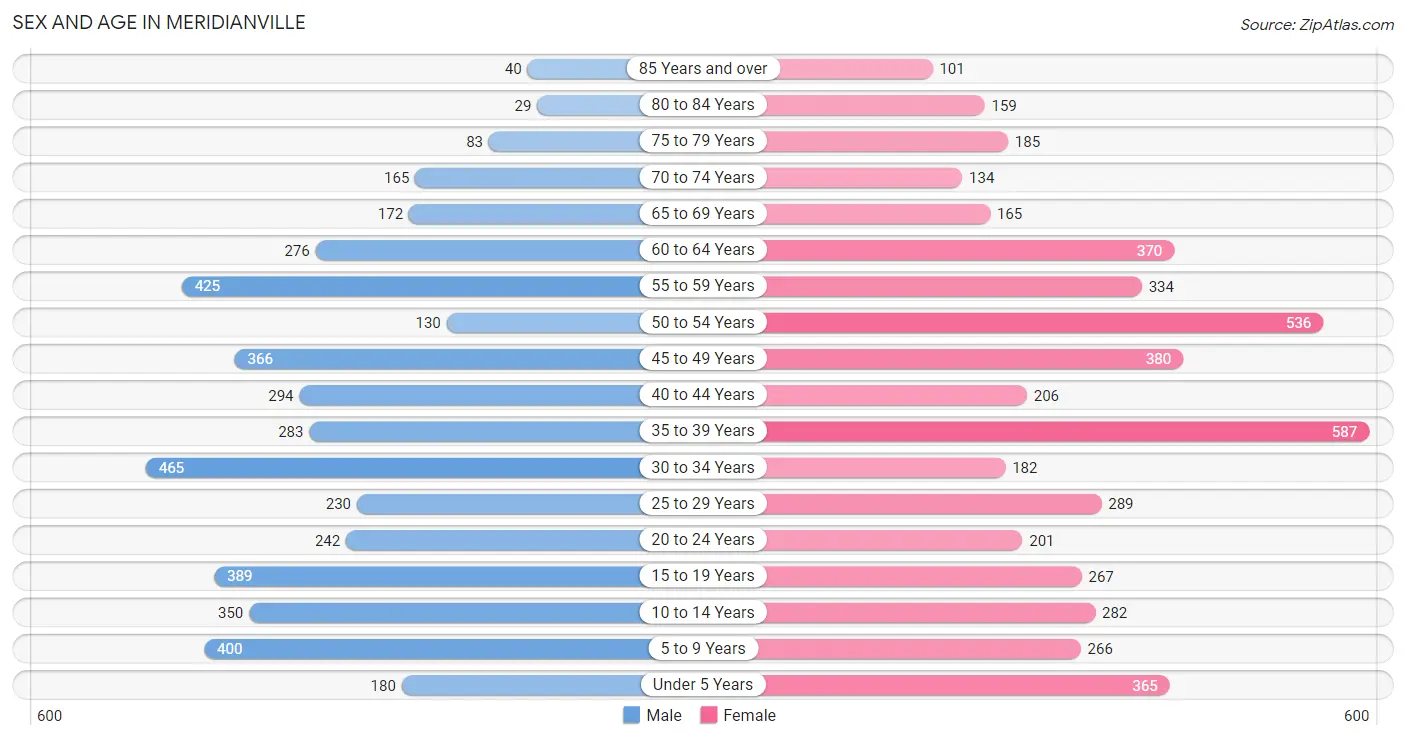
| Age Bracket | Male | Female |
| Under 5 Years | 180 (4.0%) | 365 (7.3%) |
| 5 to 9 Years | 400 (8.8%) | 266 (5.3%) |
| 10 to 14 Years | 350 (7.7%) | 282 (5.6%) |
| 15 to 19 Years | 389 (8.6%) | 267 (5.3%) |
| 20 to 24 Years | 242 (5.4%) | 201 (4.0%) |
| 25 to 29 Years | 230 (5.1%) | 289 (5.8%) |
| 30 to 34 Years | 465 (10.3%) | 182 (3.6%) |
| 35 to 39 Years | 283 (6.3%) | 587 (11.7%) |
| 40 to 44 Years | 294 (6.5%) | 206 (4.1%) |
| 45 to 49 Years | 366 (8.1%) | 380 (7.6%) |
| 50 to 54 Years | 130 (2.9%) | 536 (10.7%) |
| 55 to 59 Years | 425 (9.4%) | 334 (6.7%) |
| 60 to 64 Years | 276 (6.1%) | 370 (7.4%) |
| 65 to 69 Years | 172 (3.8%) | 165 (3.3%) |
| 70 to 74 Years | 165 (3.6%) | 134 (2.7%) |
| 75 to 79 Years | 83 (1.8%) | 185 (3.7%) |
| 80 to 84 Years | 29 (0.6%) | 159 (3.2%) |
| 85 Years and over | 40 (0.9%) | 101 (2.0%) |
| Total | 4,519 (100.0%) | 5,009 (100.0%) |
Families and Households in Meridianville
Median Family Size in Meridianville
The median family size in Meridianville is 3.20 persons per family, with married-couple families (1,998 | 75.6%) accounting for the largest median family size of 3.29 persons per family. On the other hand, single male/father families (224 | 8.5%) represent the smallest median family size with 2.40 persons per family.
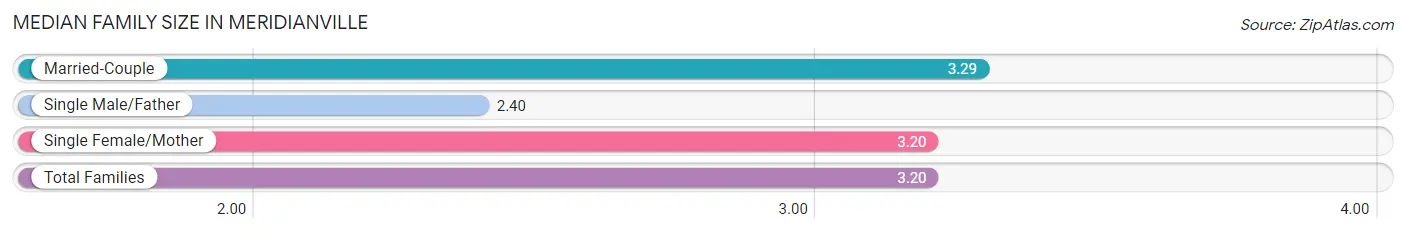
| Family Type | # Families | Family Size |
| Married-Couple | 1,998 (75.6%) | 3.29 |
| Single Male/Father | 224 (8.5%) | 2.40 |
| Single Female/Mother | 421 (15.9%) | 3.20 |
| Total Families | 2,643 (100.0%) | 3.20 |
Median Household Size in Meridianville
The median household size in Meridianville is 2.73 persons per household, with married-couple households (1,998 | 57.2%) accounting for the largest median household size of 3.3 persons per household. non-family households (853 | 24.4%) represent the smallest median household size with 1.13 persons per household.
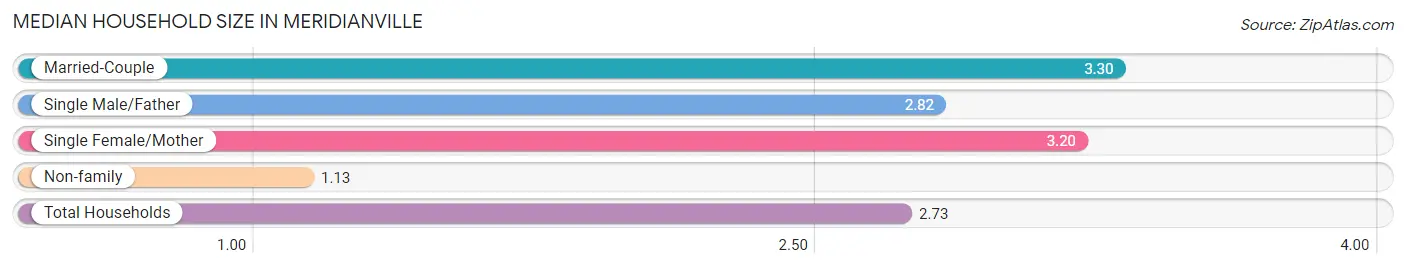
| Household Type | # Households | Household Size |
| Married-Couple | 1,998 (57.2%) | 3.30 |
| Single Male/Father | 224 (6.4%) | 2.82 |
| Single Female/Mother | 421 (12.0%) | 3.20 |
| Non-family | 853 (24.4%) | 1.13 |
| Total Households | 3,496 (100.0%) | 2.73 |
Household Size by Marriage Status in Meridianville
Out of a total of 3,496 households in Meridianville, 2,643 (75.6%) are family households, while 853 (24.4%) are nonfamily households. The most numerous type of family households are 2-person households, comprising 1,109, and the most common type of nonfamily households are 1-person households, comprising 770.
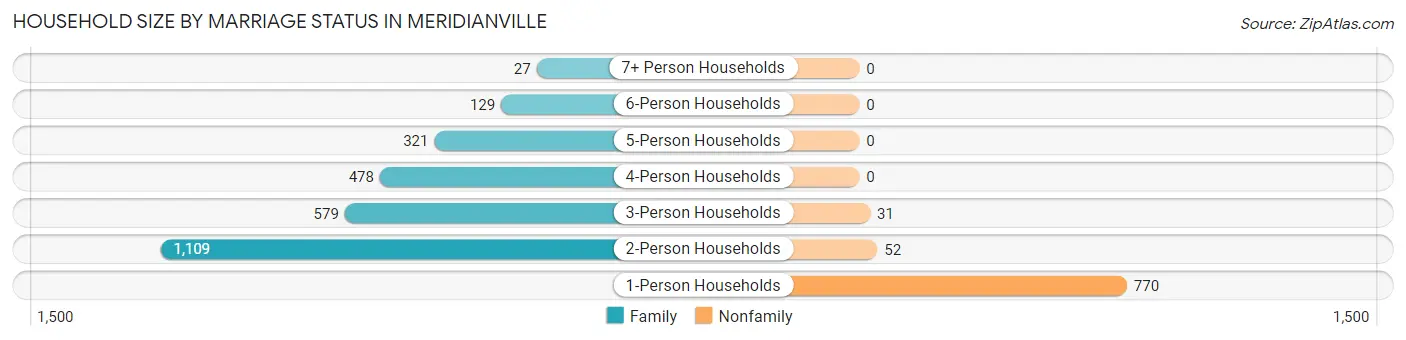
| Household Size | Family Households | Nonfamily Households |
| 1-Person Households | - | 770 (22.0%) |
| 2-Person Households | 1,109 (31.7%) | 52 (1.5%) |
| 3-Person Households | 579 (16.6%) | 31 (0.9%) |
| 4-Person Households | 478 (13.7%) | 0 (0.0%) |
| 5-Person Households | 321 (9.2%) | 0 (0.0%) |
| 6-Person Households | 129 (3.7%) | 0 (0.0%) |
| 7+ Person Households | 27 (0.8%) | 0 (0.0%) |
| Total | 2,643 (75.6%) | 853 (24.4%) |
Female Fertility in Meridianville
Fertility by Age in Meridianville
Average fertility rate in Meridianville is 77.0 births per 1,000 women. Women in the age bracket of 20 to 34 years have the highest fertility rate with 150.0 births per 1,000 women. Women in the age bracket of 20 to 34 years acount for 56.1% of all women with births.
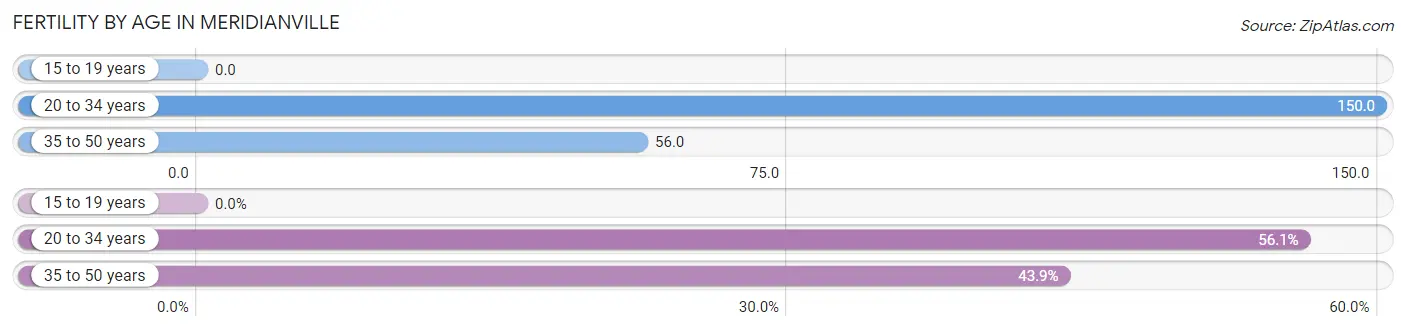
| Age Bracket | Women with Births | Births / 1,000 Women |
| 15 to 19 years | 0 (0.0%) | 0.0 |
| 20 to 34 years | 101 (56.1%) | 150.0 |
| 35 to 50 years | 79 (43.9%) | 56.0 |
| Total | 180 (100.0%) | 77.0 |
Fertility by Age by Marriage Status in Meridianville
93.9% of women with births (180) in Meridianville are married. The highest percentage of unmarried women with births falls into 20 to 34 years age bracket with 10.9% of them unmarried at the time of birth, while the lowest percentage of unmarried women with births belong to 35 to 50 years age bracket with 0.0% of them unmarried.
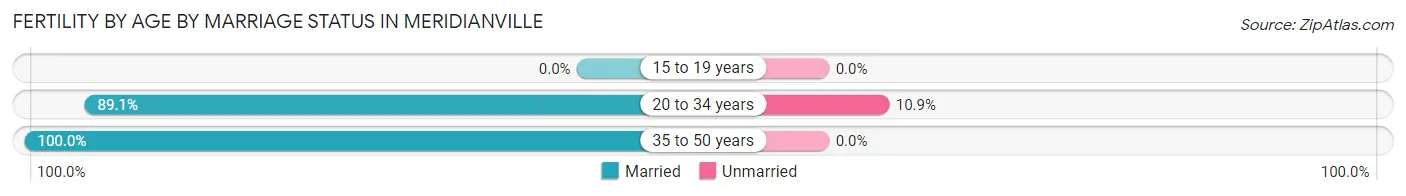
| Age Bracket | Married | Unmarried |
| 15 to 19 years | 0 (0.0%) | 0 (0.0%) |
| 20 to 34 years | 90 (89.1%) | 11 (10.9%) |
| 35 to 50 years | 79 (100.0%) | 0 (0.0%) |
| Total | 169 (93.9%) | 11 (6.1%) |
Fertility by Education in Meridianville
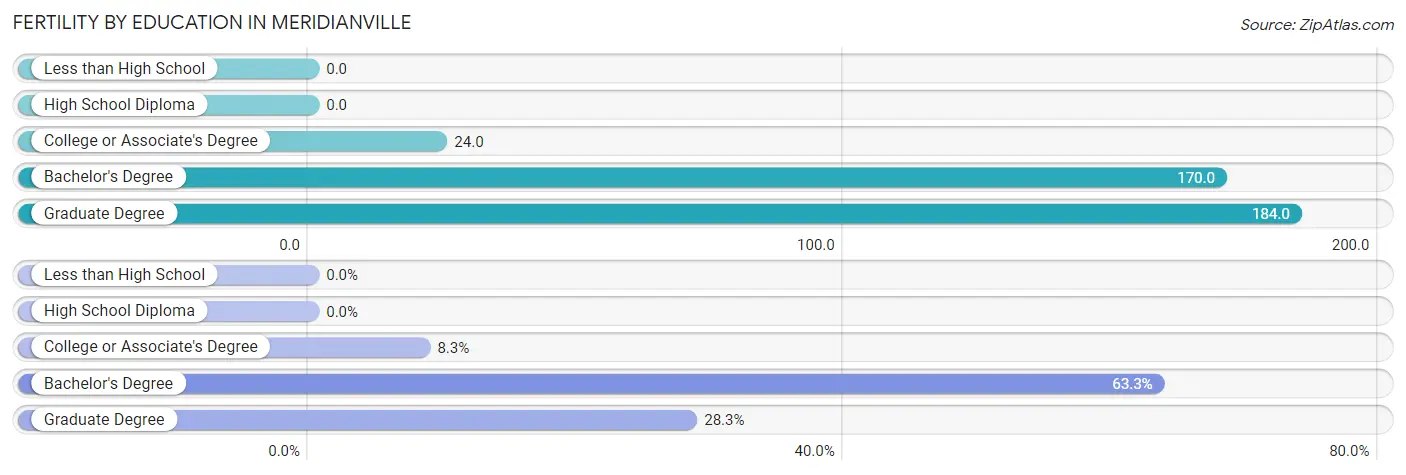
| Educational Attainment | Women with Births | Births / 1,000 Women |
| Less than High School | 0 (0.0%) | 0.0 |
| High School Diploma | 0 (0.0%) | 0.0 |
| College or Associate's Degree | 15 (8.3%) | 24.0 |
| Bachelor's Degree | 114 (63.3%) | 170.0 |
| Graduate Degree | 51 (28.3%) | 184.0 |
| Total | 180 (100.0%) | 77.0 |
Fertility by Education by Marriage Status in Meridianville
6.1% of women with births in Meridianville are unmarried. Women with the educational attainment of college or associate's degree are most likely to be married with 100.0% of them married at childbirth, while women with the educational attainment of bachelor's degree are least likely to be married with 9.7% of them unmarried at childbirth.
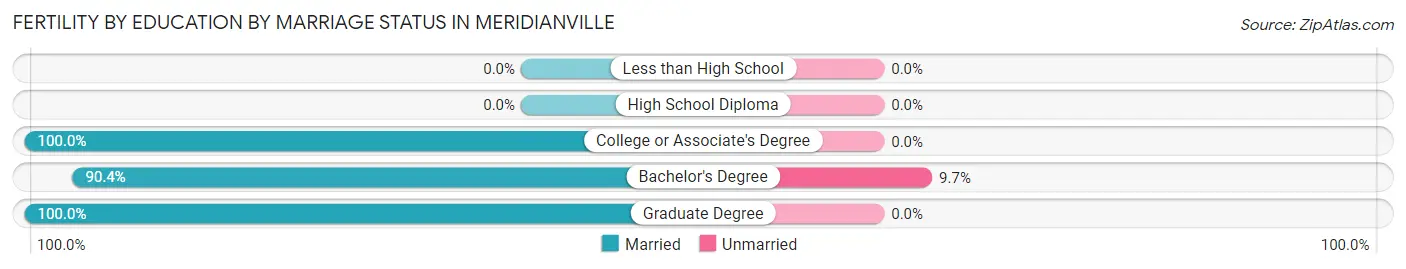
| Educational Attainment | Married | Unmarried |
| Less than High School | 0 (0.0%) | 0 (0.0%) |
| High School Diploma | 0 (0.0%) | 0 (0.0%) |
| College or Associate's Degree | 15 (100.0%) | 0 (0.0%) |
| Bachelor's Degree | 103 (90.3%) | 11 (9.7%) |
| Graduate Degree | 51 (100.0%) | 0 (0.0%) |
| Total | 169 (93.9%) | 11 (6.1%) |
Employment Characteristics in Meridianville
Employment by Class of Employer in Meridianville
Among the 4,615 employed individuals in Meridianville, private company employees (2,926 | 63.4%), federal government employees (523 | 11.3%), and not-for-profit organizations (471 | 10.2%) make up the most common classes of employment.
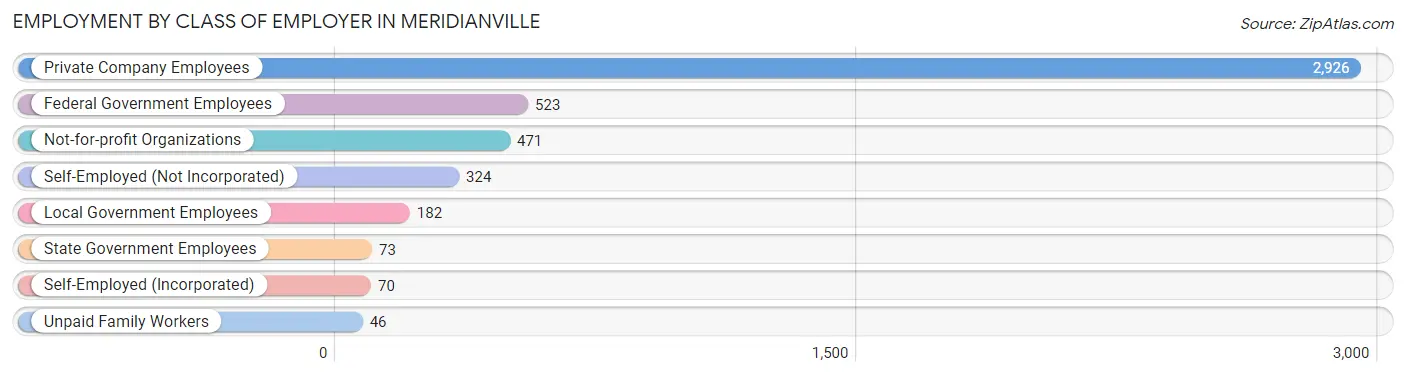
| Employer Class | # Employees | % Employees |
| Private Company Employees | 2,926 | 63.4% |
| Self-Employed (Incorporated) | 70 | 1.5% |
| Self-Employed (Not Incorporated) | 324 | 7.0% |
| Not-for-profit Organizations | 471 | 10.2% |
| Local Government Employees | 182 | 3.9% |
| State Government Employees | 73 | 1.6% |
| Federal Government Employees | 523 | 11.3% |
| Unpaid Family Workers | 46 | 1.0% |
| Total | 4,615 | 100.0% |
Employment Status by Age in Meridianville
According to the labor force statistics for Meridianville, out of the total population over 16 years of age (7,527), 67.1% or 5,051 individuals are in the labor force, with 7.2% or 364 of them unemployed. The age group with the highest labor force participation rate is 25 to 29 years, with 93.6% or 486 individuals in the labor force. Within the labor force, the 30 to 34 years age range has the highest percentage of unemployed individuals, with 28.1% or 165 of them being unemployed.
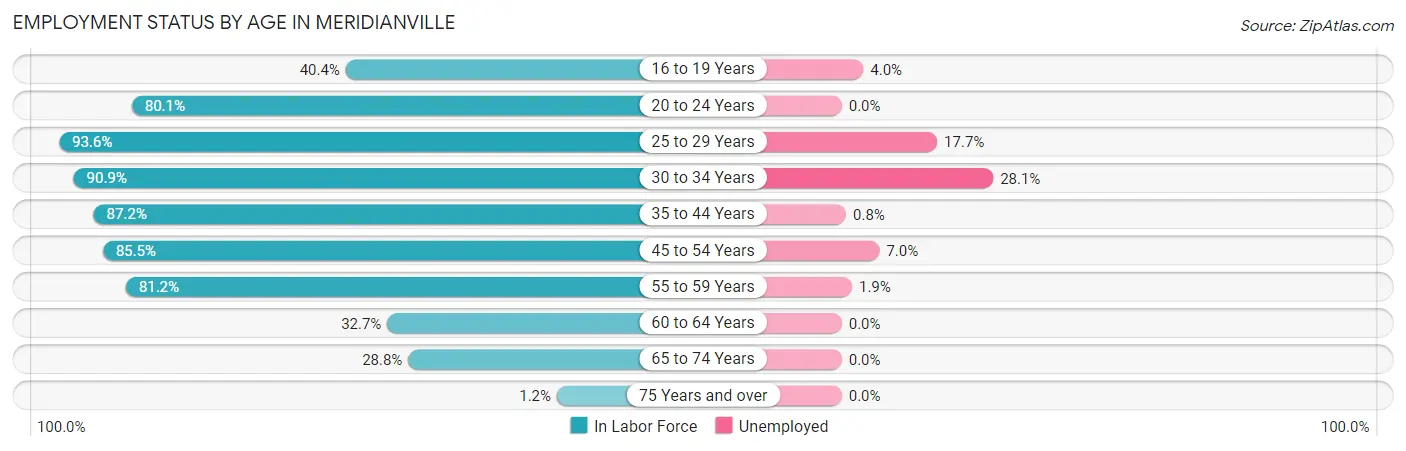
| Age Bracket | In Labor Force | Unemployed |
| 16 to 19 Years | 201 (40.4%) | 8 (4.0%) |
| 20 to 24 Years | 355 (80.1%) | 0 (0.0%) |
| 25 to 29 Years | 486 (93.6%) | 86 (17.7%) |
| 30 to 34 Years | 588 (90.9%) | 165 (28.1%) |
| 35 to 44 Years | 1,195 (87.2%) | 10 (0.8%) |
| 45 to 54 Years | 1,207 (85.5%) | 84 (7.0%) |
| 55 to 59 Years | 616 (81.2%) | 12 (1.9%) |
| 60 to 64 Years | 211 (32.7%) | 0 (0.0%) |
| 65 to 74 Years | 183 (28.8%) | 0 (0.0%) |
| 75 Years and over | 7 (1.2%) | 0 (0.0%) |
| Total | 5,051 (67.1%) | 364 (7.2%) |
Employment Status by Educational Attainment in Meridianville
According to labor force statistics for Meridianville, 80.4% of individuals (4,304) out of the total population between 25 and 64 years of age (5,353) are in the labor force, with 8.3% or 357 of them being unemployed. The group with the highest labor force participation rate are those with the educational attainment of bachelor's degree or higher, with 89.9% or 2,124 individuals in the labor force. Within the labor force, individuals with high school diploma education have the highest percentage of unemployment, with 17.4% or 165 of them being unemployed.
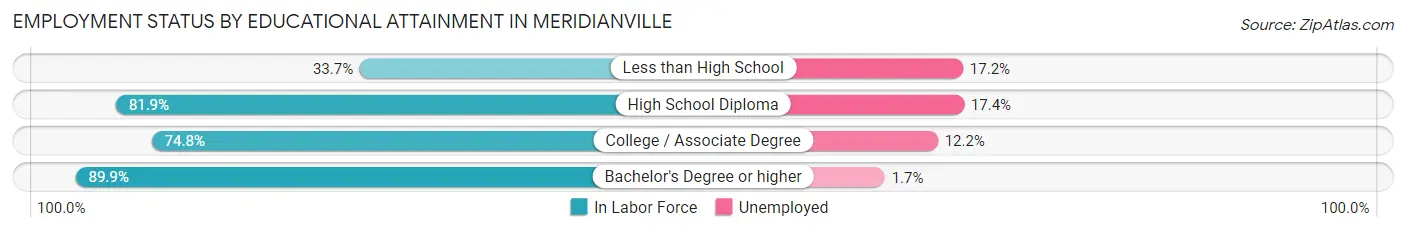
| Educational Attainment | In Labor Force | Unemployed |
| Less than High School | 116 (33.7%) | 59 (17.2%) |
| High School Diploma | 948 (81.9%) | 201 (17.4%) |
| College / Associate Degree | 1,114 (74.8%) | 182 (12.2%) |
| Bachelor's Degree or higher | 2,124 (89.9%) | 40 (1.7%) |
| Total | 4,304 (80.4%) | 444 (8.3%) |
Employment Occupations by Sex in Meridianville
Management, Business, Science and Arts Occupations
The most common Management, Business, Science and Arts occupations in Meridianville are Computers, Engineering & Science (793 | 16.9%), Management (521 | 11.1%), Computers & Mathematics (500 | 10.7%), Health Diagnosing & Treating (427 | 9.1%), and Business & Financial (395 | 8.4%).
Management, Business, Science and Arts Occupations by Sex
Within the Management, Business, Science and Arts occupations in Meridianville, the most male-oriented occupations are Education, Arts & Media (100.0%), Architecture & Engineering (92.2%), and Computers & Mathematics (75.2%), while the most female-oriented occupations are Legal Services & Support (100.0%), Education Instruction & Library (100.0%), and Arts, Media & Entertainment (100.0%).
| Occupation | Male | Female |
| Management | 218 (41.8%) | 303 (58.2%) |
| Business & Financial | 206 (52.1%) | 189 (47.8%) |
| Computers, Engineering & Science | 549 (69.2%) | 244 (30.8%) |
| Computers & Mathematics | 376 (75.2%) | 124 (24.8%) |
| Architecture & Engineering | 166 (92.2%) | 14 (7.8%) |
| Life, Physical & Social Science | 7 (6.2%) | 106 (93.8%) |
| Community & Social Service | 30 (9.3%) | 291 (90.6%) |
| Education, Arts & Media | 30 (100.0%) | 0 (0.0%) |
| Legal Services & Support | 0 (0.0%) | 52 (100.0%) |
| Education Instruction & Library | 0 (0.0%) | 197 (100.0%) |
| Arts, Media & Entertainment | 0 (0.0%) | 42 (100.0%) |
| Health Diagnosing & Treating | 106 (24.8%) | 321 (75.2%) |
| Health Technologists | 81 (27.7%) | 211 (72.3%) |
| Total (Category) | 1,109 (45.1%) | 1,348 (54.9%) |
| Total (Overall) | 2,208 (47.1%) | 2,476 (52.9%) |
Services Occupations
The most common Services occupations in Meridianville are Food Preparation & Serving (258 | 5.5%), Personal Care & Service (118 | 2.5%), Cleaning & Maintenance (110 | 2.4%), Healthcare Support (64 | 1.4%), and Security & Protection (38 | 0.8%).
Services Occupations by Sex
Within the Services occupations in Meridianville, the most male-oriented occupations are Security & Protection (100.0%), Firefighting & Prevention (100.0%), and Law Enforcement (100.0%), while the most female-oriented occupations are Personal Care & Service (88.1%), Healthcare Support (70.3%), and Food Preparation & Serving (54.6%).
| Occupation | Male | Female |
| Healthcare Support | 19 (29.7%) | 45 (70.3%) |
| Security & Protection | 38 (100.0%) | 0 (0.0%) |
| Firefighting & Prevention | 13 (100.0%) | 0 (0.0%) |
| Law Enforcement | 25 (100.0%) | 0 (0.0%) |
| Food Preparation & Serving | 117 (45.4%) | 141 (54.6%) |
| Cleaning & Maintenance | 57 (51.8%) | 53 (48.2%) |
| Personal Care & Service | 14 (11.9%) | 104 (88.1%) |
| Total (Category) | 245 (41.7%) | 343 (58.3%) |
| Total (Overall) | 2,208 (47.1%) | 2,476 (52.9%) |
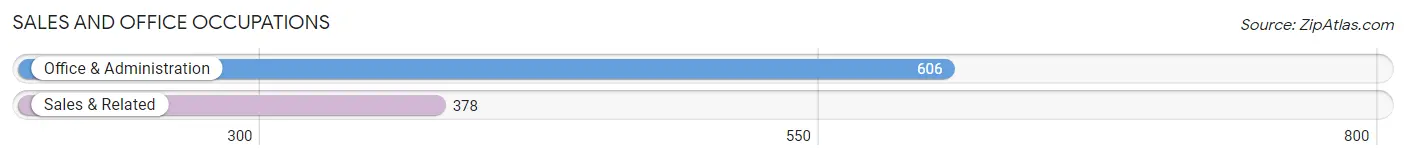
Sales and Office Occupations
The most common Sales and Office occupations in Meridianville are Office & Administration (606 | 12.9%), and Sales & Related (378 | 8.1%).
Sales and Office Occupations by Sex
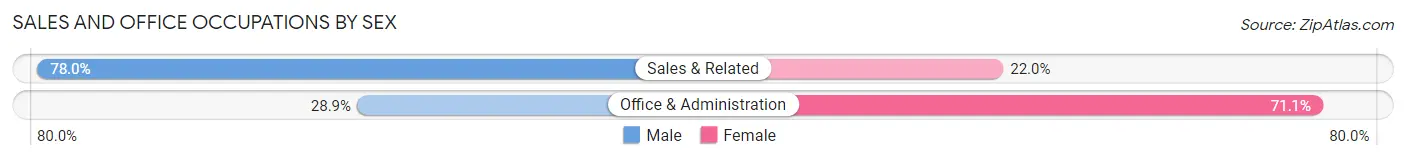
| Occupation | Male | Female |
| Sales & Related | 295 (78.0%) | 83 (22.0%) |
| Office & Administration | 175 (28.9%) | 431 (71.1%) |
| Total (Category) | 470 (47.8%) | 514 (52.2%) |
| Total (Overall) | 2,208 (47.1%) | 2,476 (52.9%) |
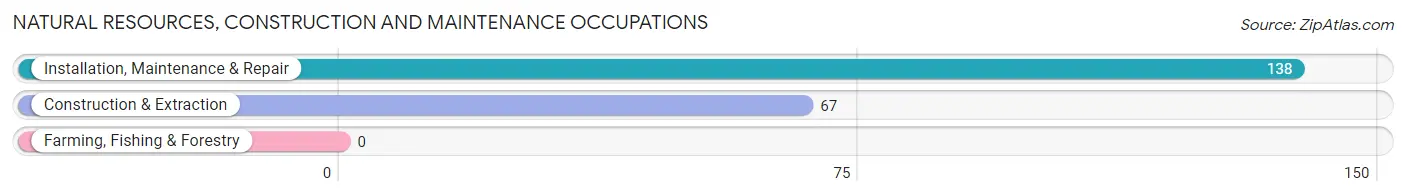
Natural Resources, Construction and Maintenance Occupations
The most common Natural Resources, Construction and Maintenance occupations in Meridianville are Installation, Maintenance & Repair (138 | 2.9%), and Construction & Extraction (67 | 1.4%).
Natural Resources, Construction and Maintenance Occupations by Sex

| Occupation | Male | Female |
| Farming, Fishing & Forestry | 0 (0.0%) | 0 (0.0%) |
| Construction & Extraction | 67 (100.0%) | 0 (0.0%) |
| Installation, Maintenance & Repair | 138 (100.0%) | 0 (0.0%) |
| Total (Category) | 205 (100.0%) | 0 (0.0%) |
| Total (Overall) | 2,208 (47.1%) | 2,476 (52.9%) |
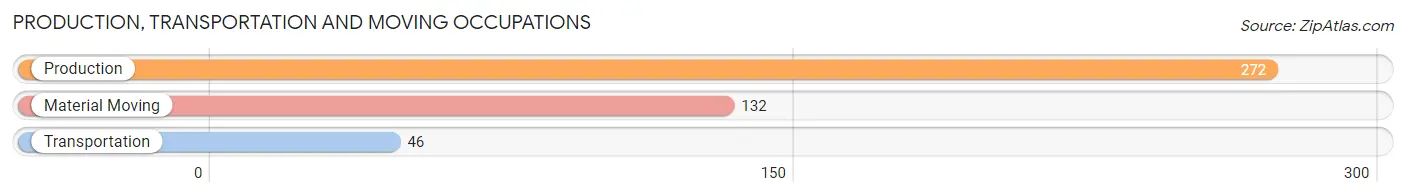
Production, Transportation and Moving Occupations
The most common Production, Transportation and Moving occupations in Meridianville are Production (272 | 5.8%), Material Moving (132 | 2.8%), and Transportation (46 | 1.0%).
Production, Transportation and Moving Occupations by Sex
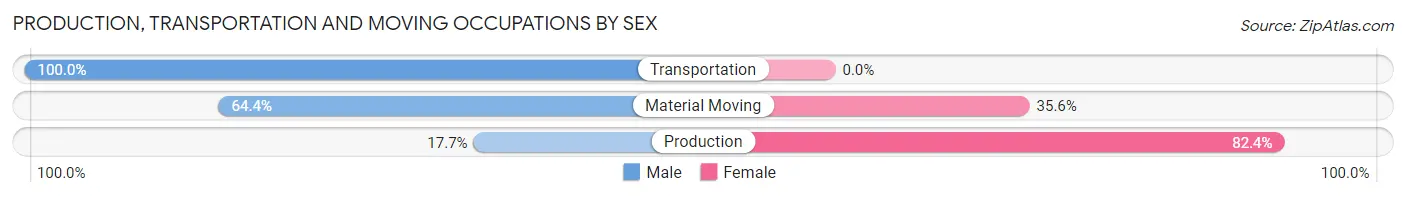
| Occupation | Male | Female |
| Production | 48 (17.6%) | 224 (82.4%) |
| Transportation | 46 (100.0%) | 0 (0.0%) |
| Material Moving | 85 (64.4%) | 47 (35.6%) |
| Total (Category) | 179 (39.8%) | 271 (60.2%) |
| Total (Overall) | 2,208 (47.1%) | 2,476 (52.9%) |
Employment Industries by Sex in Meridianville
Employment Industries in Meridianville
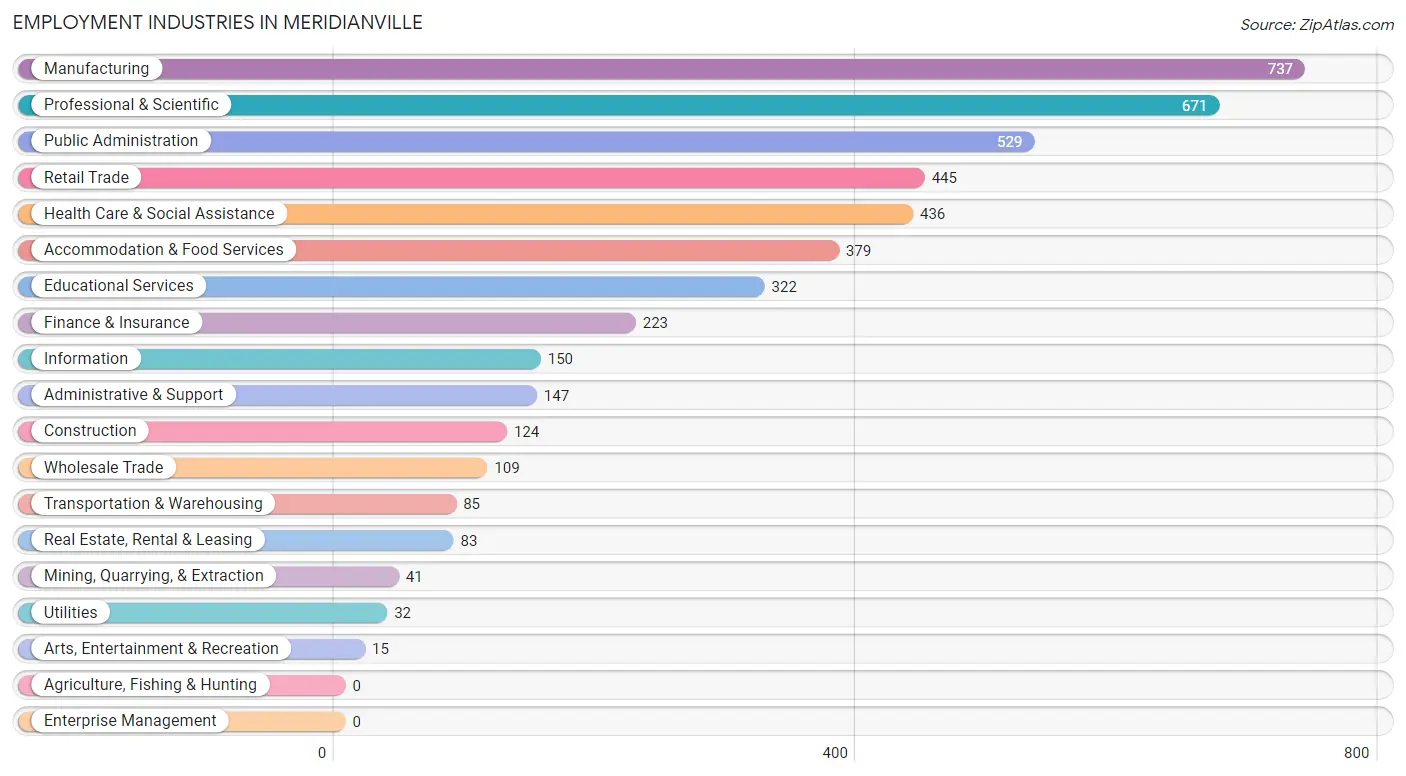
The major employment industries in Meridianville include Manufacturing (737 | 15.7%), Professional & Scientific (671 | 14.3%), Public Administration (529 | 11.3%), Retail Trade (445 | 9.5%), and Health Care & Social Assistance (436 | 9.3%).
Employment Industries by Sex in Meridianville
The Meridianville industries that see more men than women are Mining, Quarrying, & Extraction (100.0%), Utilities (100.0%), and Transportation & Warehousing (89.4%), whereas the industries that tend to have a higher number of women are Arts, Entertainment & Recreation (100.0%), Educational Services (79.5%), and Real Estate, Rental & Leasing (77.1%).
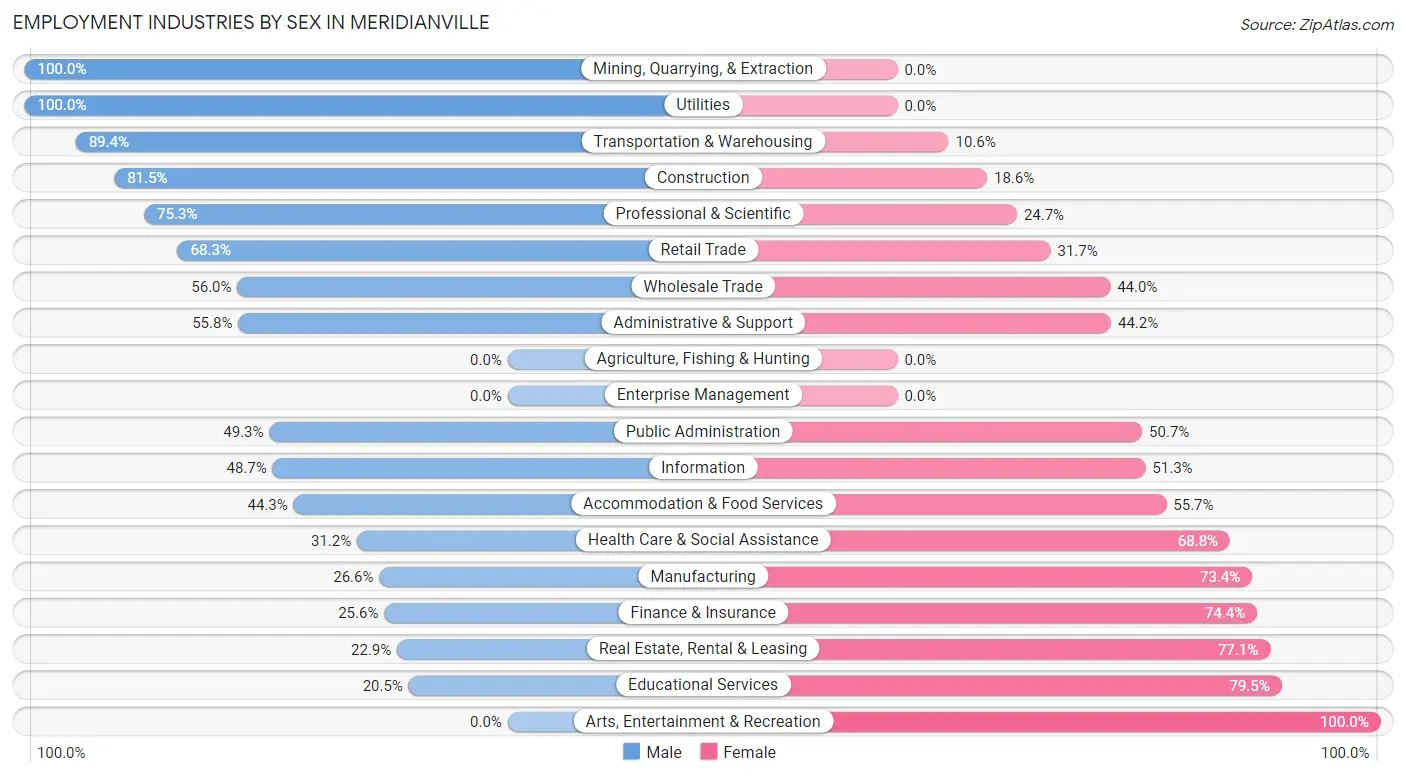
| Industry | Male | Female |
| Agriculture, Fishing & Hunting | 0 (0.0%) | 0 (0.0%) |
| Mining, Quarrying, & Extraction | 41 (100.0%) | 0 (0.0%) |
| Construction | 101 (81.5%) | 23 (18.5%) |
| Manufacturing | 196 (26.6%) | 541 (73.4%) |
| Wholesale Trade | 61 (56.0%) | 48 (44.0%) |
| Retail Trade | 304 (68.3%) | 141 (31.7%) |
| Transportation & Warehousing | 76 (89.4%) | 9 (10.6%) |
| Utilities | 32 (100.0%) | 0 (0.0%) |
| Information | 73 (48.7%) | 77 (51.3%) |
| Finance & Insurance | 57 (25.6%) | 166 (74.4%) |
| Real Estate, Rental & Leasing | 19 (22.9%) | 64 (77.1%) |
| Professional & Scientific | 505 (75.3%) | 166 (24.7%) |
| Enterprise Management | 0 (0.0%) | 0 (0.0%) |
| Administrative & Support | 82 (55.8%) | 65 (44.2%) |
| Educational Services | 66 (20.5%) | 256 (79.5%) |
| Health Care & Social Assistance | 136 (31.2%) | 300 (68.8%) |
| Arts, Entertainment & Recreation | 0 (0.0%) | 15 (100.0%) |
| Accommodation & Food Services | 168 (44.3%) | 211 (55.7%) |
| Public Administration | 261 (49.3%) | 268 (50.7%) |
| Total | 2,208 (47.1%) | 2,476 (52.9%) |
Education in Meridianville
School Enrollment in Meridianville
The most common levels of schooling among the 2,975 students in Meridianville are elementary school (730 | 24.5%), college / undergraduate (729 | 24.5%), and high school (542 | 18.2%).
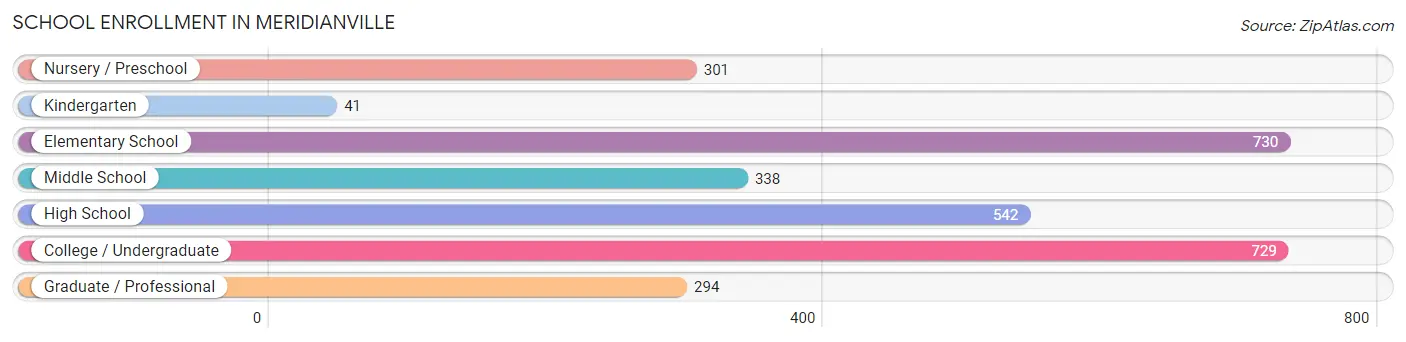
| School Level | # Students | % Students |
| Nursery / Preschool | 301 | 10.1% |
| Kindergarten | 41 | 1.4% |
| Elementary School | 730 | 24.5% |
| Middle School | 338 | 11.4% |
| High School | 542 | 18.2% |
| College / Undergraduate | 729 | 24.5% |
| Graduate / Professional | 294 | 9.9% |
| Total | 2,975 | 100.0% |
School Enrollment by Age by Funding Source in Meridianville
Out of a total of 2,975 students who are enrolled in schools in Meridianville, 854 (28.7%) attend a private institution, while the remaining 2,121 (71.3%) are enrolled in public schools. The age group of 3 to 4 year olds has the highest likelihood of being enrolled in private schools, with 168 (71.8% in the age bracket) enrolled. Conversely, the age group of 18 to 19 year olds has the lowest likelihood of being enrolled in a private school, with 246 (100.0% in the age bracket) attending a public institution.
| Age Bracket | Public School | Private School |
| 3 to 4 Year Olds | 66 (28.2%) | 168 (71.8%) |
| 5 to 9 Year Old | 437 (65.6%) | 229 (34.4%) |
| 10 to 14 Year Olds | 481 (76.1%) | 151 (23.9%) |
| 15 to 17 Year Olds | 336 (84.0%) | 64 (16.0%) |
| 18 to 19 Year Olds | 246 (100.0%) | 0 (0.0%) |
| 20 to 24 Year Olds | 261 (100.0%) | 0 (0.0%) |
| 25 to 34 Year Olds | 118 (82.5%) | 25 (17.5%) |
| 35 Years and over | 176 (44.8%) | 217 (55.2%) |
| Total | 2,121 (71.3%) | 854 (28.7%) |
Educational Attainment by Field of Study in Meridianville
Business (965 | 34.4%), engineering (389 | 13.9%), science & technology (261 | 9.3%), computers & mathematics (195 | 7.0%), and physical & health sciences (180 | 6.4%) are the most common fields of study among 2,801 individuals in Meridianville who have obtained a bachelor's degree or higher.
| Field of Study | # Graduates | % Graduates |
| Computers & Mathematics | 195 | 7.0% |
| Bio, Nature & Agricultural | 66 | 2.4% |
| Physical & Health Sciences | 180 | 6.4% |
| Psychology | 40 | 1.4% |
| Social Sciences | 92 | 3.3% |
| Engineering | 389 | 13.9% |
| Multidisciplinary Studies | 14 | 0.5% |
| Science & Technology | 261 | 9.3% |
| Business | 965 | 34.4% |
| Education | 171 | 6.1% |
| Literature & Languages | 19 | 0.7% |
| Liberal Arts & History | 151 | 5.4% |
| Visual & Performing Arts | 59 | 2.1% |
| Communications | 25 | 0.9% |
| Arts & Humanities | 174 | 6.2% |
| Total | 2,801 | 100.0% |
Transportation & Commute in Meridianville
Vehicle Availability by Sex in Meridianville
The most prevalent vehicle ownership categories in Meridianville are males with 2 vehicles (838, accounting for 38.3%) and females with 2 vehicles (623, making up 34.6%).
| Vehicles Available | Male | Female |
| No Vehicle | 14 (0.6%) | 0 (0.0%) |
| 1 Vehicle | 146 (6.7%) | 519 (21.4%) |
| 2 Vehicles | 838 (38.3%) | 623 (25.7%) |
| 3 Vehicles | 715 (32.6%) | 817 (33.7%) |
| 4 Vehicles | 279 (12.7%) | 320 (13.2%) |
| 5 or more Vehicles | 199 (9.1%) | 145 (6.0%) |
| Total | 2,191 (100.0%) | 2,424 (100.0%) |
Commute Time in Meridianville
The most frequently occuring commute durations in Meridianville are 20 to 24 minutes (1,051 commuters, 26.6%), 15 to 19 minutes (906 commuters, 23.0%), and 30 to 34 minutes (771 commuters, 19.5%).
| Commute Time | # Commuters | % Commuters |
| Less than 5 Minutes | 61 | 1.5% |
| 5 to 9 Minutes | 68 | 1.7% |
| 10 to 14 Minutes | 404 | 10.2% |
| 15 to 19 Minutes | 906 | 23.0% |
| 20 to 24 Minutes | 1,051 | 26.6% |
| 25 to 29 Minutes | 250 | 6.3% |
| 30 to 34 Minutes | 771 | 19.5% |
| 35 to 39 Minutes | 116 | 2.9% |
| 40 to 44 Minutes | 106 | 2.7% |
| 45 to 59 Minutes | 74 | 1.9% |
| 60 to 89 Minutes | 139 | 3.5% |
| 90 or more Minutes | 0 | 0.0% |
Commute Time by Sex in Meridianville
The most common commute times in Meridianville are 20 to 24 minutes (654 commuters, 34.7%) for males and 15 to 19 minutes (650 commuters, 31.6%) for females.
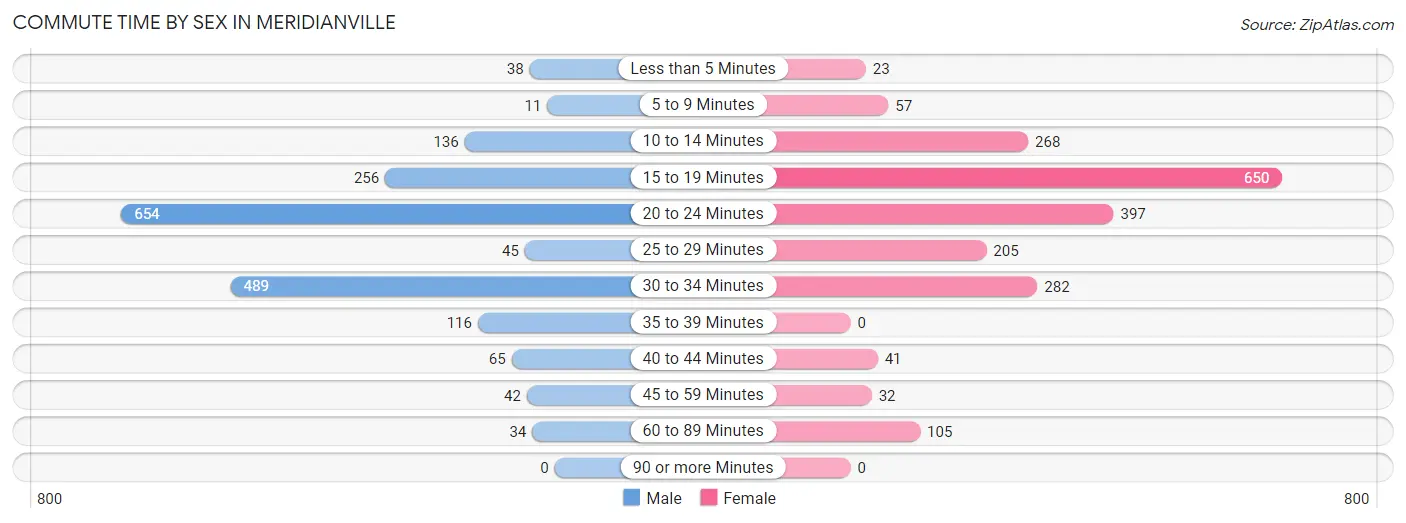
| Commute Time | Male | Female |
| Less than 5 Minutes | 38 (2.0%) | 23 (1.1%) |
| 5 to 9 Minutes | 11 (0.6%) | 57 (2.8%) |
| 10 to 14 Minutes | 136 (7.2%) | 268 (13.0%) |
| 15 to 19 Minutes | 256 (13.6%) | 650 (31.6%) |
| 20 to 24 Minutes | 654 (34.7%) | 397 (19.3%) |
| 25 to 29 Minutes | 45 (2.4%) | 205 (10.0%) |
| 30 to 34 Minutes | 489 (25.9%) | 282 (13.7%) |
| 35 to 39 Minutes | 116 (6.1%) | 0 (0.0%) |
| 40 to 44 Minutes | 65 (3.5%) | 41 (2.0%) |
| 45 to 59 Minutes | 42 (2.2%) | 32 (1.5%) |
| 60 to 89 Minutes | 34 (1.8%) | 105 (5.1%) |
| 90 or more Minutes | 0 (0.0%) | 0 (0.0%) |
Time of Departure to Work by Sex in Meridianville
The most frequent times of departure to work in Meridianville are 6:30 AM to 6:59 AM (301, 16.0%) for males and 12:00 PM to 3:59 PM (466, 22.6%) for females.

| Time of Departure | Male | Female |
| 12:00 AM to 4:59 AM | 9 (0.5%) | 12 (0.6%) |
| 5:00 AM to 5:29 AM | 152 (8.1%) | 11 (0.5%) |
| 5:30 AM to 5:59 AM | 156 (8.3%) | 15 (0.7%) |
| 6:00 AM to 6:29 AM | 182 (9.7%) | 135 (6.6%) |
| 6:30 AM to 6:59 AM | 301 (16.0%) | 160 (7.8%) |
| 7:00 AM to 7:29 AM | 294 (15.6%) | 328 (15.9%) |
| 7:30 AM to 7:59 AM | 200 (10.6%) | 218 (10.6%) |
| 8:00 AM to 8:29 AM | 250 (13.3%) | 283 (13.7%) |
| 8:30 AM to 8:59 AM | 56 (3.0%) | 64 (3.1%) |
| 9:00 AM to 9:59 AM | 6 (0.3%) | 173 (8.4%) |
| 10:00 AM to 10:59 AM | 5 (0.3%) | 10 (0.5%) |
| 11:00 AM to 11:59 AM | 0 (0.0%) | 0 (0.0%) |
| 12:00 PM to 3:59 PM | 71 (3.8%) | 466 (22.6%) |
| 4:00 PM to 11:59 PM | 204 (10.8%) | 185 (9.0%) |
| Total | 1,886 (100.0%) | 2,060 (100.0%) |
Housing Occupancy in Meridianville
Occupancy by Ownership in Meridianville
Of the total 3,496 dwellings in Meridianville, owner-occupied units account for 3,268 (93.5%), while renter-occupied units make up 228 (6.5%).
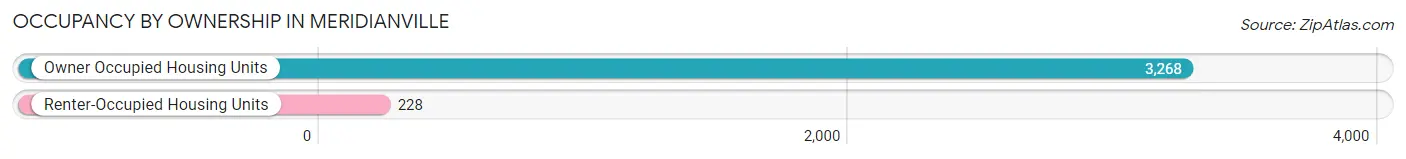
| Occupancy | # Housing Units | % Housing Units |
| Owner Occupied Housing Units | 3,268 | 93.5% |
| Renter-Occupied Housing Units | 228 | 6.5% |
| Total Occupied Housing Units | 3,496 | 100.0% |
Occupancy by Household Size in Meridianville
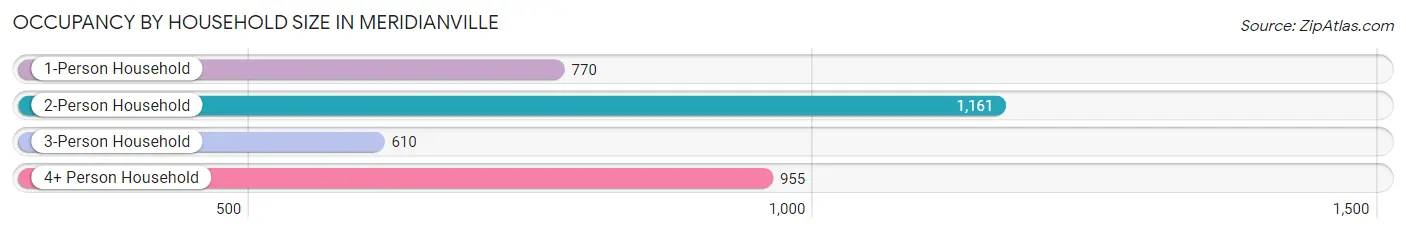
| Household Size | # Housing Units | % Housing Units |
| 1-Person Household | 770 | 22.0% |
| 2-Person Household | 1,161 | 33.2% |
| 3-Person Household | 610 | 17.4% |
| 4+ Person Household | 955 | 27.3% |
| Total Housing Units | 3,496 | 100.0% |
Occupancy by Ownership by Household Size in Meridianville
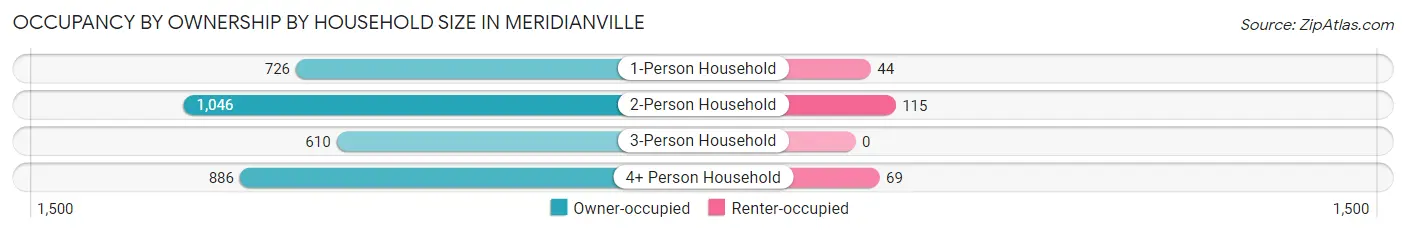
| Household Size | Owner-occupied | Renter-occupied |
| 1-Person Household | 726 (94.3%) | 44 (5.7%) |
| 2-Person Household | 1,046 (90.1%) | 115 (9.9%) |
| 3-Person Household | 610 (100.0%) | 0 (0.0%) |
| 4+ Person Household | 886 (92.8%) | 69 (7.2%) |
| Total Housing Units | 3,268 (93.5%) | 228 (6.5%) |
Occupancy by Educational Attainment in Meridianville
| Household Size | Owner-occupied | Renter-occupied |
| Less than High School | 133 (68.2%) | 62 (31.8%) |
| High School Diploma | 753 (94.0%) | 48 (6.0%) |
| College/Associate Degree | 778 (88.6%) | 100 (11.4%) |
| Bachelor's Degree or higher | 1,604 (98.9%) | 18 (1.1%) |
Occupancy by Age of Householder in Meridianville
| Age Bracket | # Households | % Households |
| Under 35 Years | 428 | 12.2% |
| 35 to 44 Years | 582 | 16.7% |
| 45 to 54 Years | 863 | 24.7% |
| 55 to 64 Years | 837 | 23.9% |
| 65 to 74 Years | 465 | 13.3% |
| 75 to 84 Years | 249 | 7.1% |
| 85 Years and Over | 72 | 2.1% |
| Total | 3,496 | 100.0% |
Housing Finances in Meridianville
Median Income by Occupancy in Meridianville
| Occupancy Type | # Households | Median Income |
| Owner-Occupied | 3,268 (93.5%) | $93,500 |
| Renter-Occupied | 228 (6.5%) | $58,508 |
| Average | 3,496 (100.0%) | $92,443 |
Occupancy by Householder Income Bracket in Meridianville
| Income Bracket | Owner-occupied | Renter-occupied |
| Less than $5,000 | 70 (2.1%) | 0 (0.0%) |
| $5,000 to $9,999 | 21 (0.6%) | 0 (0.0%) |
| $10,000 to $14,999 | 122 (3.7%) | 0 (0.0%) |
| $15,000 to $19,999 | 44 (1.3%) | 29 (12.7%) |
| $20,000 to $24,999 | 115 (3.5%) | 0 (0.0%) |
| $25,000 to $34,999 | 351 (10.7%) | 0 (0.0%) |
| $35,000 to $49,999 | 133 (4.1%) | 60 (26.3%) |
| $50,000 to $74,999 | 378 (11.6%) | 62 (27.2%) |
| $75,000 to $99,999 | 533 (16.3%) | 15 (6.6%) |
| $100,000 to $149,999 | 682 (20.9%) | 32 (14.0%) |
| $150,000 or more | 819 (25.1%) | 30 (13.2%) |
| Total | 3,268 (100.0%) | 228 (100.0%) |
Monthly Housing Cost Tiers in Meridianville
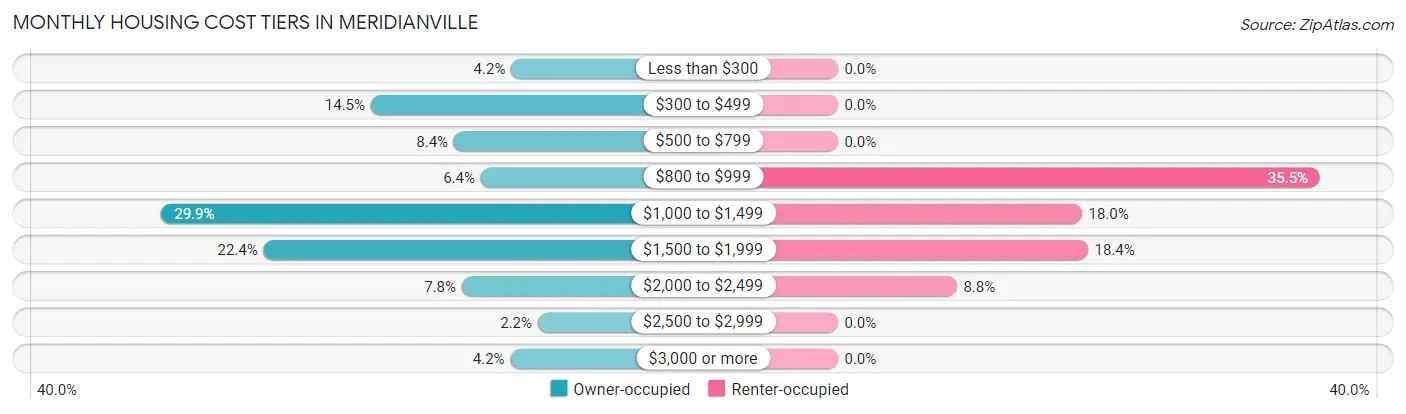
| Monthly Cost | Owner-occupied | Renter-occupied |
| Less than $300 | 136 (4.2%) | 0 (0.0%) |
| $300 to $499 | 474 (14.5%) | 0 (0.0%) |
| $500 to $799 | 274 (8.4%) | 0 (0.0%) |
| $800 to $999 | 209 (6.4%) | 81 (35.5%) |
| $1,000 to $1,499 | 978 (29.9%) | 41 (18.0%) |
| $1,500 to $1,999 | 732 (22.4%) | 42 (18.4%) |
| $2,000 to $2,499 | 255 (7.8%) | 20 (8.8%) |
| $2,500 to $2,999 | 72 (2.2%) | 0 (0.0%) |
| $3,000 or more | 138 (4.2%) | 0 (0.0%) |
| Total | 3,268 (100.0%) | 228 (100.0%) |
Physical Housing Characteristics in Meridianville
Housing Structures in Meridianville
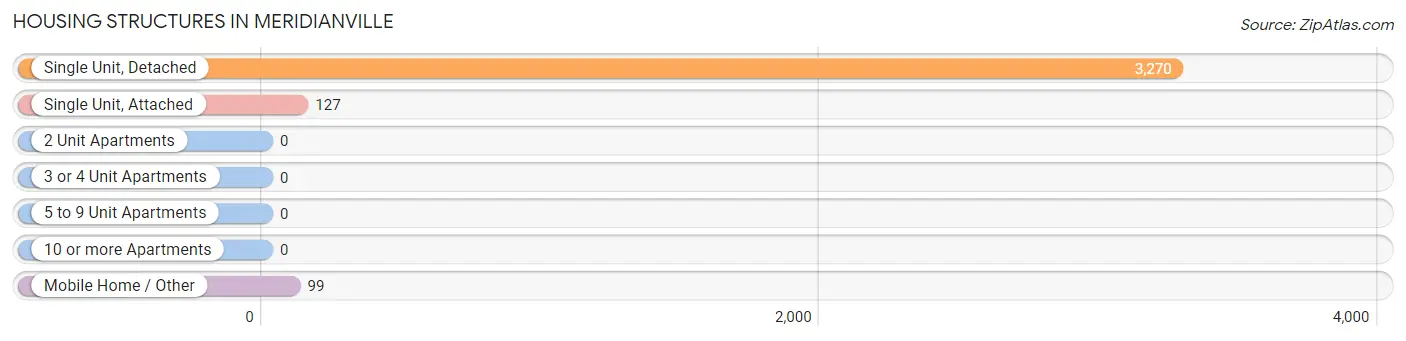
| Structure Type | # Housing Units | % Housing Units |
| Single Unit, Detached | 3,270 | 93.5% |
| Single Unit, Attached | 127 | 3.6% |
| 2 Unit Apartments | 0 | 0.0% |
| 3 or 4 Unit Apartments | 0 | 0.0% |
| 5 to 9 Unit Apartments | 0 | 0.0% |
| 10 or more Apartments | 0 | 0.0% |
| Mobile Home / Other | 99 | 2.8% |
| Total | 3,496 | 100.0% |
Housing Structures by Occupancy in Meridianville
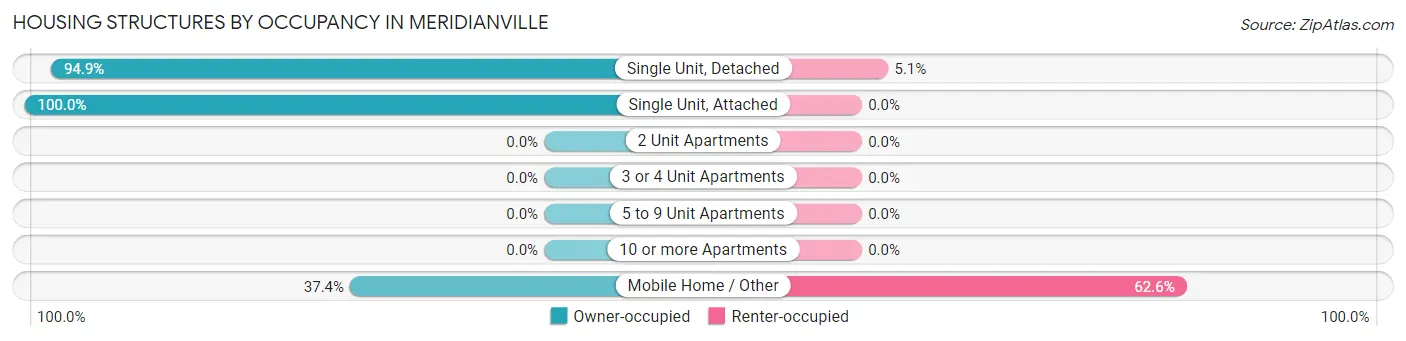
| Structure Type | Owner-occupied | Renter-occupied |
| Single Unit, Detached | 3,104 (94.9%) | 166 (5.1%) |
| Single Unit, Attached | 127 (100.0%) | 0 (0.0%) |
| 2 Unit Apartments | 0 (0.0%) | 0 (0.0%) |
| 3 or 4 Unit Apartments | 0 (0.0%) | 0 (0.0%) |
| 5 to 9 Unit Apartments | 0 (0.0%) | 0 (0.0%) |
| 10 or more Apartments | 0 (0.0%) | 0 (0.0%) |
| Mobile Home / Other | 37 (37.4%) | 62 (62.6%) |
| Total | 3,268 (93.5%) | 228 (6.5%) |
Housing Structures by Number of Rooms in Meridianville
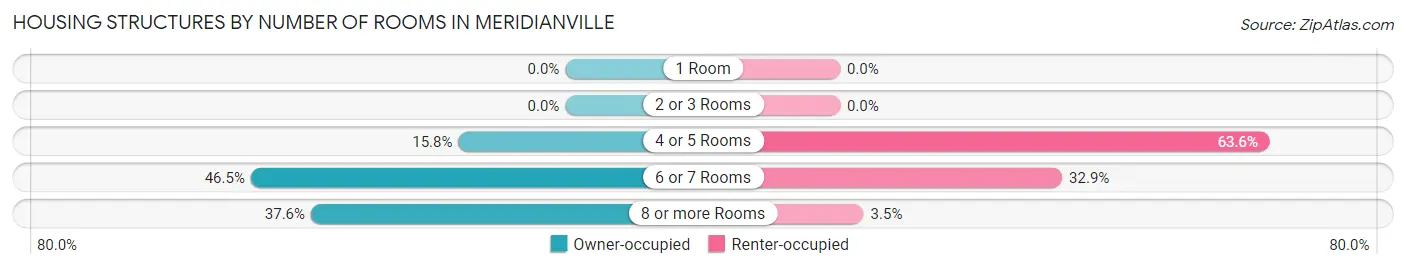
| Number of Rooms | Owner-occupied | Renter-occupied |
| 1 Room | 0 (0.0%) | 0 (0.0%) |
| 2 or 3 Rooms | 0 (0.0%) | 0 (0.0%) |
| 4 or 5 Rooms | 517 (15.8%) | 145 (63.6%) |
| 6 or 7 Rooms | 1,521 (46.5%) | 75 (32.9%) |
| 8 or more Rooms | 1,230 (37.6%) | 8 (3.5%) |
| Total | 3,268 (100.0%) | 228 (100.0%) |
Housing Structure by Heating Type in Meridianville
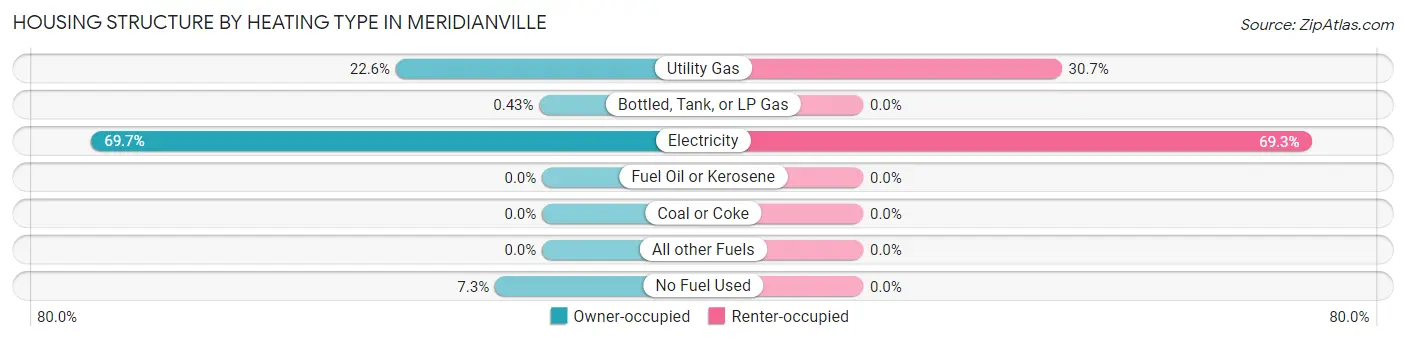
| Heating Type | Owner-occupied | Renter-occupied |
| Utility Gas | 739 (22.6%) | 70 (30.7%) |
| Bottled, Tank, or LP Gas | 14 (0.4%) | 0 (0.0%) |
| Electricity | 2,277 (69.7%) | 158 (69.3%) |
| Fuel Oil or Kerosene | 0 (0.0%) | 0 (0.0%) |
| Coal or Coke | 0 (0.0%) | 0 (0.0%) |
| All other Fuels | 0 (0.0%) | 0 (0.0%) |
| No Fuel Used | 238 (7.3%) | 0 (0.0%) |
| Total | 3,268 (100.0%) | 228 (100.0%) |
Household Vehicle Usage in Meridianville
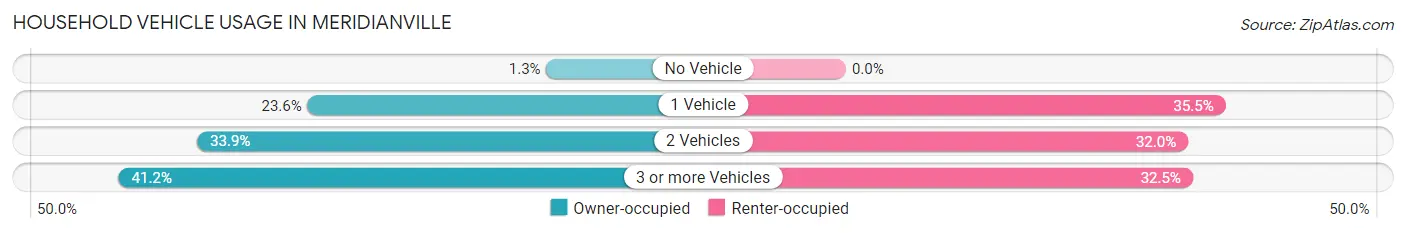
| Vehicles per Household | Owner-occupied | Renter-occupied |
| No Vehicle | 42 (1.3%) | 0 (0.0%) |
| 1 Vehicle | 771 (23.6%) | 81 (35.5%) |
| 2 Vehicles | 1,108 (33.9%) | 73 (32.0%) |
| 3 or more Vehicles | 1,347 (41.2%) | 74 (32.5%) |
| Total | 3,268 (100.0%) | 228 (100.0%) |
Real Estate & Mortgages in Meridianville
Real Estate and Mortgage Overview in Meridianville
| Characteristic | Without Mortgage | With Mortgage |
| Housing Units | 851 | 2,417 |
| Median Property Value | $243,300 | $255,600 |
| Median Household Income | $79,895 | $790 |
| Monthly Housing Costs | $391 | $138 |
| Real Estate Taxes | $612 | $183 |
Property Value by Mortgage Status in Meridianville
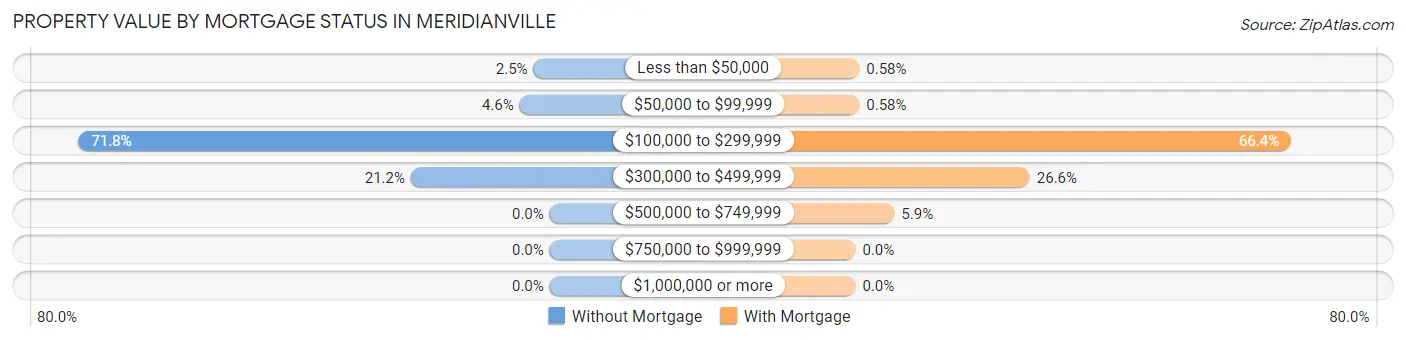
| Property Value | Without Mortgage | With Mortgage |
| Less than $50,000 | 21 (2.5%) | 14 (0.6%) |
| $50,000 to $99,999 | 39 (4.6%) | 14 (0.6%) |
| $100,000 to $299,999 | 611 (71.8%) | 1,604 (66.4%) |
| $300,000 to $499,999 | 180 (21.1%) | 642 (26.6%) |
| $500,000 to $749,999 | 0 (0.0%) | 143 (5.9%) |
| $750,000 to $999,999 | 0 (0.0%) | 0 (0.0%) |
| $1,000,000 or more | 0 (0.0%) | 0 (0.0%) |
| Total | 851 (100.0%) | 2,417 (100.0%) |
Household Income by Mortgage Status in Meridianville
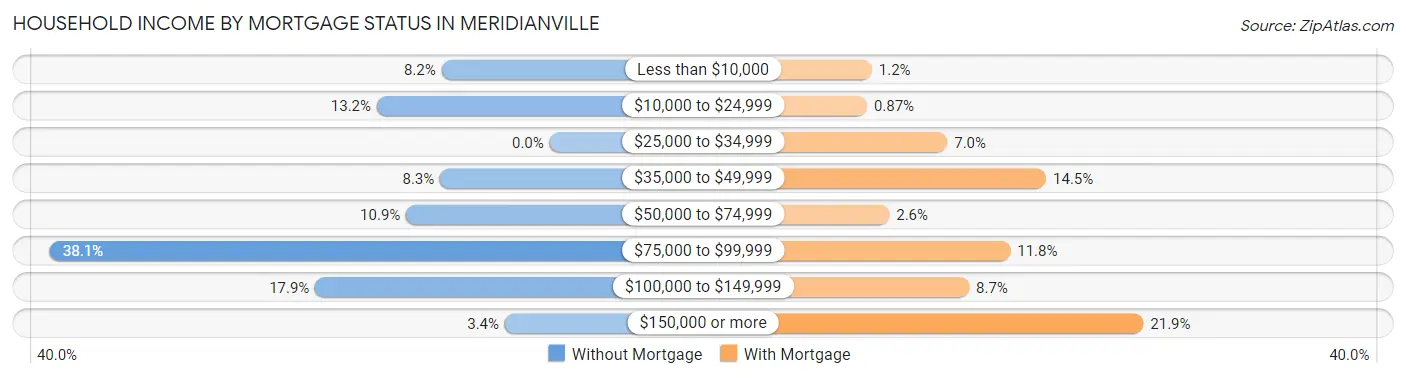
| Household Income | Without Mortgage | With Mortgage |
| Less than $10,000 | 70 (8.2%) | 30 (1.2%) |
| $10,000 to $24,999 | 112 (13.2%) | 21 (0.9%) |
| $25,000 to $34,999 | 0 (0.0%) | 169 (7.0%) |
| $35,000 to $49,999 | 71 (8.3%) | 351 (14.5%) |
| $50,000 to $74,999 | 93 (10.9%) | 62 (2.6%) |
| $75,000 to $99,999 | 324 (38.1%) | 285 (11.8%) |
| $100,000 to $149,999 | 152 (17.9%) | 209 (8.6%) |
| $150,000 or more | 29 (3.4%) | 530 (21.9%) |
| Total | 851 (100.0%) | 2,417 (100.0%) |
Property Value to Household Income Ratio in Meridianville
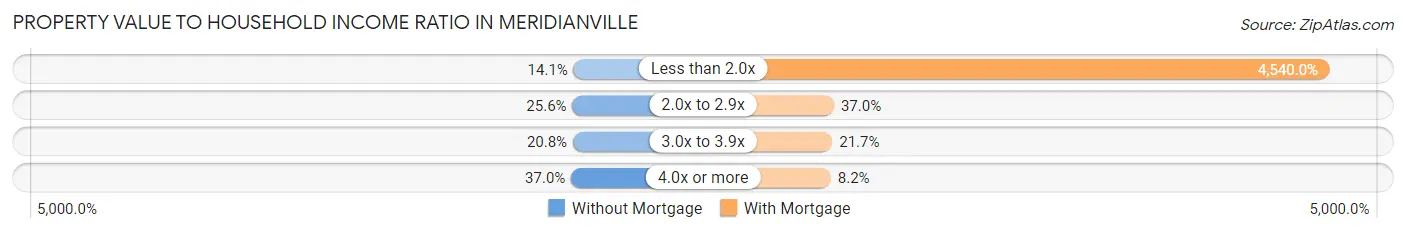
| Value-to-Income Ratio | Without Mortgage | With Mortgage |
| Less than 2.0x | 120 (14.1%) | 109,732 (4,540.0%) |
| 2.0x to 2.9x | 218 (25.6%) | 893 (36.9%) |
| 3.0x to 3.9x | 177 (20.8%) | 525 (21.7%) |
| 4.0x or more | 315 (37.0%) | 198 (8.2%) |
| Total | 851 (100.0%) | 2,417 (100.0%) |
Real Estate Taxes by Mortgage Status in Meridianville
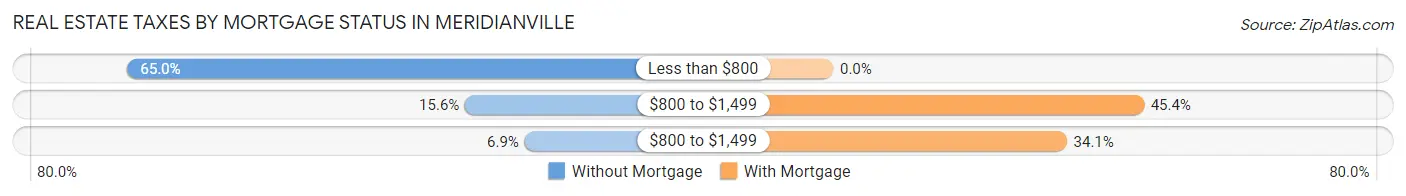
| Property Taxes | Without Mortgage | With Mortgage |
| Less than $800 | 553 (65.0%) | 0 (0.0%) |
| $800 to $1,499 | 133 (15.6%) | 1,097 (45.4%) |
| $800 to $1,499 | 59 (6.9%) | 825 (34.1%) |
| Total | 851 (100.0%) | 2,417 (100.0%) |
Health & Disability in Meridianville
Health Insurance Coverage by Age in Meridianville
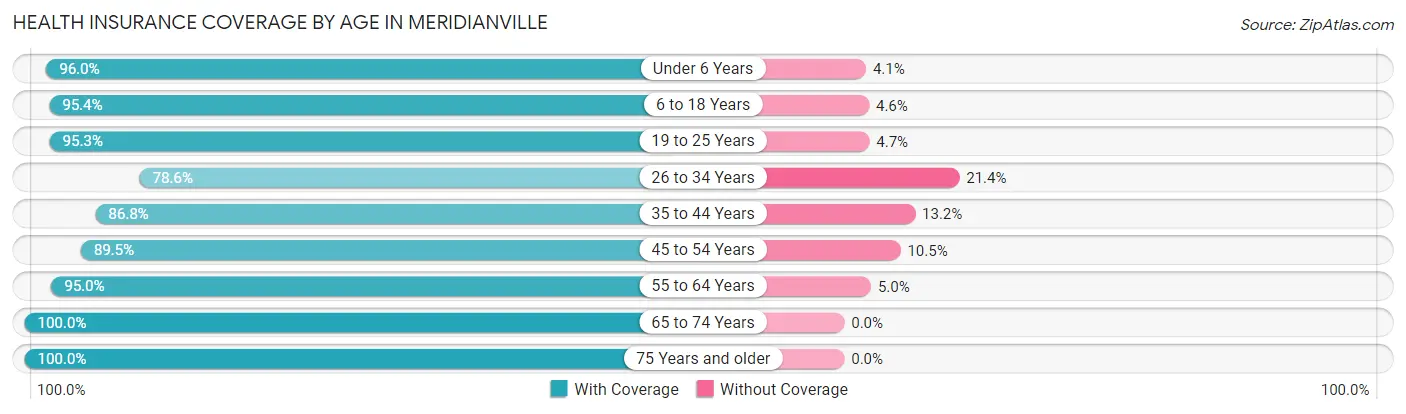
| Age Bracket | With Coverage | Without Coverage |
| Under 6 Years | 616 (96.0%) | 26 (4.1%) |
| 6 to 18 Years | 1,592 (95.4%) | 77 (4.6%) |
| 19 to 25 Years | 797 (95.3%) | 39 (4.7%) |
| 26 to 34 Years | 755 (78.6%) | 206 (21.4%) |
| 35 to 44 Years | 1,189 (86.8%) | 181 (13.2%) |
| 45 to 54 Years | 1,264 (89.5%) | 148 (10.5%) |
| 55 to 64 Years | 1,335 (95.0%) | 70 (5.0%) |
| 65 to 74 Years | 636 (100.0%) | 0 (0.0%) |
| 75 Years and older | 597 (100.0%) | 0 (0.0%) |
| Total | 8,781 (92.2%) | 747 (7.8%) |
Health Insurance Coverage by Citizenship Status in Meridianville
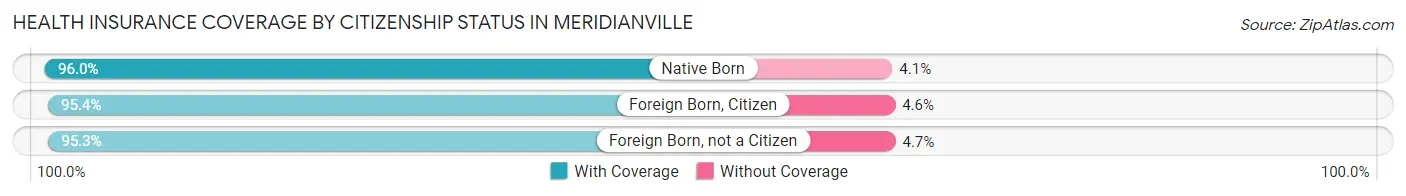
| Citizenship Status | With Coverage | Without Coverage |
| Native Born | 616 (96.0%) | 26 (4.1%) |
| Foreign Born, Citizen | 1,592 (95.4%) | 77 (4.6%) |
| Foreign Born, not a Citizen | 797 (95.3%) | 39 (4.7%) |
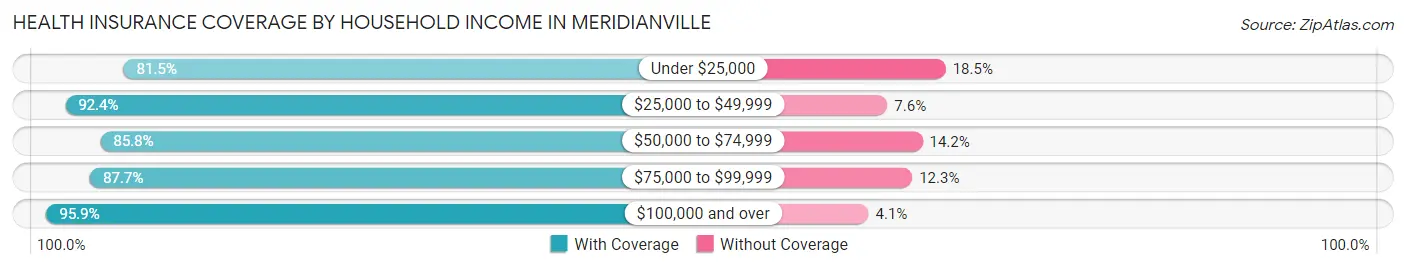
Health Insurance Coverage by Household Income in Meridianville
| Household Income | With Coverage | Without Coverage |
| Under $25,000 | 514 (81.5%) | 117 (18.5%) |
| $25,000 to $49,999 | 984 (92.4%) | 81 (7.6%) |
| $50,000 to $74,999 | 774 (85.8%) | 128 (14.2%) |
| $75,000 to $99,999 | 1,482 (87.7%) | 207 (12.3%) |
| $100,000 and over | 5,027 (95.9%) | 214 (4.1%) |
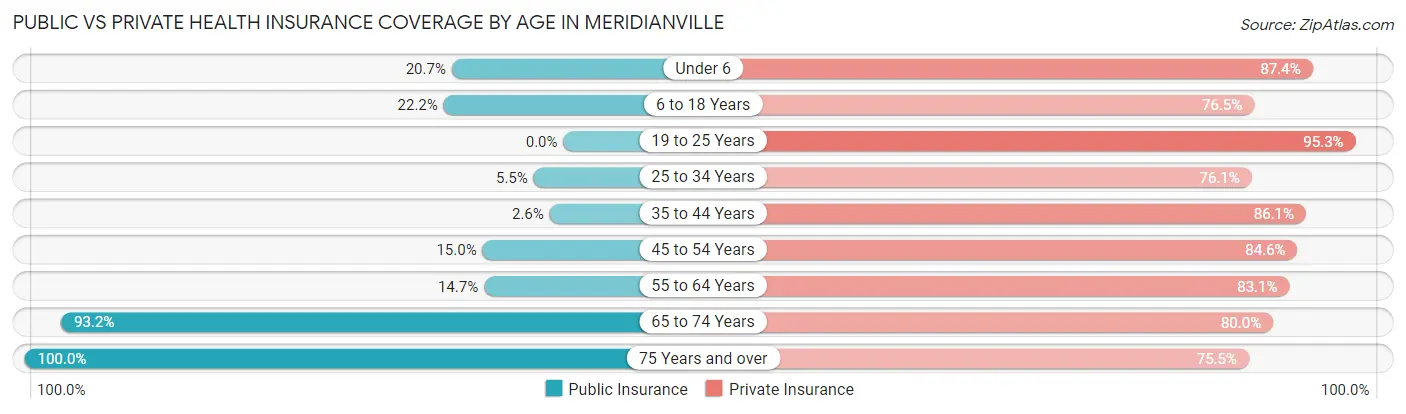
Public vs Private Health Insurance Coverage by Age in Meridianville
| Age Bracket | Public Insurance | Private Insurance |
| Under 6 | 133 (20.7%) | 561 (87.4%) |
| 6 to 18 Years | 371 (22.2%) | 1,277 (76.5%) |
| 19 to 25 Years | 0 (0.0%) | 797 (95.3%) |
| 25 to 34 Years | 53 (5.5%) | 731 (76.1%) |
| 35 to 44 Years | 35 (2.5%) | 1,180 (86.1%) |
| 45 to 54 Years | 212 (15.0%) | 1,194 (84.6%) |
| 55 to 64 Years | 207 (14.7%) | 1,167 (83.1%) |
| 65 to 74 Years | 593 (93.2%) | 509 (80.0%) |
| 75 Years and over | 597 (100.0%) | 451 (75.5%) |
| Total | 2,201 (23.1%) | 7,867 (82.6%) |
Disability Status by Sex by Age in Meridianville
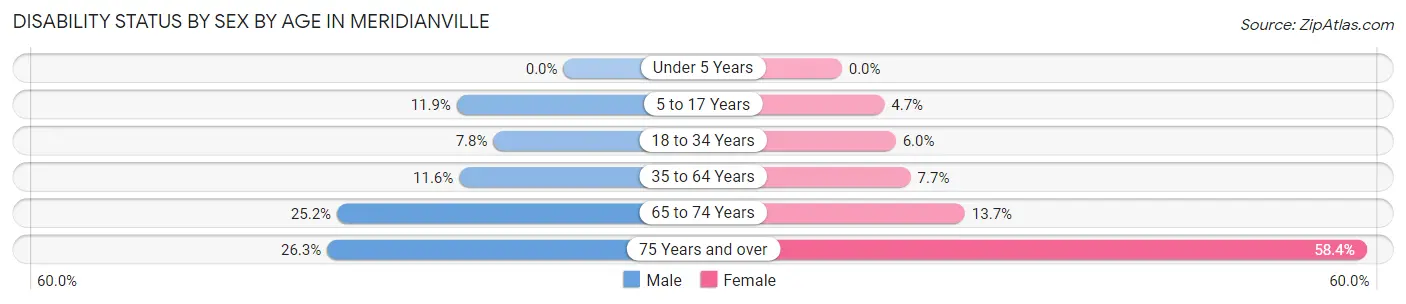
| Age Bracket | Male | Female |
| Under 5 Years | 0 (0.0%) | 0 (0.0%) |
| 5 to 17 Years | 114 (11.9%) | 35 (4.7%) |
| 18 to 34 Years | 87 (7.8%) | 45 (6.0%) |
| 35 to 64 Years | 206 (11.6%) | 185 (7.7%) |
| 65 to 74 Years | 85 (25.2%) | 41 (13.7%) |
| 75 Years and over | 40 (26.3%) | 260 (58.4%) |
Disability Class by Sex by Age in Meridianville
Disability Class: Hearing Difficulty
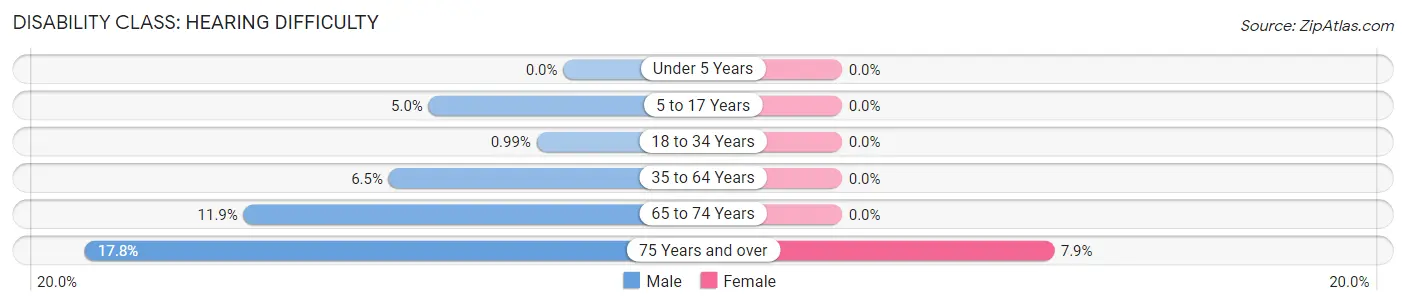
| Age Bracket | Male | Female |
| Under 5 Years | 0 (0.0%) | 0 (0.0%) |
| 5 to 17 Years | 48 (5.0%) | 0 (0.0%) |
| 18 to 34 Years | 11 (1.0%) | 0 (0.0%) |
| 35 to 64 Years | 115 (6.5%) | 0 (0.0%) |
| 65 to 74 Years | 40 (11.9%) | 0 (0.0%) |
| 75 Years and over | 27 (17.8%) | 35 (7.9%) |
Disability Class: Vision Difficulty
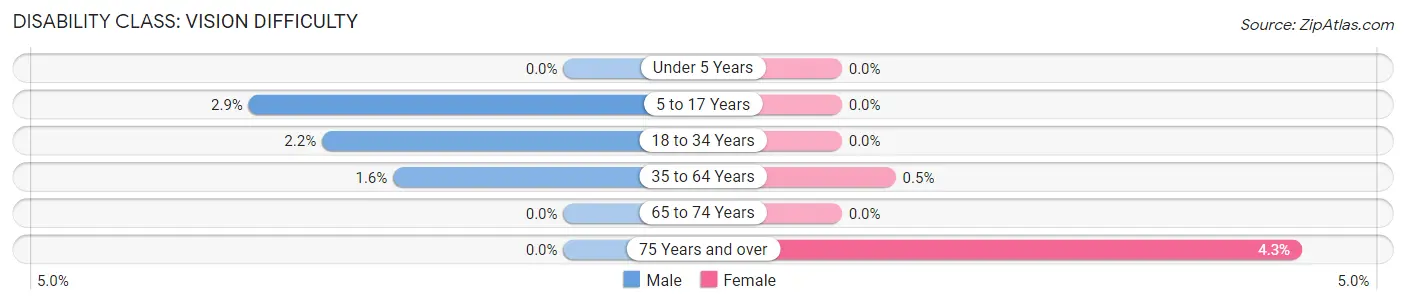
| Age Bracket | Male | Female |
| Under 5 Years | 0 (0.0%) | 0 (0.0%) |
| 5 to 17 Years | 28 (2.9%) | 0 (0.0%) |
| 18 to 34 Years | 25 (2.2%) | 0 (0.0%) |
| 35 to 64 Years | 28 (1.6%) | 12 (0.5%) |
| 65 to 74 Years | 0 (0.0%) | 0 (0.0%) |
| 75 Years and over | 0 (0.0%) | 19 (4.3%) |
Disability Class: Cognitive Difficulty
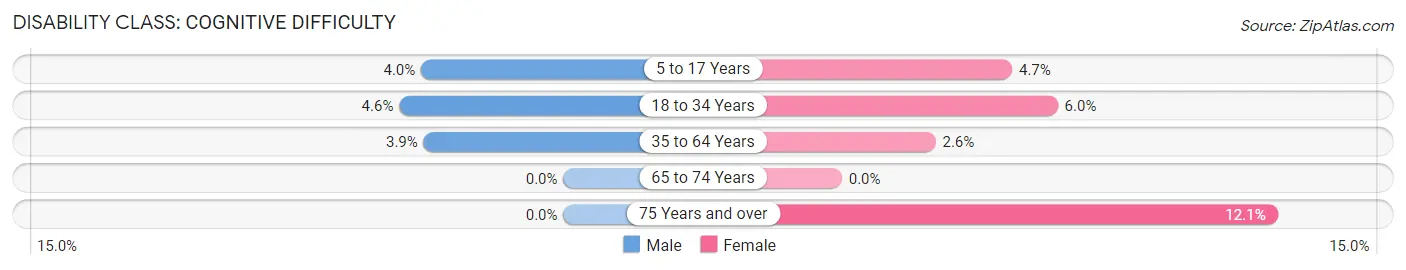
| Age Bracket | Male | Female |
| 5 to 17 Years | 38 (4.0%) | 35 (4.7%) |
| 18 to 34 Years | 51 (4.6%) | 45 (6.0%) |
| 35 to 64 Years | 69 (3.9%) | 63 (2.6%) |
| 65 to 74 Years | 0 (0.0%) | 0 (0.0%) |
| 75 Years and over | 0 (0.0%) | 54 (12.1%) |
Disability Class: Ambulatory Difficulty
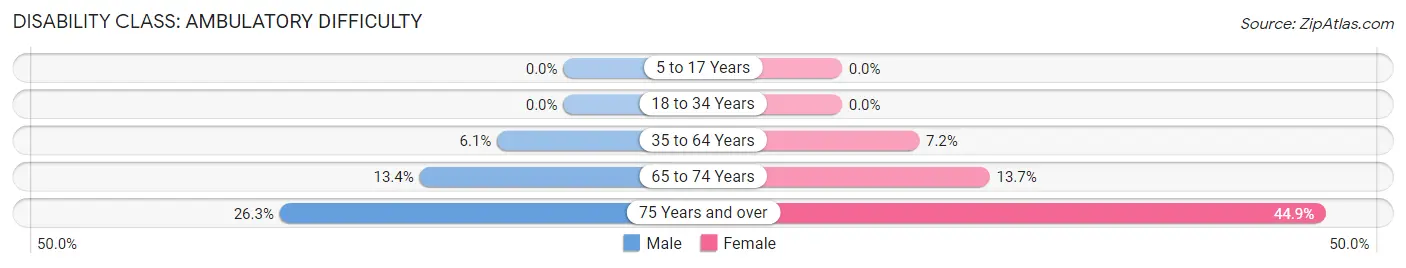
| Age Bracket | Male | Female |
| 5 to 17 Years | 0 (0.0%) | 0 (0.0%) |
| 18 to 34 Years | 0 (0.0%) | 0 (0.0%) |
| 35 to 64 Years | 109 (6.1%) | 173 (7.2%) |
| 65 to 74 Years | 45 (13.4%) | 41 (13.7%) |
| 75 Years and over | 40 (26.3%) | 200 (44.9%) |
Disability Class: Self-Care Difficulty
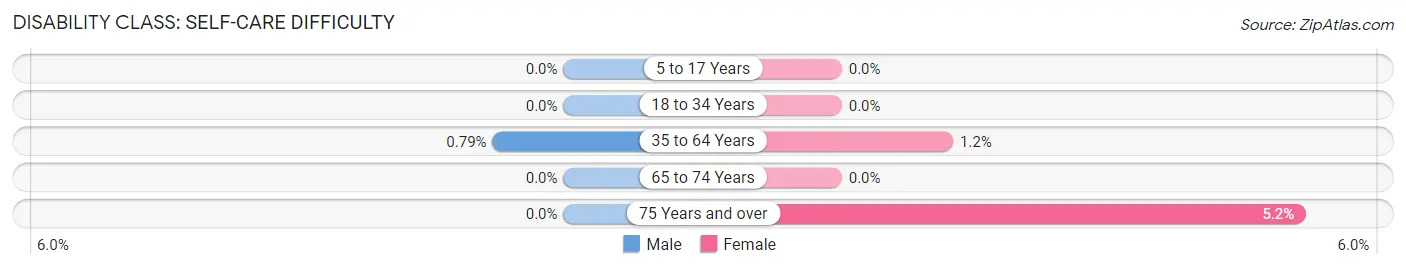
| Age Bracket | Male | Female |
| 5 to 17 Years | 0 (0.0%) | 0 (0.0%) |
| 18 to 34 Years | 0 (0.0%) | 0 (0.0%) |
| 35 to 64 Years | 14 (0.8%) | 30 (1.2%) |
| 65 to 74 Years | 0 (0.0%) | 0 (0.0%) |
| 75 Years and over | 0 (0.0%) | 23 (5.2%) |
Technology Access in Meridianville
Computing Device Access in Meridianville
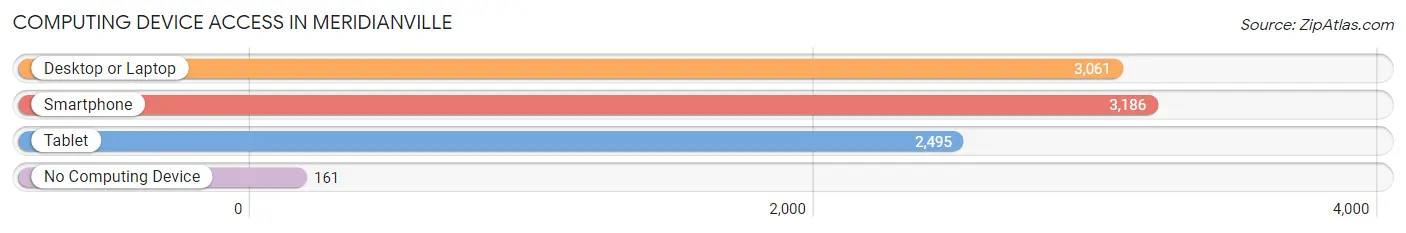
| Device Type | # Households | % Households |
| Desktop or Laptop | 3,061 | 87.6% |
| Smartphone | 3,186 | 91.1% |
| Tablet | 2,495 | 71.4% |
| No Computing Device | 161 | 4.6% |
| Total | 3,496 | 100.0% |
Internet Access in Meridianville
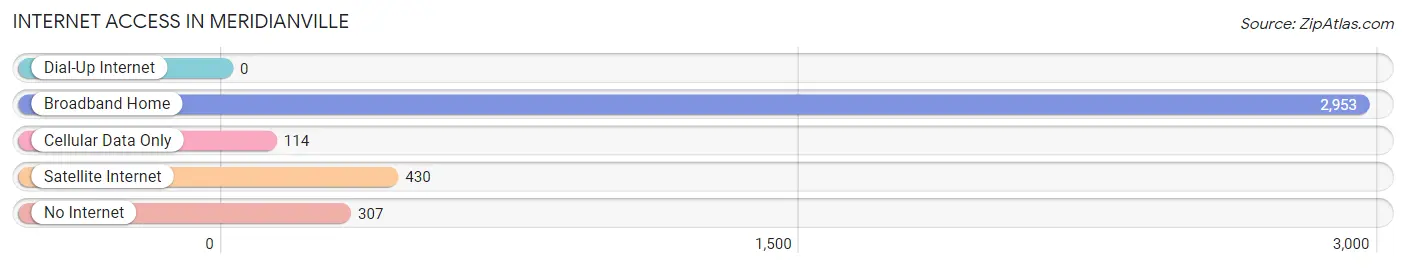
| Internet Type | # Households | % Households |
| Dial-Up Internet | 0 | 0.0% |
| Broadband Home | 2,953 | 84.5% |
| Cellular Data Only | 114 | 3.3% |
| Satellite Internet | 430 | 12.3% |
| No Internet | 307 | 8.8% |
| Total | 3,496 | 100.0% |
Meridianville Summary
Meridianville is a small unincorporated community located in Madison County, Alabama, United States. It is situated in the northern part of the county, approximately 15 miles north of Huntsville. The population of Meridianville was estimated to be 4,845 in 2019.
History
Meridianville was first settled in the early 1800s by settlers from North Carolina and Virginia. The town was originally known as "Meridian Crossroads" due to its location at the intersection of two major roads. The town was later renamed Meridianville in 1836.
In the late 1800s, Meridianville was a thriving agricultural community. The town was home to several cotton gins, a grist mill, and a sawmill. The town also had a post office, a general store, and a blacksmith shop.
In the early 1900s, Meridianville began to experience a period of growth and development. The town was home to several churches, a school, and a number of businesses. The town also had a train station, which allowed for easy access to Huntsville and other nearby towns.
Geography
Meridianville is located in northern Madison County, approximately 15 miles north of Huntsville. The town is situated at the intersection of two major roads, US Highway 231 and Alabama Highway 53. The town is surrounded by rolling hills and is located near the Flint River.
The climate in Meridianville is humid subtropical, with hot summers and mild winters. The average annual temperature is around 68 degrees Fahrenheit. The average annual precipitation is around 50 inches.
Economy
The economy of Meridianville is largely based on agriculture and manufacturing. The town is home to several farms, which produce a variety of crops, including cotton, corn, soybeans, and wheat. The town is also home to several manufacturing companies, which produce a variety of products, including automotive parts, furniture, and textiles.
The town is also home to several retail stores, restaurants, and other businesses. The town is served by several major highways, which provide easy access to nearby towns and cities.
Demographics
As of the 2019 census, the population of Meridianville was estimated to be 4,845. The racial makeup of the town was 79.3% White, 16.2% African American, 0.7% Native American, 0.7% Asian, 0.1% Pacific Islander, and 2.9% from other races. The median household income was $50,945, and the median family income was $60,945.
The town is served by the Madison County School District, which includes several elementary, middle, and high schools. The town is also home to several churches, including Baptist, Methodist, and Presbyterian.
Conclusion
Meridianville is a small unincorporated community located in Madison County, Alabama. The town has a long history, dating back to the early 1800s. The town is largely agricultural and is home to several farms and manufacturing companies. The town is also home to several retail stores, restaurants, and other businesses. The population of Meridianville was estimated to be 4,845 in 2019.
Common Questions
What is Per Capita Income in Meridianville?
Per Capita income in Meridianville is $40,086.
What is the Median Family Income in Meridianville?
Median Family Income in Meridianville is $104,323.
What is the Median Household income in Meridianville?
Median Household Income in Meridianville is $92,443.
What is Income or Wage Gap in Meridianville?
Income or Wage Gap in Meridianville is 50.0%.
Women in Meridianville earn 50.0 cents for every dollar earned by a man.
What is Inequality or Gini Index in Meridianville?
Inequality or Gini Index in Meridianville is 0.40.
What is the Total Population of Meridianville?
Total Population of Meridianville is 9,528.
What is the Total Male Population of Meridianville?
Total Male Population of Meridianville is 4,519.
What is the Total Female Population of Meridianville?
Total Female Population of Meridianville is 5,009.
What is the Ratio of Males per 100 Females in Meridianville?
There are 90.22 Males per 100 Females in Meridianville.
What is the Ratio of Females per 100 Males in Meridianville?
There are 110.84 Females per 100 Males in Meridianville.
What is the Median Population Age in Meridianville?
Median Population Age in Meridianville is 38.8 Years.
What is the Average Family Size in Meridianville
Average Family Size in Meridianville is 3.2 People.
What is the Average Household Size in Meridianville
Average Household Size in Meridianville is 2.7 People.
How Large is the Labor Force in Meridianville?
There are 5,051 People in the Labor Forcein in Meridianville.
What is the Percentage of People in the Labor Force in Meridianville?
67.1% of People are in the Labor Force in Meridianville.
What is the Unemployment Rate in Meridianville?
Unemployment Rate in Meridianville is 7.2%.