Samson, AL
Samson Map
Samson Overview
1,513
TOTAL POPULATION
753
MALE POPULATION
760
FEMALE POPULATION
99.08
MALES / 100 FEMALES
100.93
FEMALES / 100 MALES
44.5
MEDIAN AGE
3.1
AVG FAMILY SIZE
2.4
AVG HOUSEHOLD SIZE
$22,198
PER CAPITA INCOME
$45,000
AVG FAMILY INCOME
$29,338
AVG HOUSEHOLD INCOME
23.4%
WAGE / INCOME GAP [ % ]
76.6¢/ $1
WAGE / INCOME GAP [ $ ]
0.54
INEQUALITY / GINI INDEX
590
LABOR FORCE [ PEOPLE ]
47.3%
PERCENT IN LABOR FORCE
12.5%
UNEMPLOYMENT RATE
Samson Zip Codes
Samson Area Codes
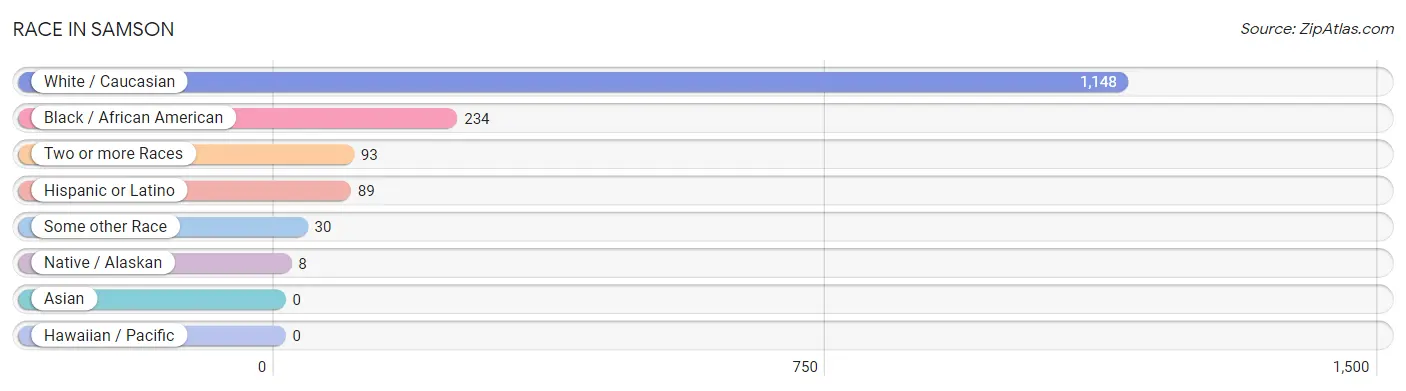
Race in Samson
The most populous races in Samson are White / Caucasian (1,148 | 75.9%), Black / African American (234 | 15.5%), and Two or more Races (93 | 6.1%).
| Race | # Population | % Population |
| Asian | 0 | 0.0% |
| Black / African American | 234 | 15.5% |
| Hawaiian / Pacific | 0 | 0.0% |
| Hispanic or Latino | 89 | 5.9% |
| Native / Alaskan | 8 | 0.5% |
| White / Caucasian | 1,148 | 75.9% |
| Two or more Races | 93 | 6.1% |
| Some other Race | 30 | 2.0% |
| Total | 1,513 | 100.0% |
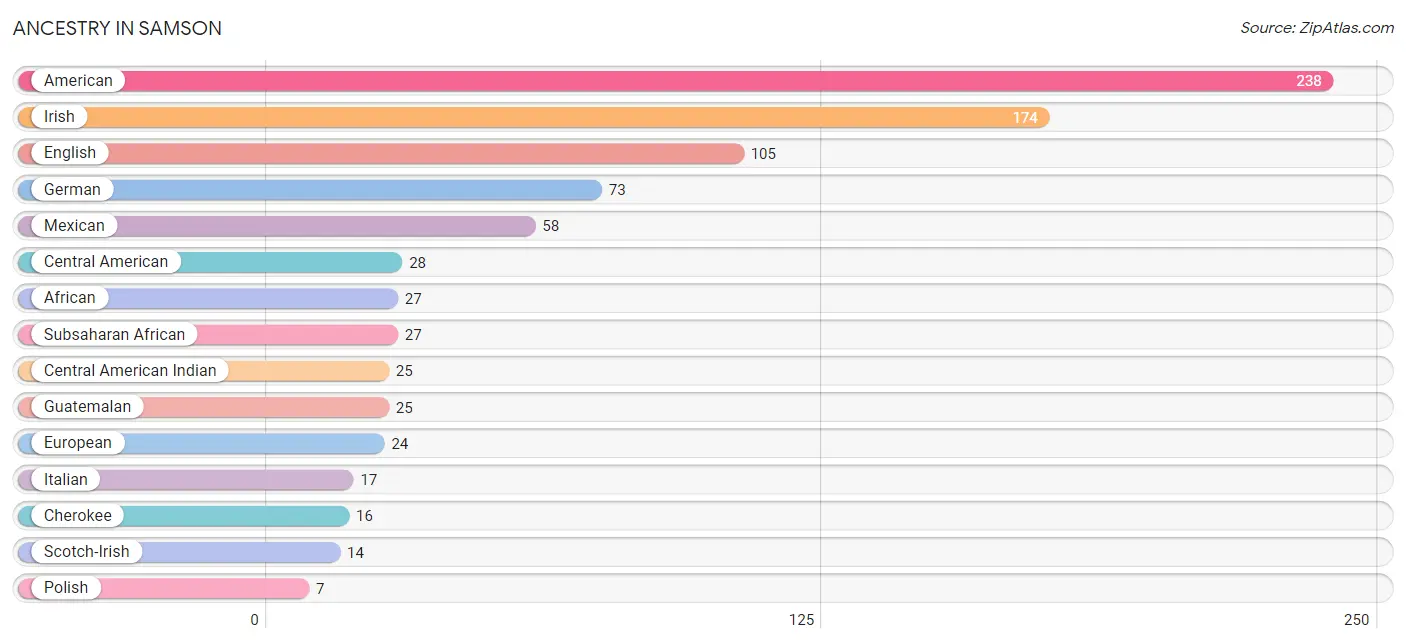
Ancestry in Samson
The most populous ancestries reported in Samson are American (238 | 15.7%), Irish (174 | 11.5%), English (105 | 6.9%), German (73 | 4.8%), and Mexican (58 | 3.8%), together accounting for 42.8% of all Samson residents.
| Ancestry | # Population | % Population |
| African | 27 | 1.8% |
| American | 238 | 15.7% |
| Austrian | 2 | 0.1% |
| Blackfeet | 1 | 0.1% |
| Central American | 28 | 1.8% |
| Central American Indian | 25 | 1.7% |
| Cherokee | 16 | 1.1% |
| Cuban | 3 | 0.2% |
| Czechoslovakian | 3 | 0.2% |
| Dutch | 2 | 0.1% |
| Eastern European | 2 | 0.1% |
| English | 105 | 6.9% |
| European | 24 | 1.6% |
| French | 2 | 0.1% |
| German | 73 | 4.8% |
| Guatemalan | 25 | 1.7% |
| Irish | 174 | 11.5% |
| Italian | 17 | 1.1% |
| Mexican | 58 | 3.8% |
| Nicaraguan | 3 | 0.2% |
| Norwegian | 3 | 0.2% |
| Polish | 7 | 0.5% |
| Scotch-Irish | 14 | 0.9% |
| Scottish | 7 | 0.5% |
| Subsaharan African | 27 | 1.8% |
| Welsh | 5 | 0.3% | View All 26 Rows |
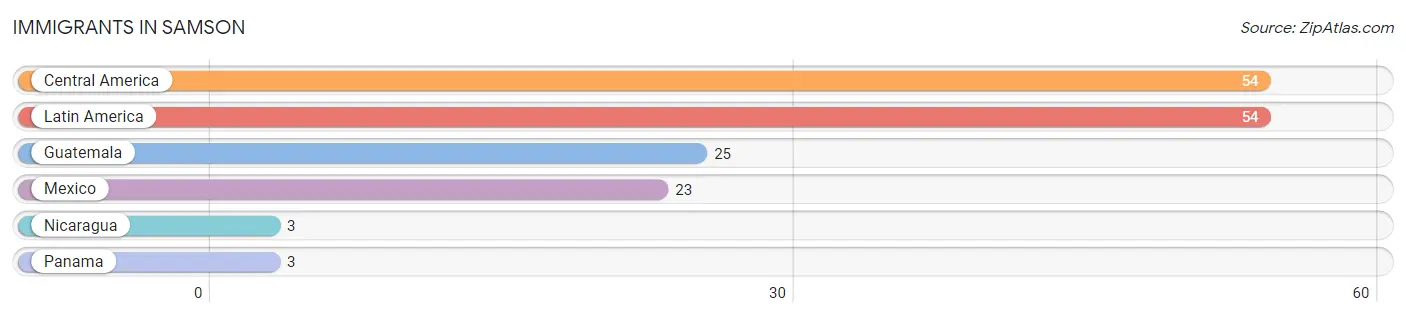
Immigrants in Samson
The most numerous immigrant groups reported in Samson came from Central America (54 | 3.6%), Latin America (54 | 3.6%), Guatemala (25 | 1.7%), Mexico (23 | 1.5%), and Nicaragua (3 | 0.2%), together accounting for 10.5% of all Samson residents.
| Immigration Origin | # Population | % Population |
| Central America | 54 | 3.6% |
| Guatemala | 25 | 1.7% |
| Latin America | 54 | 3.6% |
| Mexico | 23 | 1.5% |
| Nicaragua | 3 | 0.2% |
| Panama | 3 | 0.2% | View All 6 Rows |
Sex and Age in Samson
Sex and Age in Samson
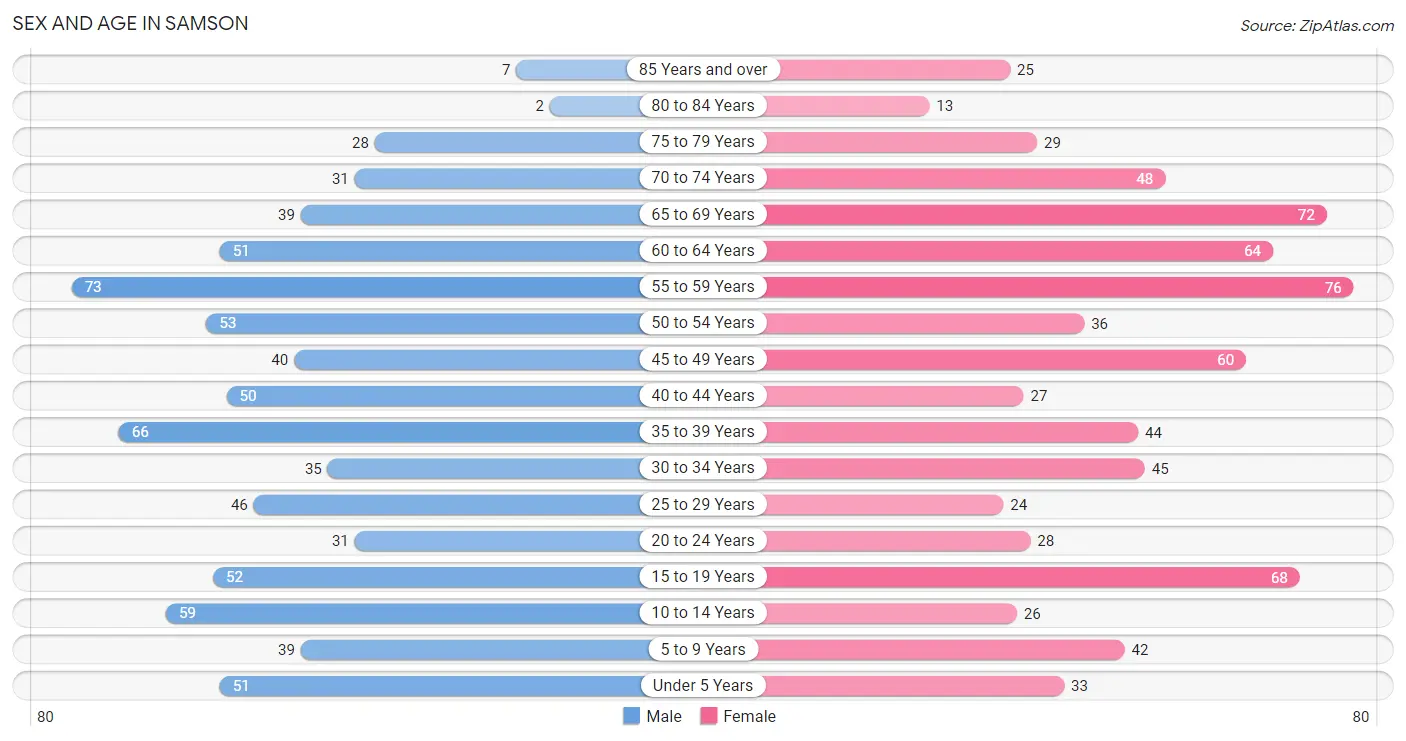
The most populous age groups in Samson are 55 to 59 Years (73 | 9.7%) for men and 55 to 59 Years (76 | 10.0%) for women.
| Age Bracket | Male | Female |
| Under 5 Years | 51 (6.8%) | 33 (4.3%) |
| 5 to 9 Years | 39 (5.2%) | 42 (5.5%) |
| 10 to 14 Years | 59 (7.8%) | 26 (3.4%) |
| 15 to 19 Years | 52 (6.9%) | 68 (8.9%) |
| 20 to 24 Years | 31 (4.1%) | 28 (3.7%) |
| 25 to 29 Years | 46 (6.1%) | 24 (3.2%) |
| 30 to 34 Years | 35 (4.6%) | 45 (5.9%) |
| 35 to 39 Years | 66 (8.8%) | 44 (5.8%) |
| 40 to 44 Years | 50 (6.6%) | 27 (3.5%) |
| 45 to 49 Years | 40 (5.3%) | 60 (7.9%) |
| 50 to 54 Years | 53 (7.0%) | 36 (4.7%) |
| 55 to 59 Years | 73 (9.7%) | 76 (10.0%) |
| 60 to 64 Years | 51 (6.8%) | 64 (8.4%) |
| 65 to 69 Years | 39 (5.2%) | 72 (9.5%) |
| 70 to 74 Years | 31 (4.1%) | 48 (6.3%) |
| 75 to 79 Years | 28 (3.7%) | 29 (3.8%) |
| 80 to 84 Years | 2 (0.3%) | 13 (1.7%) |
| 85 Years and over | 7 (0.9%) | 25 (3.3%) |
| Total | 753 (100.0%) | 760 (100.0%) |
Families and Households in Samson
Median Family Size in Samson
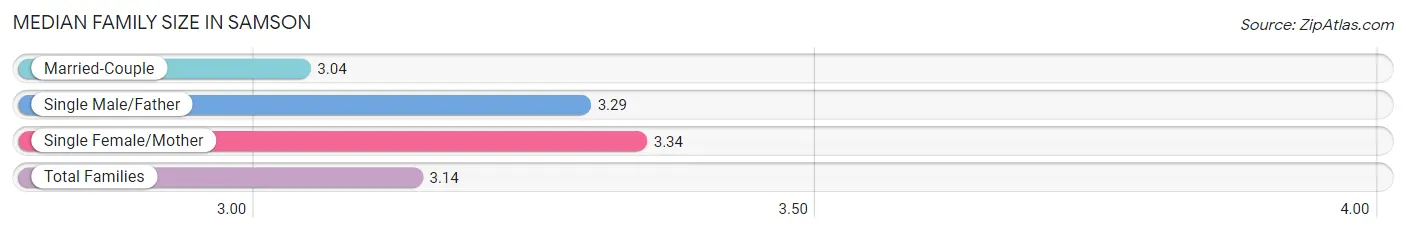
The median family size in Samson is 3.14 persons per family, with single female/mother families (101 | 27.3%) accounting for the largest median family size of 3.34 persons per family. On the other hand, married-couple families (241 | 65.1%) represent the smallest median family size with 3.04 persons per family.
| Family Type | # Families | Family Size |
| Married-Couple | 241 (65.1%) | 3.04 |
| Single Male/Father | 28 (7.6%) | 3.29 |
| Single Female/Mother | 101 (27.3%) | 3.34 |
| Total Families | 370 (100.0%) | 3.14 |
Median Household Size in Samson
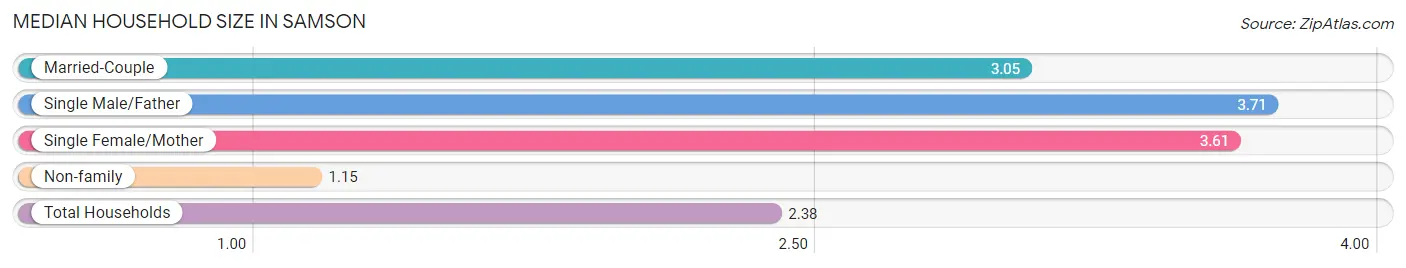
The median household size in Samson is 2.38 persons per household, with single male/father households (28 | 4.4%) accounting for the largest median household size of 3.71 persons per household. non-family households (265 | 41.7%) represent the smallest median household size with 1.15 persons per household.
| Household Type | # Households | Household Size |
| Married-Couple | 241 (38.0%) | 3.05 |
| Single Male/Father | 28 (4.4%) | 3.71 |
| Single Female/Mother | 101 (15.9%) | 3.61 |
| Non-family | 265 (41.7%) | 1.15 |
| Total Households | 635 (100.0%) | 2.38 |
Household Size by Marriage Status in Samson
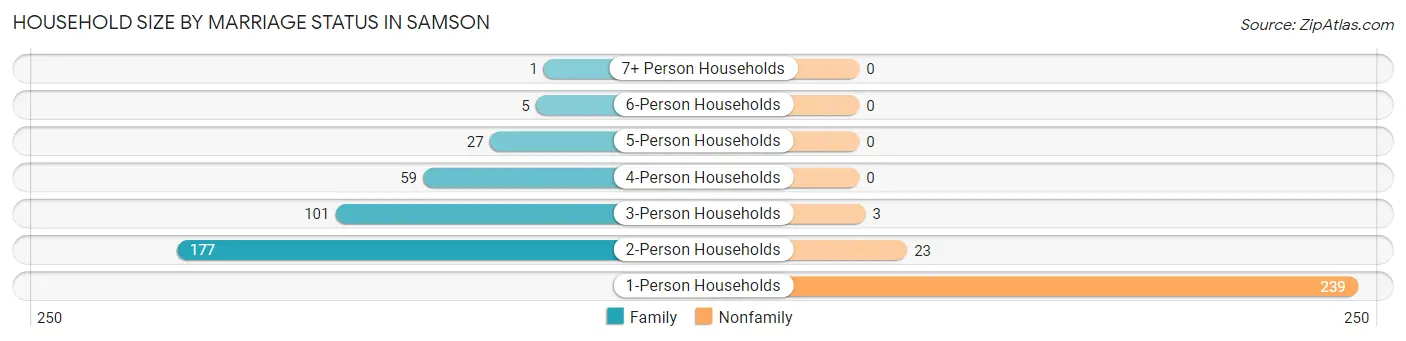
Out of a total of 635 households in Samson, 370 (58.3%) are family households, while 265 (41.7%) are nonfamily households. The most numerous type of family households are 2-person households, comprising 177, and the most common type of nonfamily households are 1-person households, comprising 239.
| Household Size | Family Households | Nonfamily Households |
| 1-Person Households | - | 239 (37.6%) |
| 2-Person Households | 177 (27.9%) | 23 (3.6%) |
| 3-Person Households | 101 (15.9%) | 3 (0.5%) |
| 4-Person Households | 59 (9.3%) | 0 (0.0%) |
| 5-Person Households | 27 (4.3%) | 0 (0.0%) |
| 6-Person Households | 5 (0.8%) | 0 (0.0%) |
| 7+ Person Households | 1 (0.2%) | 0 (0.0%) |
| Total | 370 (58.3%) | 265 (41.7%) |
Female Fertility in Samson
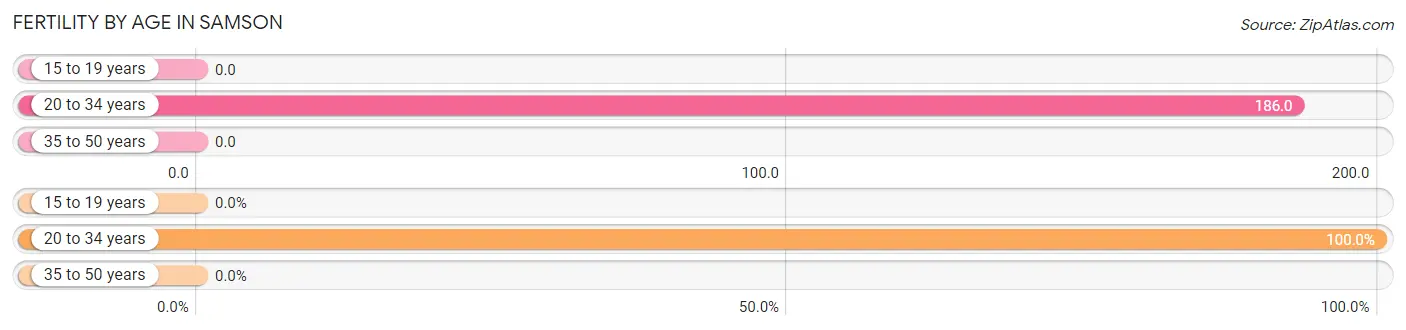
Fertility by Age in Samson
Average fertility rate in Samson is 56.0 births per 1,000 women. Women in the age bracket of 20 to 34 years have the highest fertility rate with 186.0 births per 1,000 women. Women in the age bracket of 20 to 34 years acount for 100.0% of all women with births.
| Age Bracket | Women with Births | Births / 1,000 Women |
| 15 to 19 years | 0 (0.0%) | 0.0 |
| 20 to 34 years | 18 (100.0%) | 186.0 |
| 35 to 50 years | 0 (0.0%) | 0.0 |
| Total | 18 (100.0%) | 56.0 |
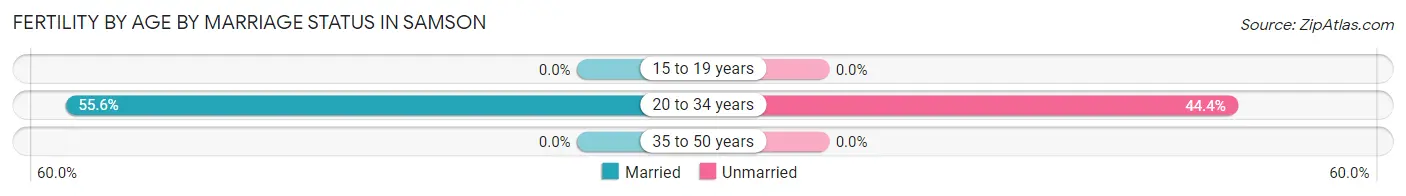
Fertility by Age by Marriage Status in Samson
55.6% of women with births (18) in Samson are married. The highest percentage of unmarried women with births falls into 20 to 34 years age bracket with 44.4% of them unmarried at the time of birth, while the lowest percentage of unmarried women with births belong to 20 to 34 years age bracket with 44.4% of them unmarried.
| Age Bracket | Married | Unmarried |
| 15 to 19 years | 0 (0.0%) | 0 (0.0%) |
| 20 to 34 years | 10 (55.6%) | 8 (44.4%) |
| 35 to 50 years | 0 (0.0%) | 0 (0.0%) |
| Total | 10 (55.6%) | 8 (44.4%) |
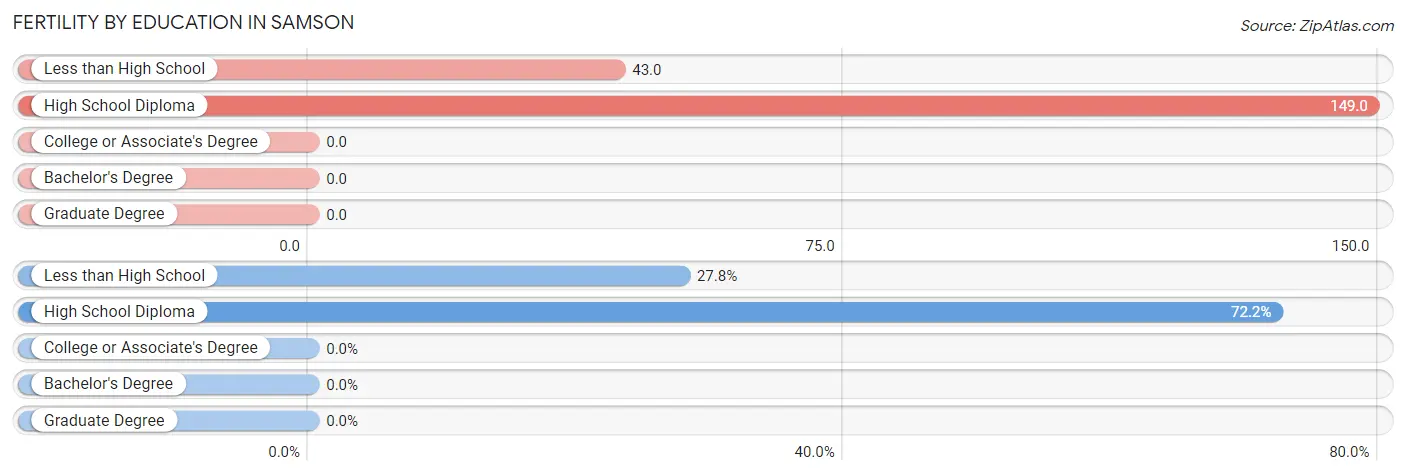
Fertility by Education in Samson
| Educational Attainment | Women with Births | Births / 1,000 Women |
| Less than High School | 5 (27.8%) | 43.0 |
| High School Diploma | 13 (72.2%) | 149.0 |
| College or Associate's Degree | 0 (0.0%) | 0.0 |
| Bachelor's Degree | 0 (0.0%) | 0.0 |
| Graduate Degree | 0 (0.0%) | 0.0 |
| Total | 18 (100.0%) | 56.0 |
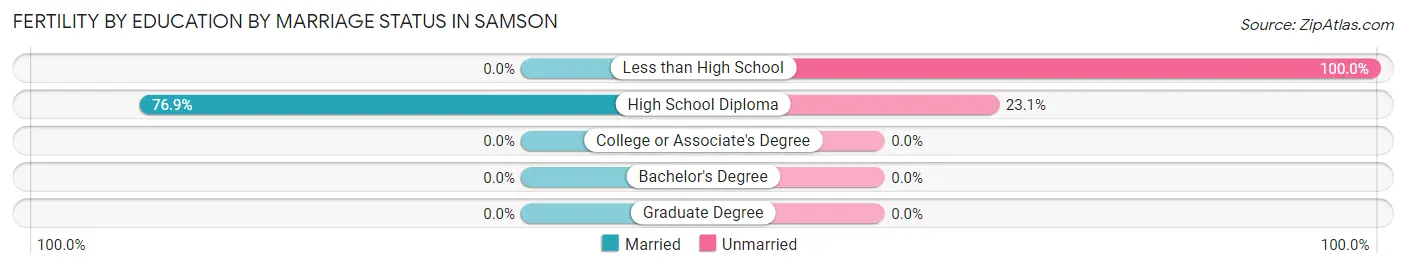
Fertility by Education by Marriage Status in Samson
44.4% of women with births in Samson are unmarried. Women with the educational attainment of high school diploma are most likely to be married with 76.9% of them married at childbirth, while women with the educational attainment of less than high school are least likely to be married with 100.0% of them unmarried at childbirth.
| Educational Attainment | Married | Unmarried |
| Less than High School | 0 (0.0%) | 5 (100.0%) |
| High School Diploma | 10 (76.9%) | 3 (23.1%) |
| College or Associate's Degree | 0 (0.0%) | 0 (0.0%) |
| Bachelor's Degree | 0 (0.0%) | 0 (0.0%) |
| Graduate Degree | 0 (0.0%) | 0 (0.0%) |
| Total | 10 (55.6%) | 8 (44.4%) |
Income in Samson
Income Overview in Samson
Per Capita Income in Samson is $22,198, while median incomes of families and households are $45,000 and $29,338 respectively.
| Characteristic | Number | Measure |
| Per Capita Income | 1,513 | $22,198 |
| Median Family Income | 370 | $45,000 |
| Mean Family Income | 370 | $60,122 |
| Median Household Income | 635 | $29,338 |
| Mean Household Income | 635 | $51,634 |
| Income Deficit | 370 | $0 |
| Wage / Income Gap (%) | 1,513 | 23.44% |
| Wage / Income Gap ($) | 1,513 | 76.56¢ per $1 |
| Gini / Inequality Index | 1,513 | 0.54 |
Earnings by Sex in Samson
Average Earnings in Samson are $27,400, $32,826 for men and $25,132 for women, a difference of 23.4%.
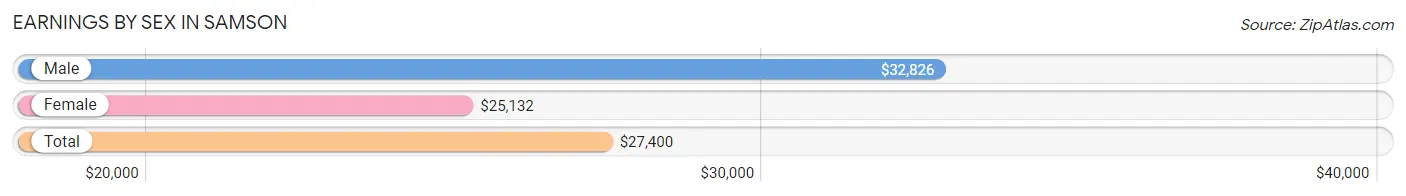
| Sex | Number | Average Earnings |
| Male | 302 (52.2%) | $32,826 |
| Female | 276 (47.7%) | $25,132 |
| Total | 578 (100.0%) | $27,400 |
Earnings by Sex by Income Bracket in Samson
The most common earnings brackets in Samson are $25,000 to $29,999 for men (46 | 15.2%) and $25,000 to $29,999 for women (62 | 22.5%).
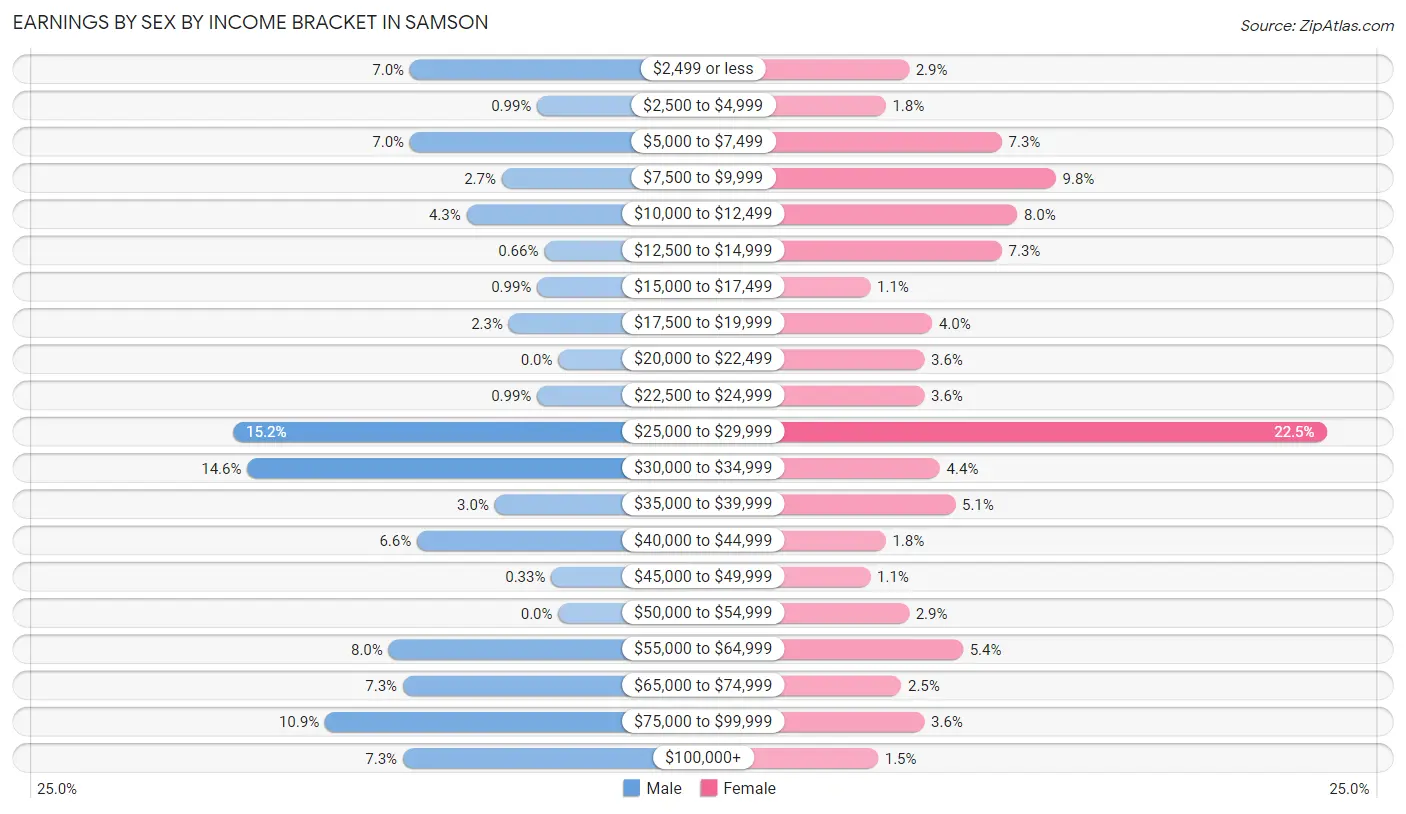
| Income | Male | Female |
| $2,499 or less | 21 (7.0%) | 8 (2.9%) |
| $2,500 to $4,999 | 3 (1.0%) | 5 (1.8%) |
| $5,000 to $7,499 | 21 (7.0%) | 20 (7.2%) |
| $7,500 to $9,999 | 8 (2.6%) | 27 (9.8%) |
| $10,000 to $12,499 | 13 (4.3%) | 22 (8.0%) |
| $12,500 to $14,999 | 2 (0.7%) | 20 (7.2%) |
| $15,000 to $17,499 | 3 (1.0%) | 3 (1.1%) |
| $17,500 to $19,999 | 7 (2.3%) | 11 (4.0%) |
| $20,000 to $22,499 | 0 (0.0%) | 10 (3.6%) |
| $22,500 to $24,999 | 3 (1.0%) | 10 (3.6%) |
| $25,000 to $29,999 | 46 (15.2%) | 62 (22.5%) |
| $30,000 to $34,999 | 44 (14.6%) | 12 (4.3%) |
| $35,000 to $39,999 | 9 (3.0%) | 14 (5.1%) |
| $40,000 to $44,999 | 20 (6.6%) | 5 (1.8%) |
| $45,000 to $49,999 | 1 (0.3%) | 3 (1.1%) |
| $50,000 to $54,999 | 0 (0.0%) | 8 (2.9%) |
| $55,000 to $64,999 | 24 (8.0%) | 15 (5.4%) |
| $65,000 to $74,999 | 22 (7.3%) | 7 (2.5%) |
| $75,000 to $99,999 | 33 (10.9%) | 10 (3.6%) |
| $100,000+ | 22 (7.3%) | 4 (1.5%) |
| Total | 302 (100.0%) | 276 (100.0%) |
Earnings by Sex by Educational Attainment in Samson
Average earnings in Samson are $33,203 for men and $25,395 for women, a difference of 23.5%. Men with an educational attainment of college or associate's degree enjoy the highest average annual earnings of $41,250, while those with high school diploma education earn the least with $27,457. Women with an educational attainment of bachelor's degree earn the most with the average annual earnings of $44,500, while those with high school diploma education have the smallest earnings of $14,375.
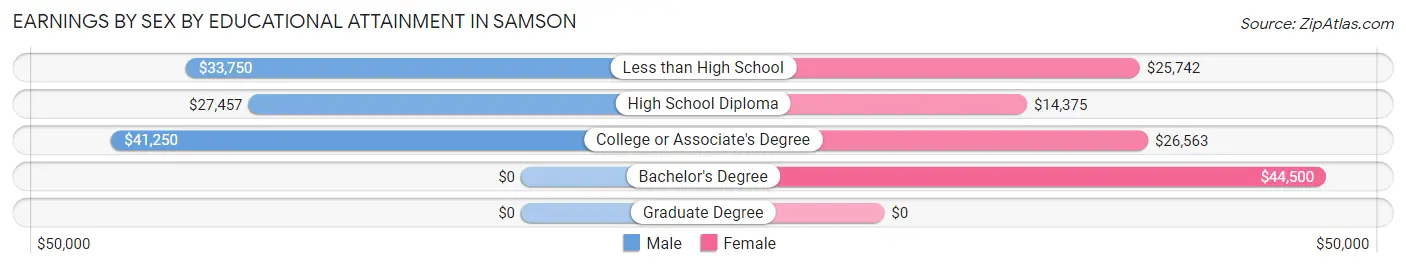
| Educational Attainment | Male Income | Female Income |
| Less than High School | $33,750 | $25,742 |
| High School Diploma | $27,457 | $14,375 |
| College or Associate's Degree | $41,250 | $26,563 |
| Bachelor's Degree | - | - |
| Graduate Degree | - | - |
| Total | $33,203 | $25,395 |
Family Income in Samson
Family Income Brackets in Samson
According to the Samson family income data, there are 59 families falling into the $15,000 to $24,999 income range, which is the most common income bracket and makes up 16.0% of all families. Conversely, the $200,000+ income bracket is the least frequent group with only 3 families (0.8%) belonging to this category.
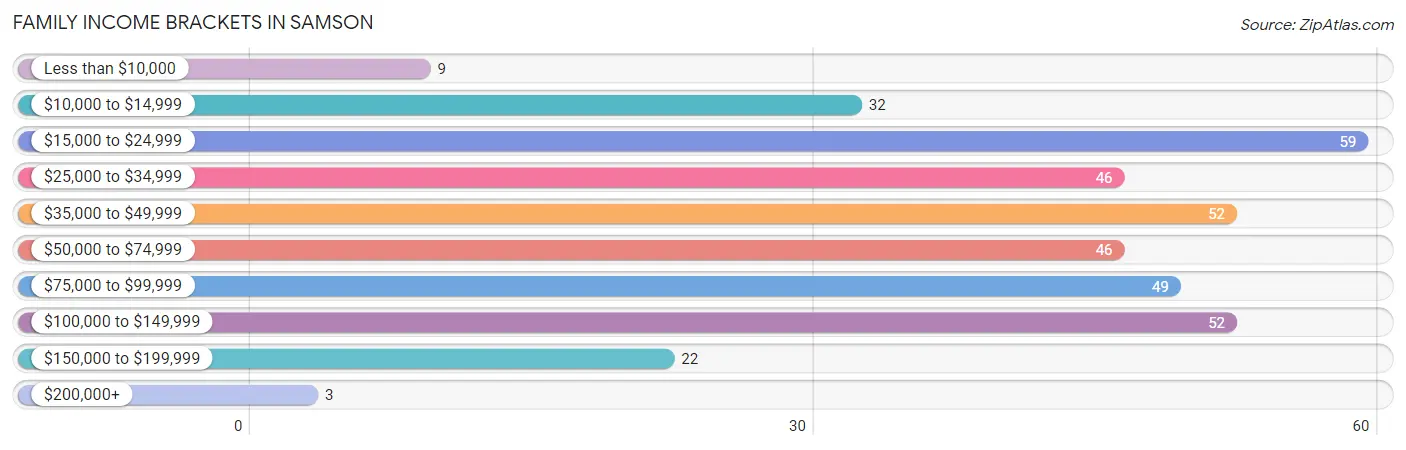
| Income Bracket | # Families | % Families |
| Less than $10,000 | 9 | 2.4% |
| $10,000 to $14,999 | 32 | 8.6% |
| $15,000 to $24,999 | 59 | 15.9% |
| $25,000 to $34,999 | 46 | 12.4% |
| $35,000 to $49,999 | 52 | 14.1% |
| $50,000 to $74,999 | 46 | 12.4% |
| $75,000 to $99,999 | 49 | 13.2% |
| $100,000 to $149,999 | 52 | 14.1% |
| $150,000 to $199,999 | 22 | 5.9% |
| $200,000+ | 3 | 0.8% |
Family Income by Famaliy Size in Samson
2-person families (190 | 51.3%) account for the highest median family income in Samson with $57,917 per family, while 2-person families (190 | 51.3%) have the highest median income of $28,958 per family member.
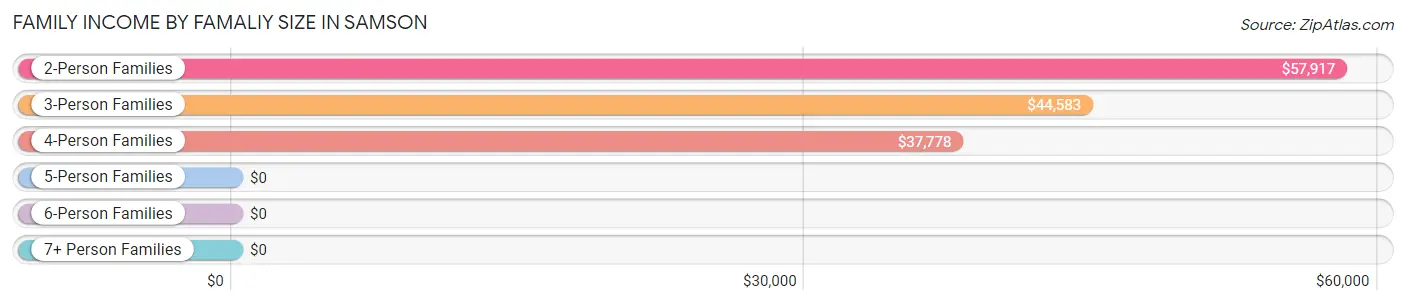
| Income Bracket | # Families | Median Income |
| 2-Person Families | 190 (51.3%) | $57,917 |
| 3-Person Families | 98 (26.5%) | $44,583 |
| 4-Person Families | 56 (15.1%) | $37,778 |
| 5-Person Families | 23 (6.2%) | $0 |
| 6-Person Families | 2 (0.5%) | $0 |
| 7+ Person Families | 1 (0.3%) | $0 |
| Total | 370 (100.0%) | $45,000 |
Family Income by Number of Earners in Samson
The median family income in Samson is $45,000, with families comprising 3+ earners (6) having the highest median family income of $138,750, while families with no earners (81) have the lowest median family income of $16,250, accounting for 1.6% and 21.9% of families, respectively.
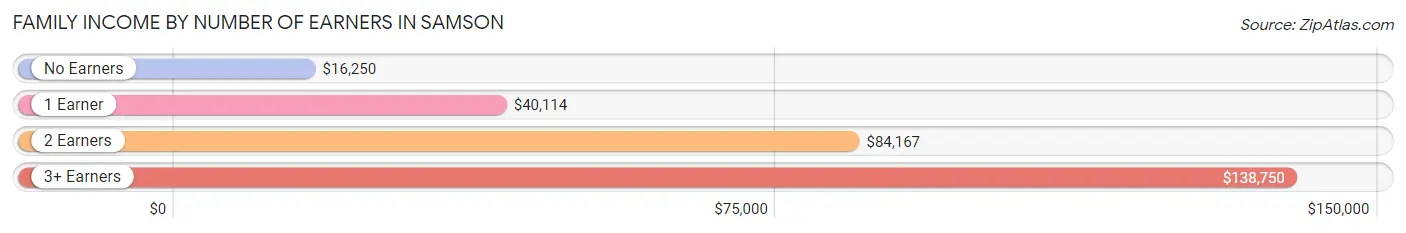
| Number of Earners | # Families | Median Income |
| No Earners | 81 (21.9%) | $16,250 |
| 1 Earner | 141 (38.1%) | $40,114 |
| 2 Earners | 142 (38.4%) | $84,167 |
| 3+ Earners | 6 (1.6%) | $138,750 |
| Total | 370 (100.0%) | $45,000 |
Household Income in Samson
Household Income Brackets in Samson
With 110 households falling in the category, the $15,000 to $24,999 income range is the most frequent in Samson, accounting for 17.3% of all households. In contrast, only 8 households (1.3%) fall into the $200,000+ income bracket, making it the least populous group.
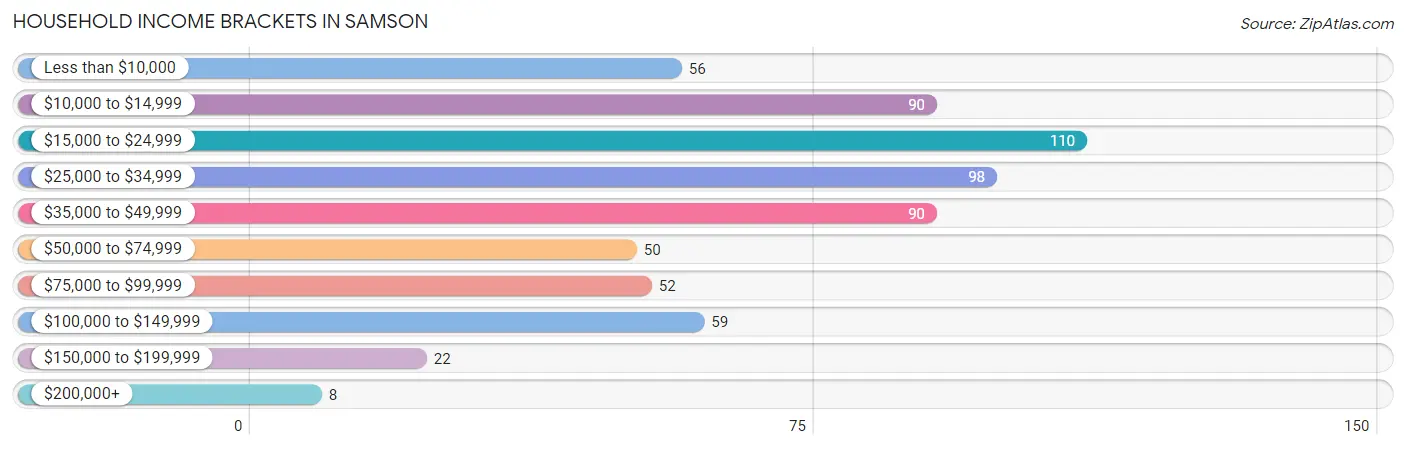
| Income Bracket | # Households | % Households |
| Less than $10,000 | 56 | 8.8% |
| $10,000 to $14,999 | 90 | 14.2% |
| $15,000 to $24,999 | 110 | 17.3% |
| $25,000 to $34,999 | 98 | 15.4% |
| $35,000 to $49,999 | 90 | 14.2% |
| $50,000 to $74,999 | 50 | 7.9% |
| $75,000 to $99,999 | 52 | 8.2% |
| $100,000 to $149,999 | 59 | 9.3% |
| $150,000 to $199,999 | 22 | 3.5% |
| $200,000+ | 8 | 1.3% |
Household Income by Householder Age in Samson
The median household income in Samson is $29,338, with the highest median household income of $33,929 found in the 15 to 24 years age bracket for the primary householder. A total of 22 households (3.5%) fall into this category. Meanwhile, the 25 to 44 years age bracket for the primary householder has the lowest median household income of $27,125, with 138 households (21.7%) in this group.
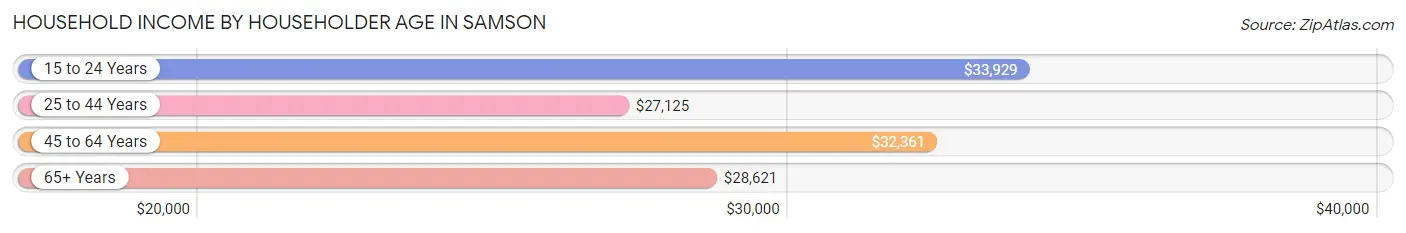
| Income Bracket | # Households | Median Income |
| 15 to 24 Years | 22 (3.5%) | $33,929 |
| 25 to 44 Years | 138 (21.7%) | $27,125 |
| 45 to 64 Years | 259 (40.8%) | $32,361 |
| 65+ Years | 216 (34.0%) | $28,621 |
| Total | 635 (100.0%) | $29,338 |
Poverty in Samson
Income Below Poverty by Sex and Age in Samson
With 35.9% poverty level for males and 35.4% for females among the residents of Samson, 16 and 17 year old males and 15 year old females are the most vulnerable to poverty, with 13 males (100.0%) and 15 females (100.0%) in their respective age groups living below the poverty level.
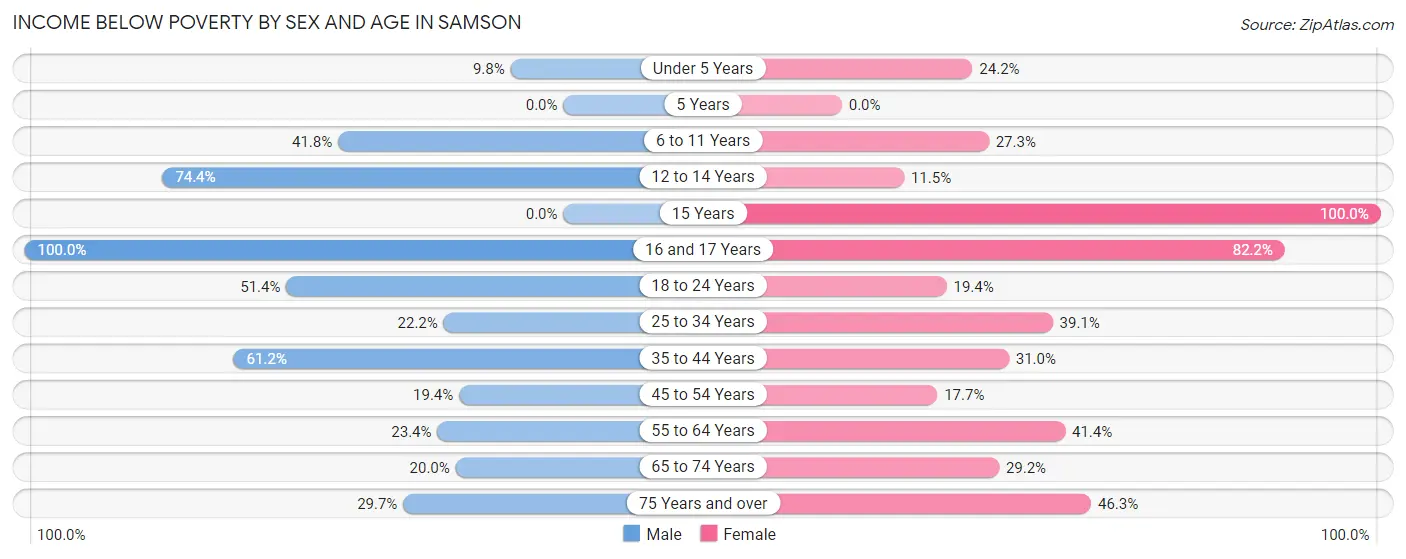
| Age Bracket | Male | Female |
| Under 5 Years | 5 (9.8%) | 8 (24.2%) |
| 5 Years | 0 (0.0%) | 0 (0.0%) |
| 6 to 11 Years | 23 (41.8%) | 9 (27.3%) |
| 12 to 14 Years | 32 (74.4%) | 3 (11.5%) |
| 15 Years | 0 (0.0%) | 15 (100.0%) |
| 16 and 17 Years | 13 (100.0%) | 37 (82.2%) |
| 18 to 24 Years | 36 (51.4%) | 7 (19.4%) |
| 25 to 34 Years | 18 (22.2%) | 27 (39.1%) |
| 35 to 44 Years | 71 (61.2%) | 22 (31.0%) |
| 45 to 54 Years | 18 (19.4%) | 17 (17.7%) |
| 55 to 64 Years | 29 (23.4%) | 58 (41.4%) |
| 65 to 74 Years | 14 (20.0%) | 35 (29.2%) |
| 75 Years and over | 11 (29.7%) | 31 (46.3%) |
| Total | 270 (35.9%) | 269 (35.4%) |
Income Above Poverty by Sex and Age in Samson
According to the poverty statistics in Samson, males aged under 5 years and females aged 5 years are the age groups that are most secure financially, with 90.2% of males and 100.0% of females in these age groups living above the poverty line.
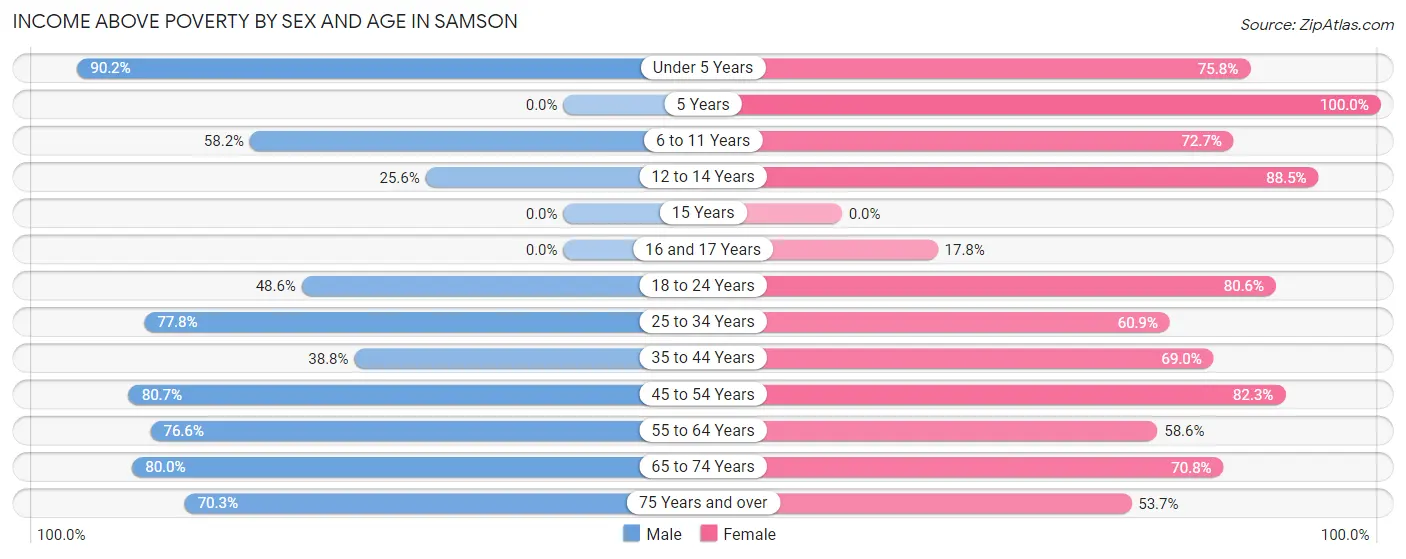
| Age Bracket | Male | Female |
| Under 5 Years | 46 (90.2%) | 25 (75.8%) |
| 5 Years | 0 (0.0%) | 9 (100.0%) |
| 6 to 11 Years | 32 (58.2%) | 24 (72.7%) |
| 12 to 14 Years | 11 (25.6%) | 23 (88.5%) |
| 15 Years | 0 (0.0%) | 0 (0.0%) |
| 16 and 17 Years | 0 (0.0%) | 8 (17.8%) |
| 18 to 24 Years | 34 (48.6%) | 29 (80.6%) |
| 25 to 34 Years | 63 (77.8%) | 42 (60.9%) |
| 35 to 44 Years | 45 (38.8%) | 49 (69.0%) |
| 45 to 54 Years | 75 (80.6%) | 79 (82.3%) |
| 55 to 64 Years | 95 (76.6%) | 82 (58.6%) |
| 65 to 74 Years | 56 (80.0%) | 85 (70.8%) |
| 75 Years and over | 26 (70.3%) | 36 (53.7%) |
| Total | 483 (64.1%) | 491 (64.6%) |
Income Below Poverty Among Married-Couple Families in Samson
The poverty statistics for married-couple families in Samson show that 10.4% or 25 of the total 241 families live below the poverty line. Families with 1 or 2 children have the highest poverty rate of 26.1%, comprising of 18 families. On the other hand, families with 3 or 4 children have the lowest poverty rate of 0.0%, which includes 0 families.
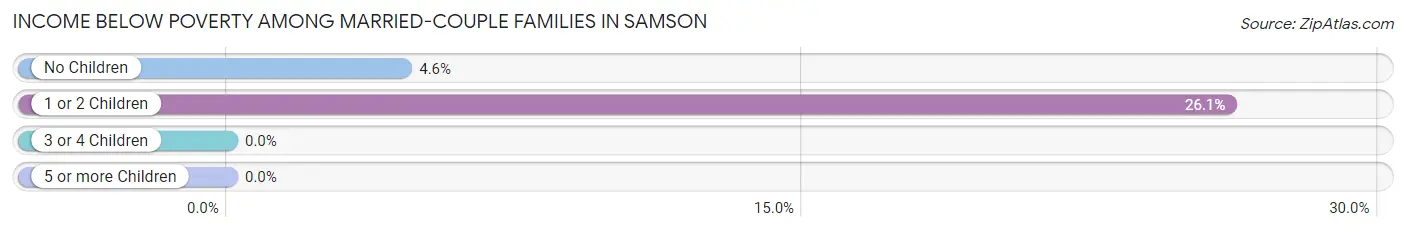
| Children | Above Poverty | Below Poverty |
| No Children | 147 (95.5%) | 7 (4.5%) |
| 1 or 2 Children | 51 (73.9%) | 18 (26.1%) |
| 3 or 4 Children | 18 (100.0%) | 0 (0.0%) |
| 5 or more Children | 0 (0.0%) | 0 (0.0%) |
| Total | 216 (89.6%) | 25 (10.4%) |
Income Below Poverty Among Single-Parent Households in Samson
According to the poverty data in Samson, 35.7% or 10 single-father households and 61.4% or 62 single-mother households are living below the poverty line. Among single-father households, those with 3 or 4 children have the highest poverty rate, with 7 households (100.0%) experiencing poverty. Likewise, among single-mother households, those with 3 or 4 children have the highest poverty rate, with 2 households (100.0%) falling below the poverty line.
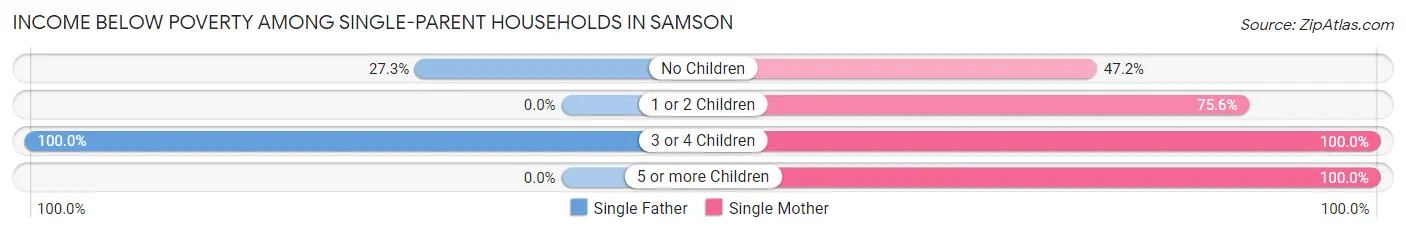
| Children | Single Father | Single Mother |
| No Children | 3 (27.3%) | 25 (47.2%) |
| 1 or 2 Children | 0 (0.0%) | 34 (75.6%) |
| 3 or 4 Children | 7 (100.0%) | 2 (100.0%) |
| 5 or more Children | 0 (0.0%) | 1 (100.0%) |
| Total | 10 (35.7%) | 62 (61.4%) |
Income Below Poverty Among Married-Couple vs Single-Parent Households in Samson
The poverty data for Samson shows that 25 of the married-couple family households (10.4%) and 72 of the single-parent households (55.8%) are living below the poverty level. Within the married-couple family households, those with 1 or 2 children have the highest poverty rate, with 18 households (26.1%) falling below the poverty line. Among the single-parent households, those with 3 or 4 children have the highest poverty rate, with 9 household (100.0%) living below poverty.
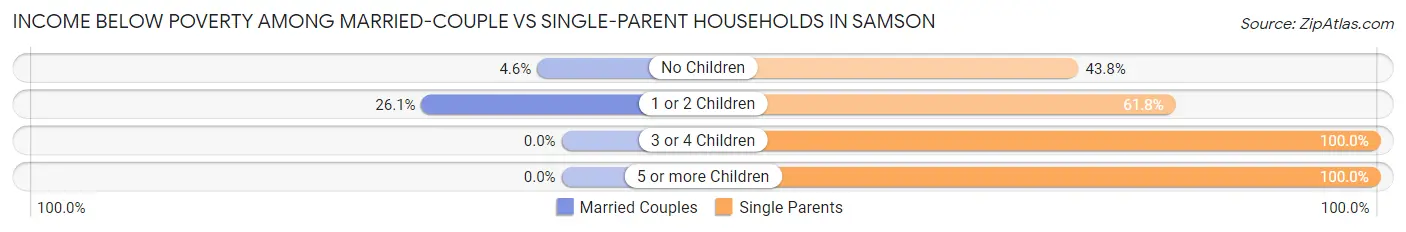
| Children | Married-Couple Families | Single-Parent Households |
| No Children | 7 (4.5%) | 28 (43.8%) |
| 1 or 2 Children | 18 (26.1%) | 34 (61.8%) |
| 3 or 4 Children | 0 (0.0%) | 9 (100.0%) |
| 5 or more Children | 0 (0.0%) | 1 (100.0%) |
| Total | 25 (10.4%) | 72 (55.8%) |
Employment Characteristics in Samson
Employment by Class of Employer in Samson
Among the 500 employed individuals in Samson, private company employees (323 | 64.6%), self-employed (not incorporated) (54 | 10.8%), and local government employees (39 | 7.8%) make up the most common classes of employment.
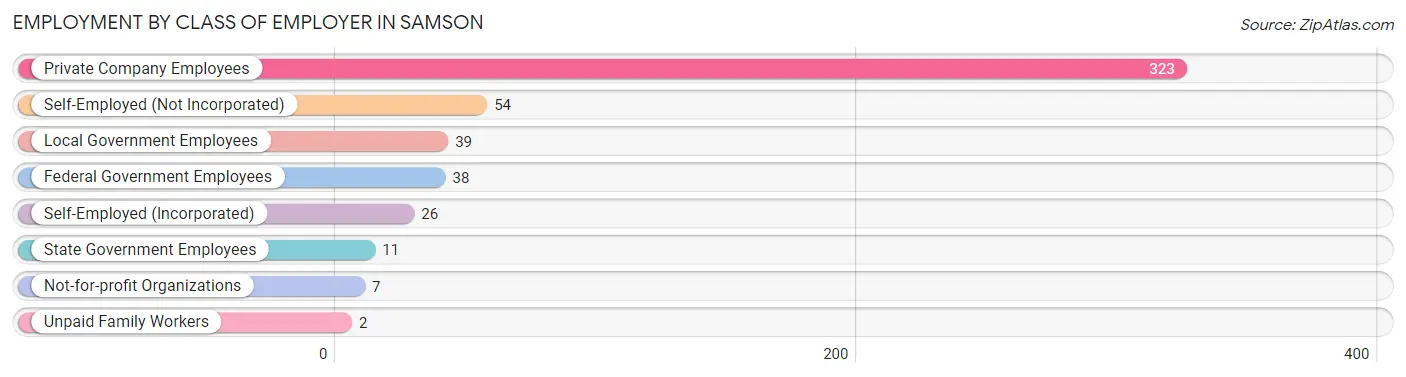
| Employer Class | # Employees | % Employees |
| Private Company Employees | 323 | 64.6% |
| Self-Employed (Incorporated) | 26 | 5.2% |
| Self-Employed (Not Incorporated) | 54 | 10.8% |
| Not-for-profit Organizations | 7 | 1.4% |
| Local Government Employees | 39 | 7.8% |
| State Government Employees | 11 | 2.2% |
| Federal Government Employees | 38 | 7.6% |
| Unpaid Family Workers | 2 | 0.4% |
| Total | 500 | 100.0% |
Employment Status by Age in Samson
According to the labor force statistics for Samson, out of the total population over 16 years of age (1,248), 47.3% or 590 individuals are in the labor force, with 12.5% or 74 of them unemployed. The age group with the highest labor force participation rate is 30 to 34 years, with 86.3% or 69 individuals in the labor force. Within the labor force, the 35 to 44 years age range has the highest percentage of unemployed individuals, with 31.7% or 38 of them being unemployed.
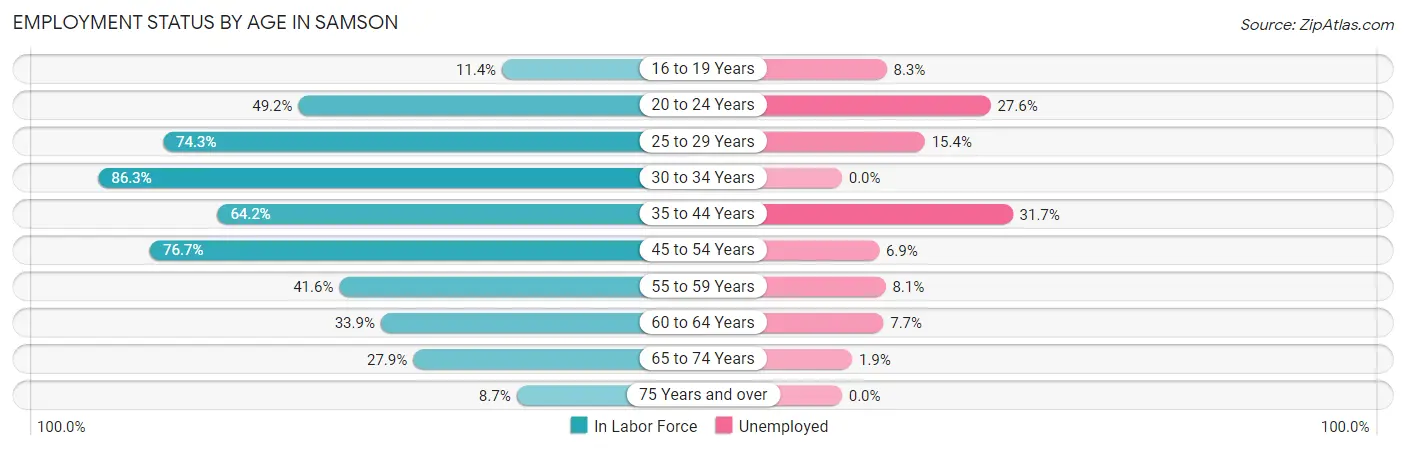
| Age Bracket | In Labor Force | Unemployed |
| 16 to 19 Years | 12 (11.4%) | 1 (8.3%) |
| 20 to 24 Years | 29 (49.2%) | 8 (27.6%) |
| 25 to 29 Years | 52 (74.3%) | 8 (15.4%) |
| 30 to 34 Years | 69 (86.3%) | 0 (0.0%) |
| 35 to 44 Years | 120 (64.2%) | 38 (31.7%) |
| 45 to 54 Years | 145 (76.7%) | 10 (6.9%) |
| 55 to 59 Years | 62 (41.6%) | 5 (8.1%) |
| 60 to 64 Years | 39 (33.9%) | 3 (7.7%) |
| 65 to 74 Years | 53 (27.9%) | 1 (1.9%) |
| 75 Years and over | 9 (8.7%) | 0 (0.0%) |
| Total | 590 (47.3%) | 74 (12.5%) |
Employment Status by Educational Attainment in Samson
According to labor force statistics for Samson, 61.6% of individuals (487) out of the total population between 25 and 64 years of age (790) are in the labor force, with 13.1% or 64 of them being unemployed. The group with the highest labor force participation rate are those with the educational attainment of college / associate degree, with 67.3% or 138 individuals in the labor force. Within the labor force, individuals with high school diploma education have the highest percentage of unemployment, with 25.5% or 42 of them being unemployed.
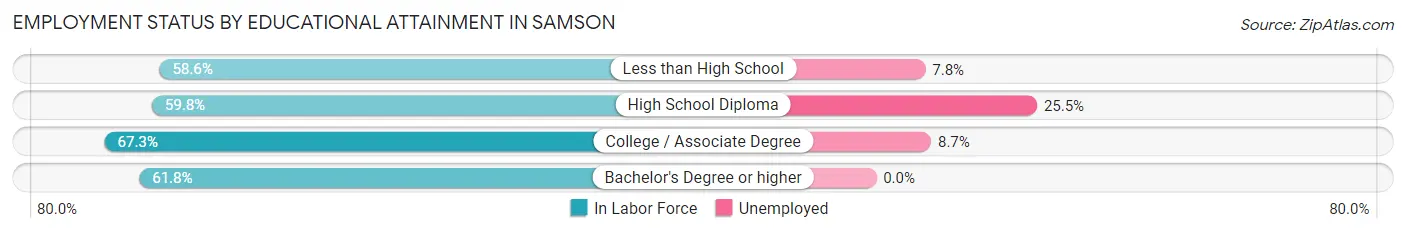
| Educational Attainment | In Labor Force | Unemployed |
| Less than High School | 129 (58.6%) | 17 (7.8%) |
| High School Diploma | 165 (59.8%) | 70 (25.5%) |
| College / Associate Degree | 138 (67.3%) | 18 (8.7%) |
| Bachelor's Degree or higher | 55 (61.8%) | 0 (0.0%) |
| Total | 487 (61.6%) | 103 (13.1%) |
Employment Occupations by Sex in Samson
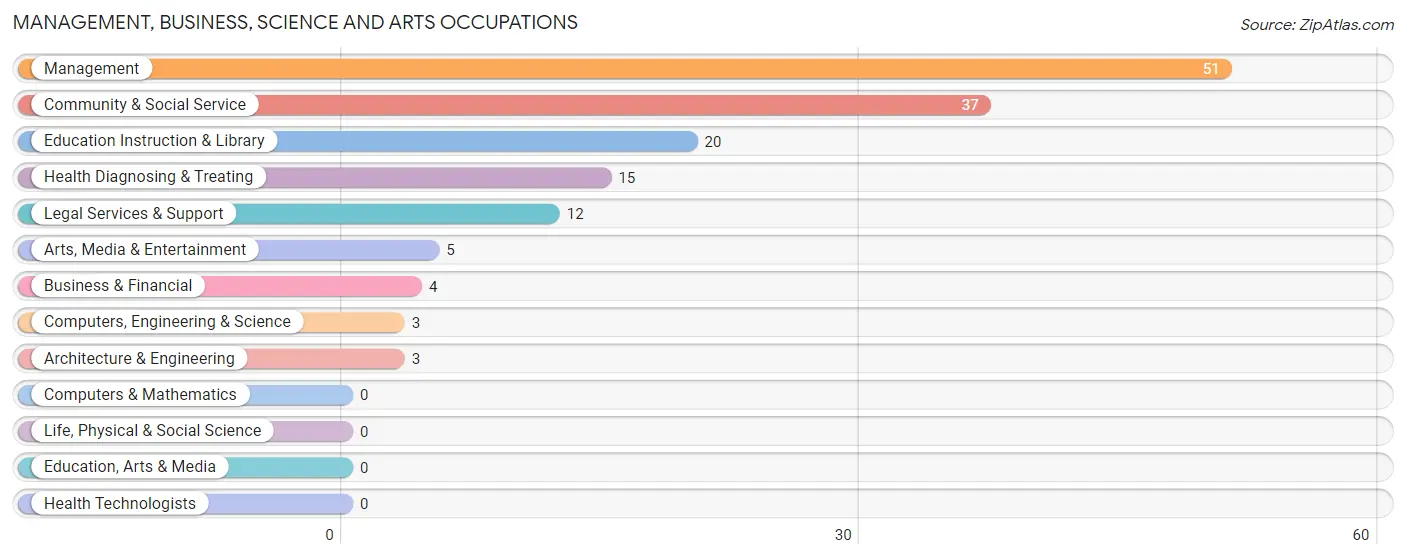
Management, Business, Science and Arts Occupations
The most common Management, Business, Science and Arts occupations in Samson are Management (51 | 9.9%), Community & Social Service (37 | 7.2%), Education Instruction & Library (20 | 3.9%), Health Diagnosing & Treating (15 | 2.9%), and Legal Services & Support (12 | 2.3%).
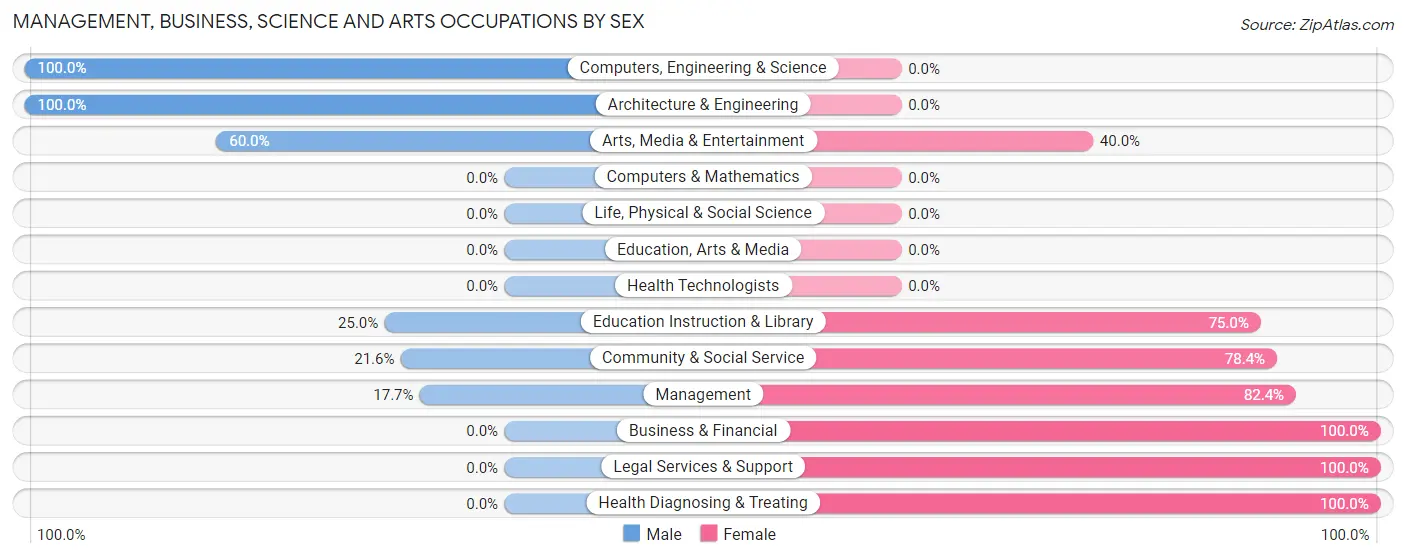
Management, Business, Science and Arts Occupations by Sex
Within the Management, Business, Science and Arts occupations in Samson, the most male-oriented occupations are Computers, Engineering & Science (100.0%), Architecture & Engineering (100.0%), and Arts, Media & Entertainment (60.0%), while the most female-oriented occupations are Business & Financial (100.0%), Legal Services & Support (100.0%), and Health Diagnosing & Treating (100.0%).
| Occupation | Male | Female |
| Management | 9 (17.6%) | 42 (82.4%) |
| Business & Financial | 0 (0.0%) | 4 (100.0%) |
| Computers, Engineering & Science | 3 (100.0%) | 0 (0.0%) |
| Computers & Mathematics | 0 (0.0%) | 0 (0.0%) |
| Architecture & Engineering | 3 (100.0%) | 0 (0.0%) |
| Life, Physical & Social Science | 0 (0.0%) | 0 (0.0%) |
| Community & Social Service | 8 (21.6%) | 29 (78.4%) |
| Education, Arts & Media | 0 (0.0%) | 0 (0.0%) |
| Legal Services & Support | 0 (0.0%) | 12 (100.0%) |
| Education Instruction & Library | 5 (25.0%) | 15 (75.0%) |
| Arts, Media & Entertainment | 3 (60.0%) | 2 (40.0%) |
| Health Diagnosing & Treating | 0 (0.0%) | 15 (100.0%) |
| Health Technologists | 0 (0.0%) | 0 (0.0%) |
| Total (Category) | 20 (18.2%) | 90 (81.8%) |
| Total (Overall) | 275 (53.3%) | 241 (46.7%) |
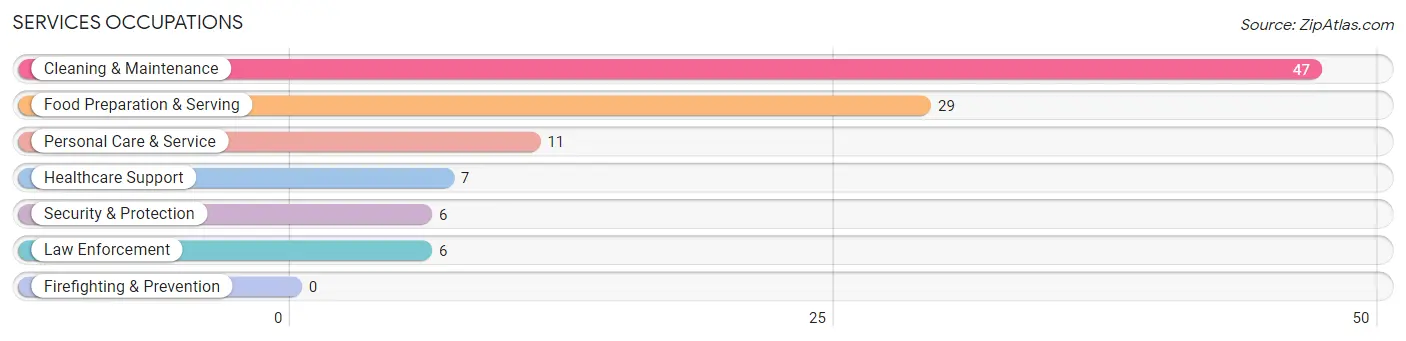
Services Occupations
The most common Services occupations in Samson are Cleaning & Maintenance (47 | 9.1%), Food Preparation & Serving (29 | 5.6%), Personal Care & Service (11 | 2.1%), Healthcare Support (7 | 1.4%), and Security & Protection (6 | 1.2%).
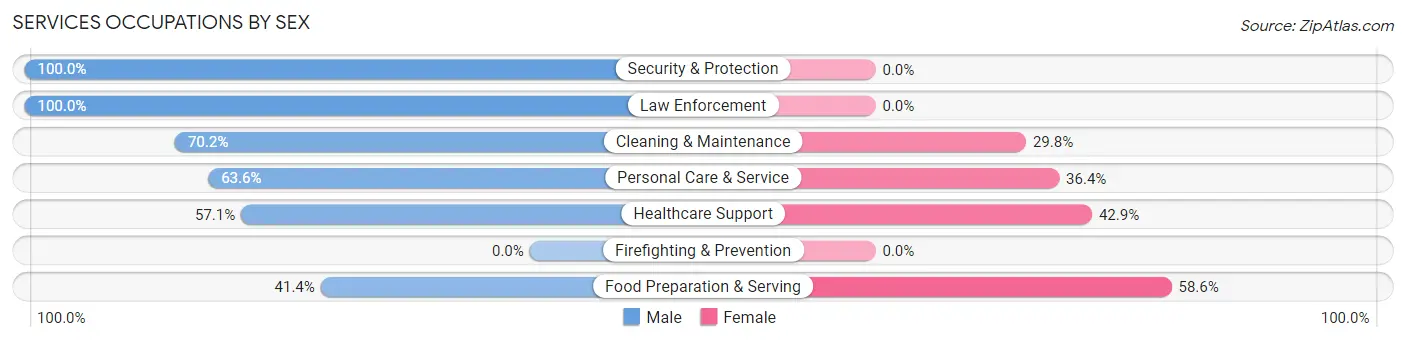
Services Occupations by Sex
Within the Services occupations in Samson, the most male-oriented occupations are Security & Protection (100.0%), Law Enforcement (100.0%), and Cleaning & Maintenance (70.2%), while the most female-oriented occupations are Food Preparation & Serving (58.6%), Healthcare Support (42.9%), and Personal Care & Service (36.4%).
| Occupation | Male | Female |
| Healthcare Support | 4 (57.1%) | 3 (42.9%) |
| Security & Protection | 6 (100.0%) | 0 (0.0%) |
| Firefighting & Prevention | 0 (0.0%) | 0 (0.0%) |
| Law Enforcement | 6 (100.0%) | 0 (0.0%) |
| Food Preparation & Serving | 12 (41.4%) | 17 (58.6%) |
| Cleaning & Maintenance | 33 (70.2%) | 14 (29.8%) |
| Personal Care & Service | 7 (63.6%) | 4 (36.4%) |
| Total (Category) | 62 (62.0%) | 38 (38.0%) |
| Total (Overall) | 275 (53.3%) | 241 (46.7%) |
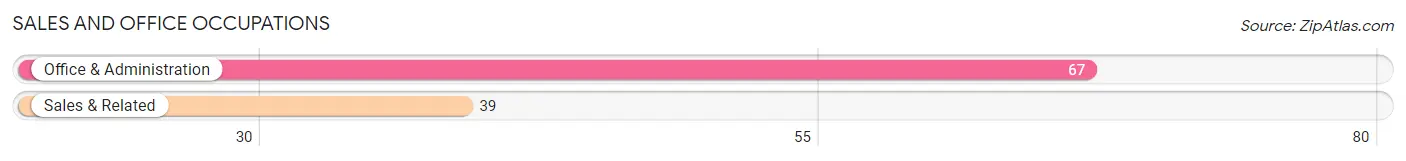
Sales and Office Occupations
The most common Sales and Office occupations in Samson are Office & Administration (67 | 13.0%), and Sales & Related (39 | 7.6%).
Sales and Office Occupations by Sex
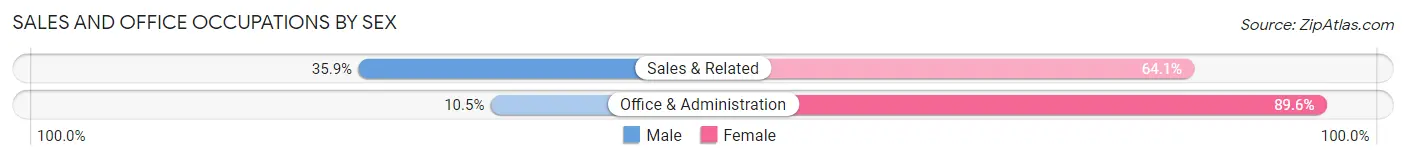
| Occupation | Male | Female |
| Sales & Related | 14 (35.9%) | 25 (64.1%) |
| Office & Administration | 7 (10.4%) | 60 (89.5%) |
| Total (Category) | 21 (19.8%) | 85 (80.2%) |
| Total (Overall) | 275 (53.3%) | 241 (46.7%) |
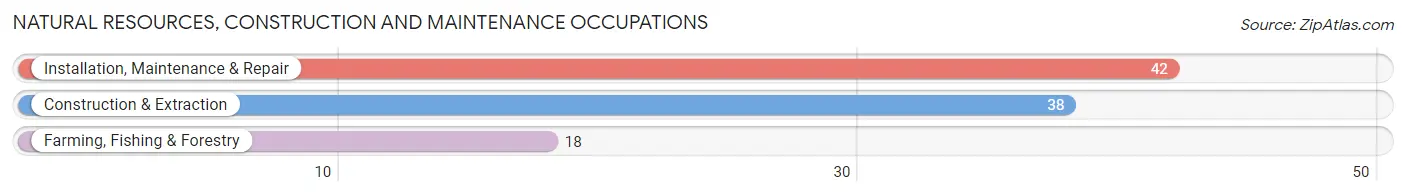
Natural Resources, Construction and Maintenance Occupations
The most common Natural Resources, Construction and Maintenance occupations in Samson are Installation, Maintenance & Repair (42 | 8.1%), Construction & Extraction (38 | 7.4%), and Farming, Fishing & Forestry (18 | 3.5%).
Natural Resources, Construction and Maintenance Occupations by Sex
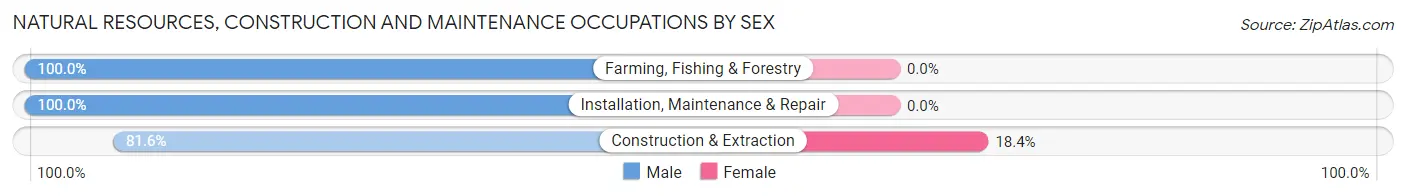
| Occupation | Male | Female |
| Farming, Fishing & Forestry | 18 (100.0%) | 0 (0.0%) |
| Construction & Extraction | 31 (81.6%) | 7 (18.4%) |
| Installation, Maintenance & Repair | 42 (100.0%) | 0 (0.0%) |
| Total (Category) | 91 (92.9%) | 7 (7.1%) |
| Total (Overall) | 275 (53.3%) | 241 (46.7%) |
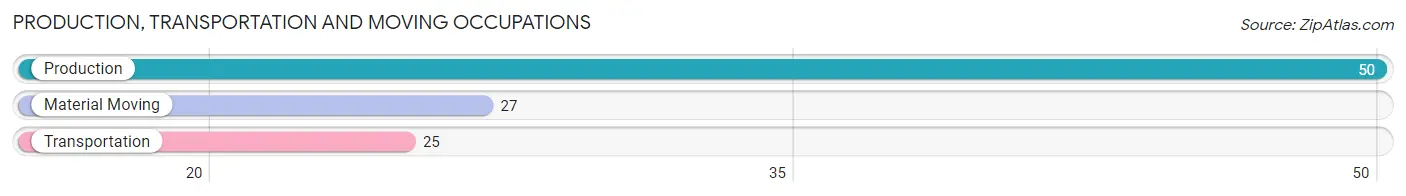
Production, Transportation and Moving Occupations
The most common Production, Transportation and Moving occupations in Samson are Production (50 | 9.7%), Material Moving (27 | 5.2%), and Transportation (25 | 4.8%).
Production, Transportation and Moving Occupations by Sex
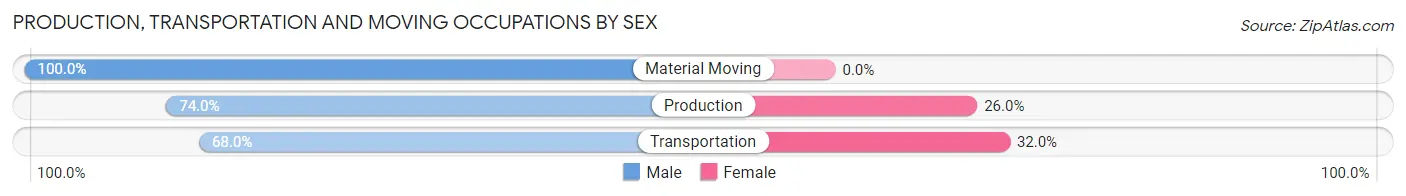
| Occupation | Male | Female |
| Production | 37 (74.0%) | 13 (26.0%) |
| Transportation | 17 (68.0%) | 8 (32.0%) |
| Material Moving | 27 (100.0%) | 0 (0.0%) |
| Total (Category) | 81 (79.4%) | 21 (20.6%) |
| Total (Overall) | 275 (53.3%) | 241 (46.7%) |
Employment Industries by Sex in Samson
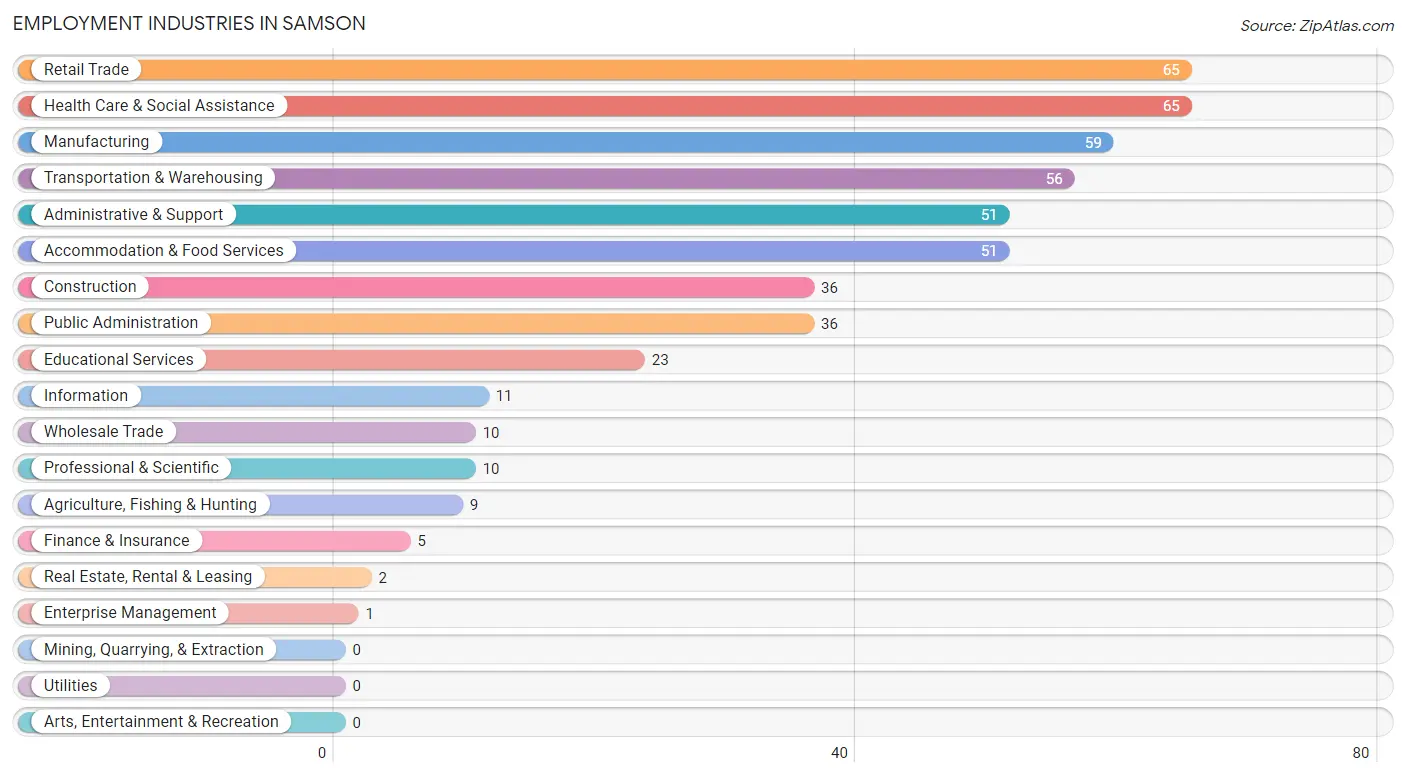
Employment Industries in Samson
The major employment industries in Samson include Retail Trade (65 | 12.6%), Health Care & Social Assistance (65 | 12.6%), Manufacturing (59 | 11.4%), Transportation & Warehousing (56 | 10.8%), and Administrative & Support (51 | 9.9%).
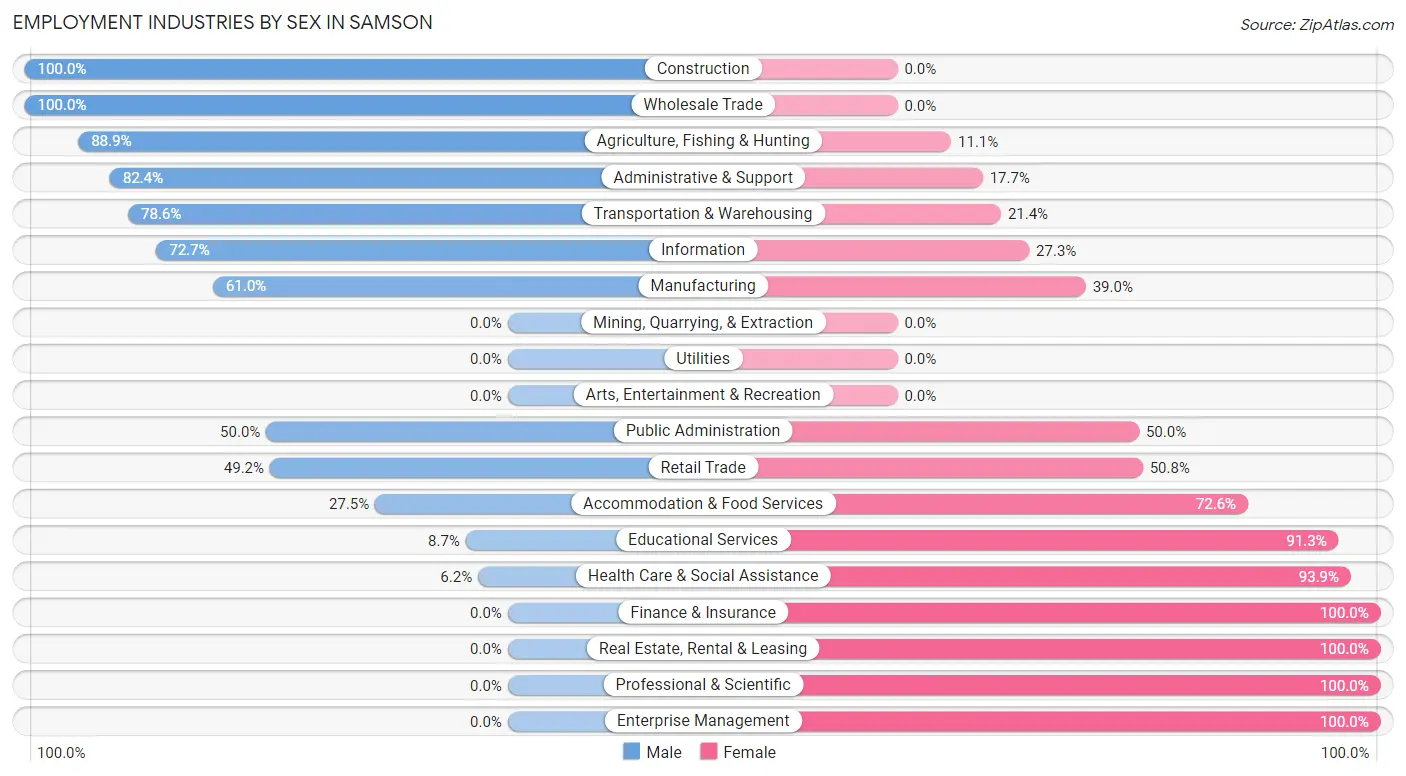
Employment Industries by Sex in Samson
The Samson industries that see more men than women are Construction (100.0%), Wholesale Trade (100.0%), and Agriculture, Fishing & Hunting (88.9%), whereas the industries that tend to have a higher number of women are Finance & Insurance (100.0%), Real Estate, Rental & Leasing (100.0%), and Professional & Scientific (100.0%).
| Industry | Male | Female |
| Agriculture, Fishing & Hunting | 8 (88.9%) | 1 (11.1%) |
| Mining, Quarrying, & Extraction | 0 (0.0%) | 0 (0.0%) |
| Construction | 36 (100.0%) | 0 (0.0%) |
| Manufacturing | 36 (61.0%) | 23 (39.0%) |
| Wholesale Trade | 10 (100.0%) | 0 (0.0%) |
| Retail Trade | 32 (49.2%) | 33 (50.8%) |
| Transportation & Warehousing | 44 (78.6%) | 12 (21.4%) |
| Utilities | 0 (0.0%) | 0 (0.0%) |
| Information | 8 (72.7%) | 3 (27.3%) |
| Finance & Insurance | 0 (0.0%) | 5 (100.0%) |
| Real Estate, Rental & Leasing | 0 (0.0%) | 2 (100.0%) |
| Professional & Scientific | 0 (0.0%) | 10 (100.0%) |
| Enterprise Management | 0 (0.0%) | 1 (100.0%) |
| Administrative & Support | 42 (82.4%) | 9 (17.6%) |
| Educational Services | 2 (8.7%) | 21 (91.3%) |
| Health Care & Social Assistance | 4 (6.1%) | 61 (93.9%) |
| Arts, Entertainment & Recreation | 0 (0.0%) | 0 (0.0%) |
| Accommodation & Food Services | 14 (27.5%) | 37 (72.6%) |
| Public Administration | 18 (50.0%) | 18 (50.0%) |
| Total | 275 (53.3%) | 241 (46.7%) |
Education in Samson
School Enrollment in Samson
The most common levels of schooling among the 309 students in Samson are high school (105 | 34.0%), middle school (79 | 25.6%), and elementary school (62 | 20.1%).
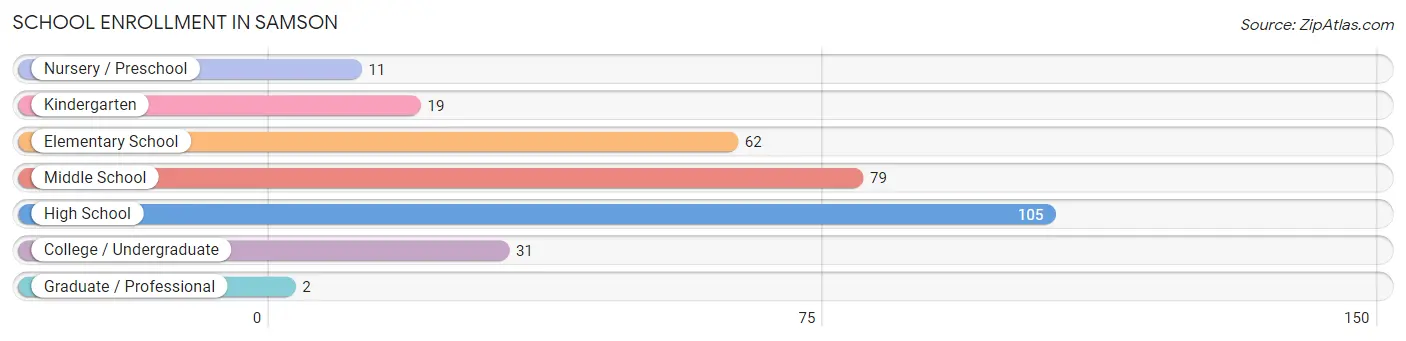
| School Level | # Students | % Students |
| Nursery / Preschool | 11 | 3.6% |
| Kindergarten | 19 | 6.1% |
| Elementary School | 62 | 20.1% |
| Middle School | 79 | 25.6% |
| High School | 105 | 34.0% |
| College / Undergraduate | 31 | 10.0% |
| Graduate / Professional | 2 | 0.6% |
| Total | 309 | 100.0% |
School Enrollment by Age by Funding Source in Samson
Out of a total of 309 students who are enrolled in schools in Samson, 3 (1.0%) attend a private institution, while the remaining 306 (99.0%) are enrolled in public schools. The age group of 35 years and over has the highest likelihood of being enrolled in private schools, with 2 (40.0% in the age bracket) enrolled. Conversely, the age group of 3 to 4 year olds has the lowest likelihood of being enrolled in a private school, with 11 (100.0% in the age bracket) attending a public institution.
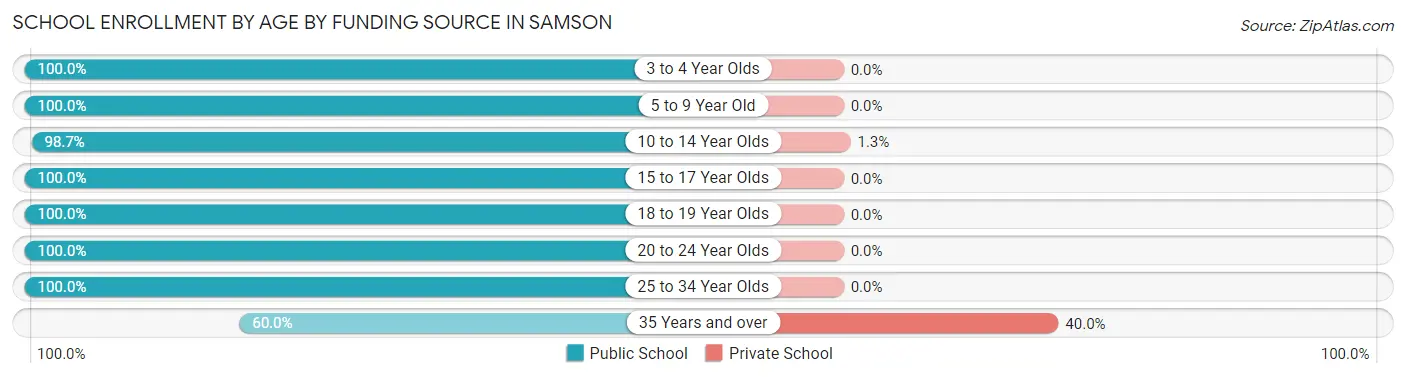
| Age Bracket | Public School | Private School |
| 3 to 4 Year Olds | 11 (100.0%) | 0 (0.0%) |
| 5 to 9 Year Old | 81 (100.0%) | 0 (0.0%) |
| 10 to 14 Year Olds | 77 (98.7%) | 1 (1.3%) |
| 15 to 17 Year Olds | 73 (100.0%) | 0 (0.0%) |
| 18 to 19 Year Olds | 39 (100.0%) | 0 (0.0%) |
| 20 to 24 Year Olds | 7 (100.0%) | 0 (0.0%) |
| 25 to 34 Year Olds | 15 (100.0%) | 0 (0.0%) |
| 35 Years and over | 3 (60.0%) | 2 (40.0%) |
| Total | 306 (99.0%) | 3 (1.0%) |
Educational Attainment by Field of Study in Samson
Education (34 | 28.6%), arts & humanities (15 | 12.6%), engineering (13 | 10.9%), liberal arts & history (13 | 10.9%), and computers & mathematics (12 | 10.1%) are the most common fields of study among 119 individuals in Samson who have obtained a bachelor's degree or higher.
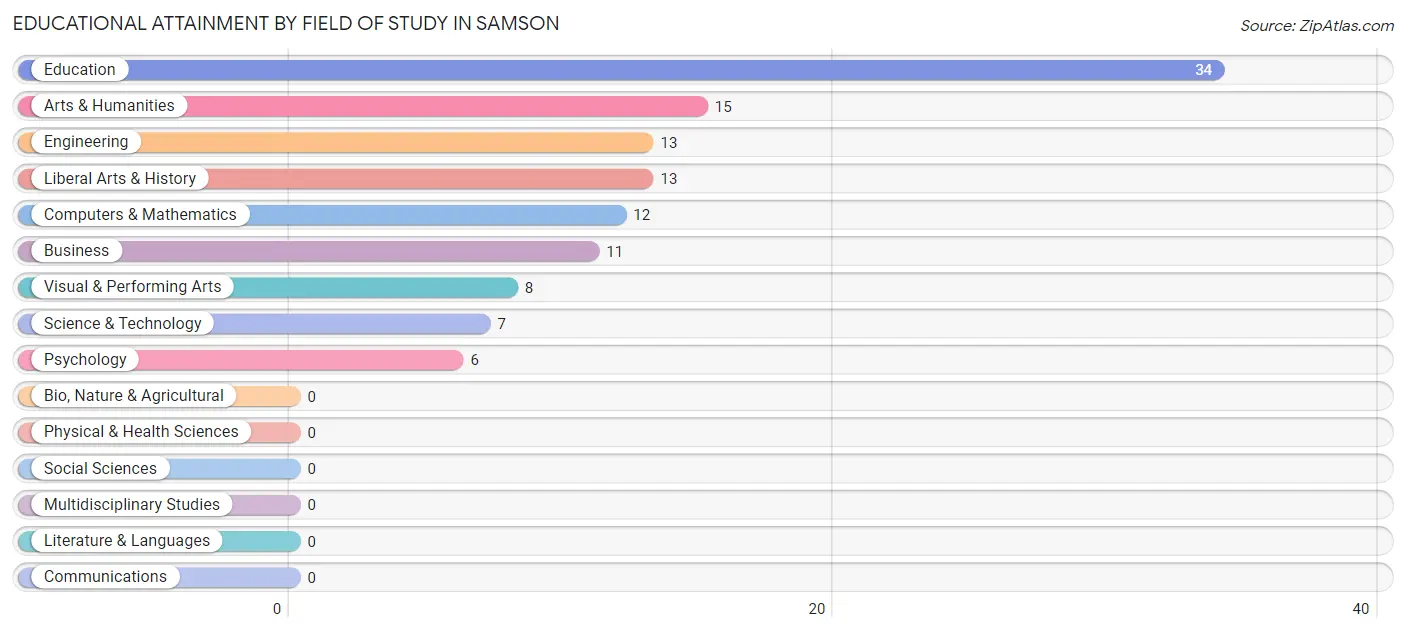
| Field of Study | # Graduates | % Graduates |
| Computers & Mathematics | 12 | 10.1% |
| Bio, Nature & Agricultural | 0 | 0.0% |
| Physical & Health Sciences | 0 | 0.0% |
| Psychology | 6 | 5.0% |
| Social Sciences | 0 | 0.0% |
| Engineering | 13 | 10.9% |
| Multidisciplinary Studies | 0 | 0.0% |
| Science & Technology | 7 | 5.9% |
| Business | 11 | 9.2% |
| Education | 34 | 28.6% |
| Literature & Languages | 0 | 0.0% |
| Liberal Arts & History | 13 | 10.9% |
| Visual & Performing Arts | 8 | 6.7% |
| Communications | 0 | 0.0% |
| Arts & Humanities | 15 | 12.6% |
| Total | 119 | 100.0% |
Transportation & Commute in Samson
Vehicle Availability by Sex in Samson
The most prevalent vehicle ownership categories in Samson are males with 3 vehicles (91, accounting for 34.7%) and females with 3 vehicles (82, making up 38.2%).
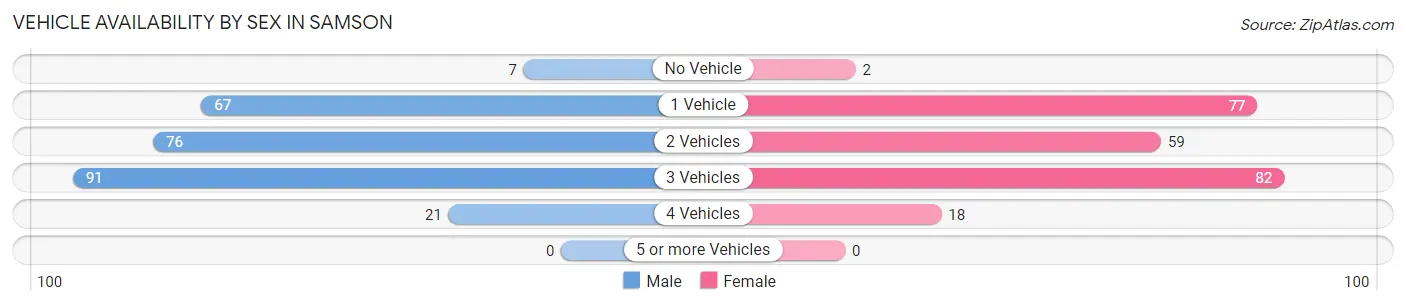
| Vehicles Available | Male | Female |
| No Vehicle | 7 (2.7%) | 2 (0.8%) |
| 1 Vehicle | 67 (25.6%) | 77 (32.4%) |
| 2 Vehicles | 76 (29.0%) | 59 (24.8%) |
| 3 Vehicles | 91 (34.7%) | 82 (34.4%) |
| 4 Vehicles | 21 (8.0%) | 18 (7.6%) |
| 5 or more Vehicles | 0 (0.0%) | 0 (0.0%) |
| Total | 262 (100.0%) | 238 (100.0%) |
Commute Time in Samson
The most frequently occuring commute durations in Samson are 30 to 34 minutes (100 commuters, 20.5%), 5 to 9 minutes (78 commuters, 16.0%), and 60 to 89 minutes (76 commuters, 15.6%).
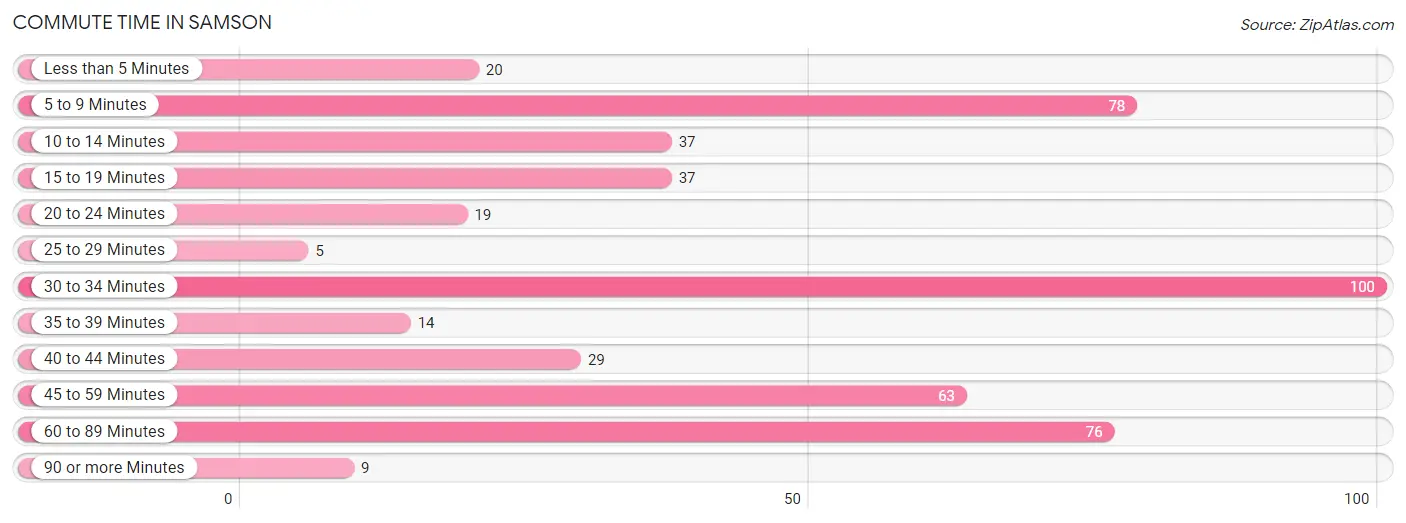
| Commute Time | # Commuters | % Commuters |
| Less than 5 Minutes | 20 | 4.1% |
| 5 to 9 Minutes | 78 | 16.0% |
| 10 to 14 Minutes | 37 | 7.6% |
| 15 to 19 Minutes | 37 | 7.6% |
| 20 to 24 Minutes | 19 | 3.9% |
| 25 to 29 Minutes | 5 | 1.0% |
| 30 to 34 Minutes | 100 | 20.5% |
| 35 to 39 Minutes | 14 | 2.9% |
| 40 to 44 Minutes | 29 | 5.9% |
| 45 to 59 Minutes | 63 | 12.9% |
| 60 to 89 Minutes | 76 | 15.6% |
| 90 or more Minutes | 9 | 1.8% |
Commute Time by Sex in Samson
The most common commute times in Samson are 30 to 34 minutes (63 commuters, 24.7%) for males and 5 to 9 minutes (51 commuters, 22.0%) for females.
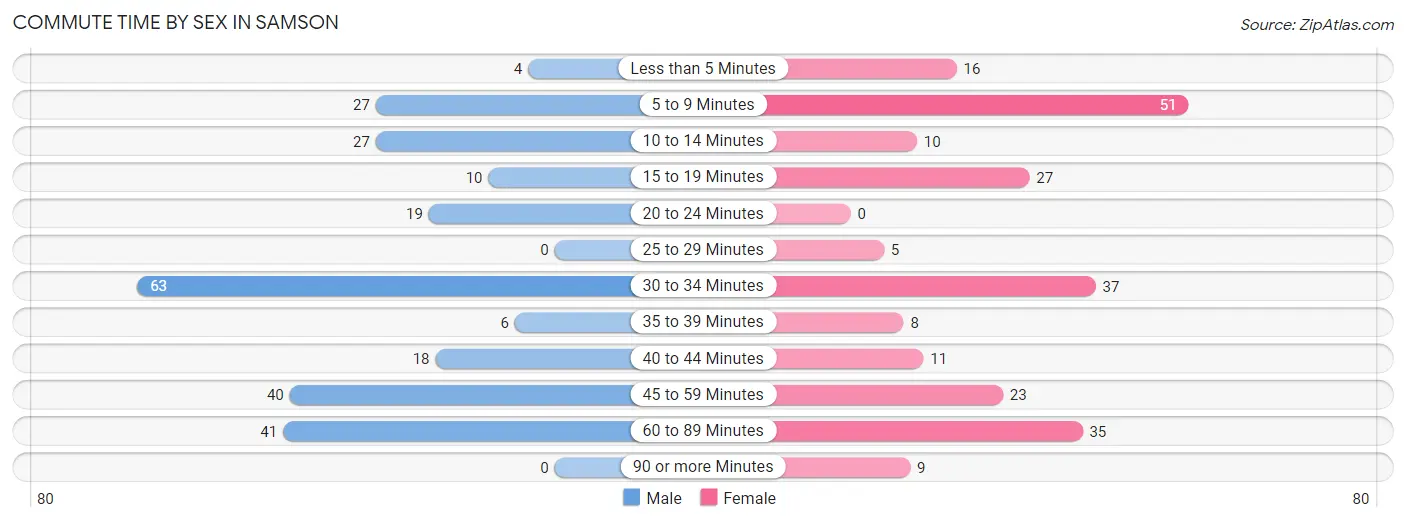
| Commute Time | Male | Female |
| Less than 5 Minutes | 4 (1.6%) | 16 (6.9%) |
| 5 to 9 Minutes | 27 (10.6%) | 51 (22.0%) |
| 10 to 14 Minutes | 27 (10.6%) | 10 (4.3%) |
| 15 to 19 Minutes | 10 (3.9%) | 27 (11.6%) |
| 20 to 24 Minutes | 19 (7.4%) | 0 (0.0%) |
| 25 to 29 Minutes | 0 (0.0%) | 5 (2.2%) |
| 30 to 34 Minutes | 63 (24.7%) | 37 (16.0%) |
| 35 to 39 Minutes | 6 (2.4%) | 8 (3.5%) |
| 40 to 44 Minutes | 18 (7.1%) | 11 (4.7%) |
| 45 to 59 Minutes | 40 (15.7%) | 23 (9.9%) |
| 60 to 89 Minutes | 41 (16.1%) | 35 (15.1%) |
| 90 or more Minutes | 0 (0.0%) | 9 (3.9%) |
Time of Departure to Work by Sex in Samson
The most frequent times of departure to work in Samson are 7:00 AM to 7:29 AM (53, 20.8%) for males and 6:00 AM to 6:29 AM (53, 22.8%) for females.
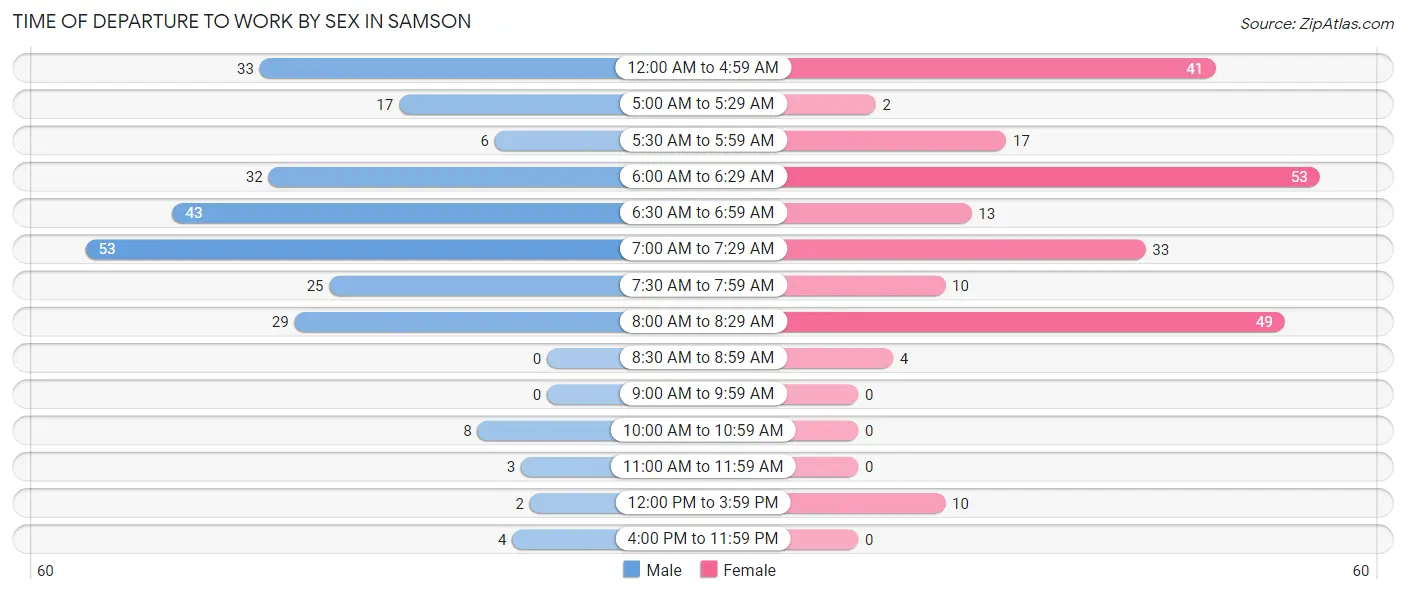
| Time of Departure | Male | Female |
| 12:00 AM to 4:59 AM | 33 (12.9%) | 41 (17.7%) |
| 5:00 AM to 5:29 AM | 17 (6.7%) | 2 (0.9%) |
| 5:30 AM to 5:59 AM | 6 (2.4%) | 17 (7.3%) |
| 6:00 AM to 6:29 AM | 32 (12.6%) | 53 (22.8%) |
| 6:30 AM to 6:59 AM | 43 (16.9%) | 13 (5.6%) |
| 7:00 AM to 7:29 AM | 53 (20.8%) | 33 (14.2%) |
| 7:30 AM to 7:59 AM | 25 (9.8%) | 10 (4.3%) |
| 8:00 AM to 8:29 AM | 29 (11.4%) | 49 (21.1%) |
| 8:30 AM to 8:59 AM | 0 (0.0%) | 4 (1.7%) |
| 9:00 AM to 9:59 AM | 0 (0.0%) | 0 (0.0%) |
| 10:00 AM to 10:59 AM | 8 (3.1%) | 0 (0.0%) |
| 11:00 AM to 11:59 AM | 3 (1.2%) | 0 (0.0%) |
| 12:00 PM to 3:59 PM | 2 (0.8%) | 10 (4.3%) |
| 4:00 PM to 11:59 PM | 4 (1.6%) | 0 (0.0%) |
| Total | 255 (100.0%) | 232 (100.0%) |
Housing Occupancy in Samson
Occupancy by Ownership in Samson
Of the total 635 dwellings in Samson, owner-occupied units account for 369 (58.1%), while renter-occupied units make up 266 (41.9%).
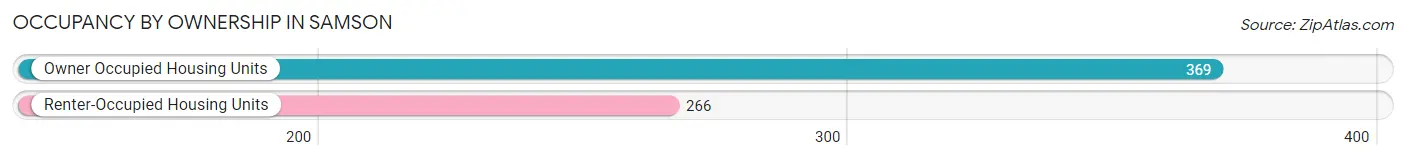
| Occupancy | # Housing Units | % Housing Units |
| Owner Occupied Housing Units | 369 | 58.1% |
| Renter-Occupied Housing Units | 266 | 41.9% |
| Total Occupied Housing Units | 635 | 100.0% |
Occupancy by Household Size in Samson
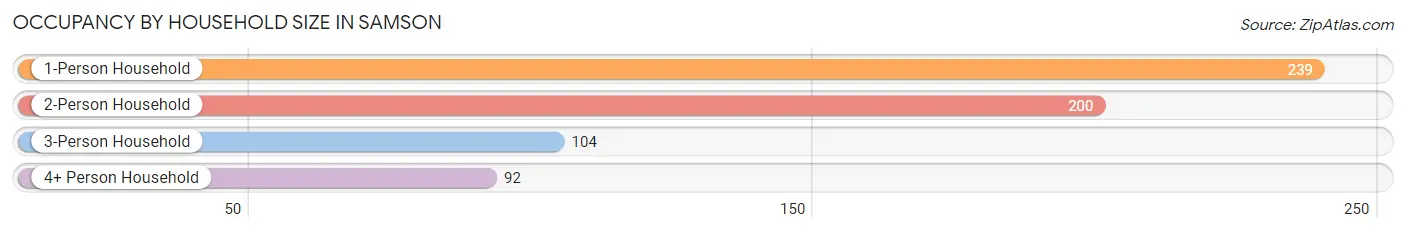
| Household Size | # Housing Units | % Housing Units |
| 1-Person Household | 239 | 37.6% |
| 2-Person Household | 200 | 31.5% |
| 3-Person Household | 104 | 16.4% |
| 4+ Person Household | 92 | 14.5% |
| Total Housing Units | 635 | 100.0% |
Occupancy by Ownership by Household Size in Samson
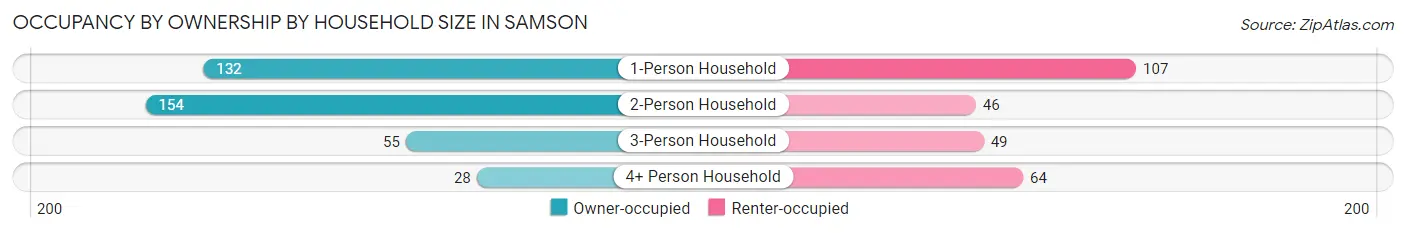
| Household Size | Owner-occupied | Renter-occupied |
| 1-Person Household | 132 (55.2%) | 107 (44.8%) |
| 2-Person Household | 154 (77.0%) | 46 (23.0%) |
| 3-Person Household | 55 (52.9%) | 49 (47.1%) |
| 4+ Person Household | 28 (30.4%) | 64 (69.6%) |
| Total Housing Units | 369 (58.1%) | 266 (41.9%) |
Occupancy by Educational Attainment in Samson
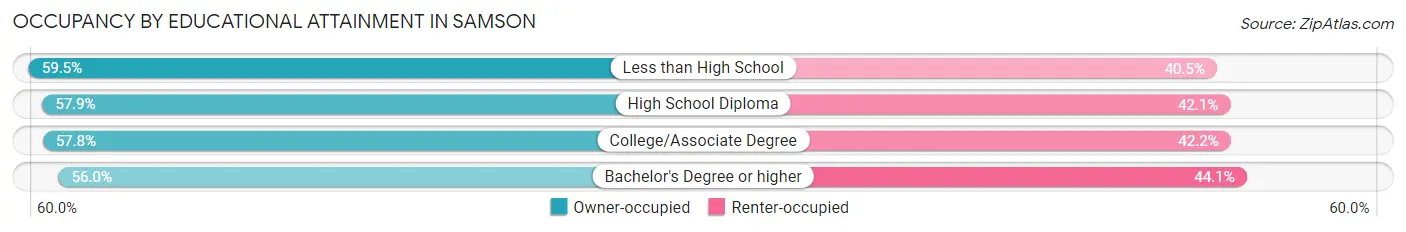
| Household Size | Owner-occupied | Renter-occupied |
| Less than High School | 116 (59.5%) | 79 (40.5%) |
| High School Diploma | 99 (57.9%) | 72 (42.1%) |
| College/Associate Degree | 107 (57.8%) | 78 (42.2%) |
| Bachelor's Degree or higher | 47 (55.9%) | 37 (44.1%) |
Occupancy by Age of Householder in Samson
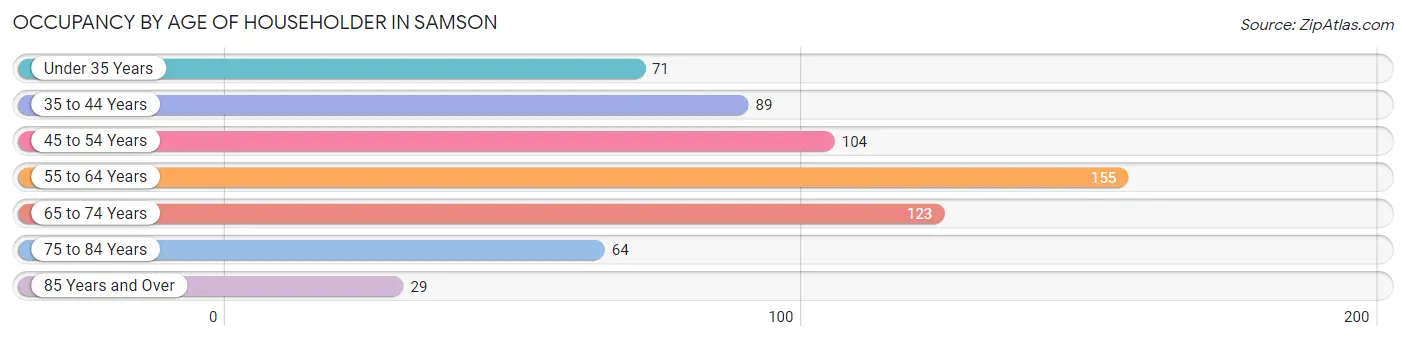
| Age Bracket | # Households | % Households |
| Under 35 Years | 71 | 11.2% |
| 35 to 44 Years | 89 | 14.0% |
| 45 to 54 Years | 104 | 16.4% |
| 55 to 64 Years | 155 | 24.4% |
| 65 to 74 Years | 123 | 19.4% |
| 75 to 84 Years | 64 | 10.1% |
| 85 Years and Over | 29 | 4.6% |
| Total | 635 | 100.0% |
Housing Finances in Samson
Median Income by Occupancy in Samson
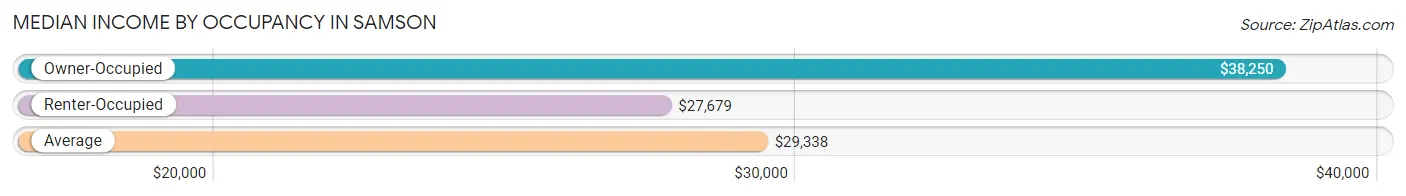
| Occupancy Type | # Households | Median Income |
| Owner-Occupied | 369 (58.1%) | $38,250 |
| Renter-Occupied | 266 (41.9%) | $27,679 |
| Average | 635 (100.0%) | $29,338 |
Occupancy by Householder Income Bracket in Samson
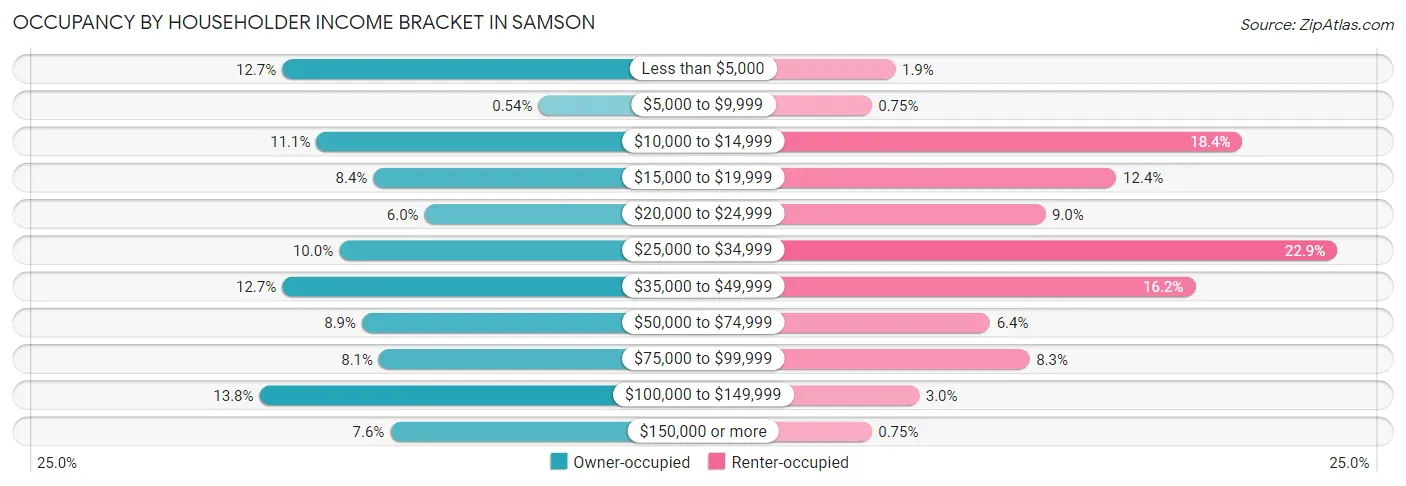
| Income Bracket | Owner-occupied | Renter-occupied |
| Less than $5,000 | 47 (12.7%) | 5 (1.9%) |
| $5,000 to $9,999 | 2 (0.5%) | 2 (0.7%) |
| $10,000 to $14,999 | 41 (11.1%) | 49 (18.4%) |
| $15,000 to $19,999 | 31 (8.4%) | 33 (12.4%) |
| $20,000 to $24,999 | 22 (6.0%) | 24 (9.0%) |
| $25,000 to $34,999 | 37 (10.0%) | 61 (22.9%) |
| $35,000 to $49,999 | 47 (12.7%) | 43 (16.2%) |
| $50,000 to $74,999 | 33 (8.9%) | 17 (6.4%) |
| $75,000 to $99,999 | 30 (8.1%) | 22 (8.3%) |
| $100,000 to $149,999 | 51 (13.8%) | 8 (3.0%) |
| $150,000 or more | 28 (7.6%) | 2 (0.7%) |
| Total | 369 (100.0%) | 266 (100.0%) |
Monthly Housing Cost Tiers in Samson
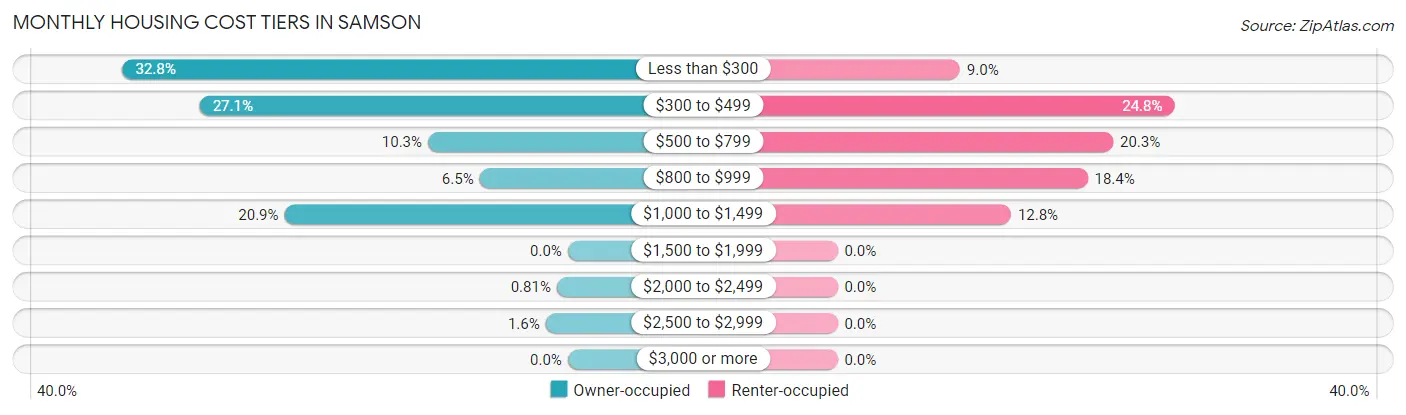
| Monthly Cost | Owner-occupied | Renter-occupied |
| Less than $300 | 121 (32.8%) | 24 (9.0%) |
| $300 to $499 | 100 (27.1%) | 66 (24.8%) |
| $500 to $799 | 38 (10.3%) | 54 (20.3%) |
| $800 to $999 | 24 (6.5%) | 49 (18.4%) |
| $1,000 to $1,499 | 77 (20.9%) | 34 (12.8%) |
| $1,500 to $1,999 | 0 (0.0%) | 0 (0.0%) |
| $2,000 to $2,499 | 3 (0.8%) | 0 (0.0%) |
| $2,500 to $2,999 | 6 (1.6%) | 0 (0.0%) |
| $3,000 or more | 0 (0.0%) | 0 (0.0%) |
| Total | 369 (100.0%) | 266 (100.0%) |
Physical Housing Characteristics in Samson
Housing Structures in Samson
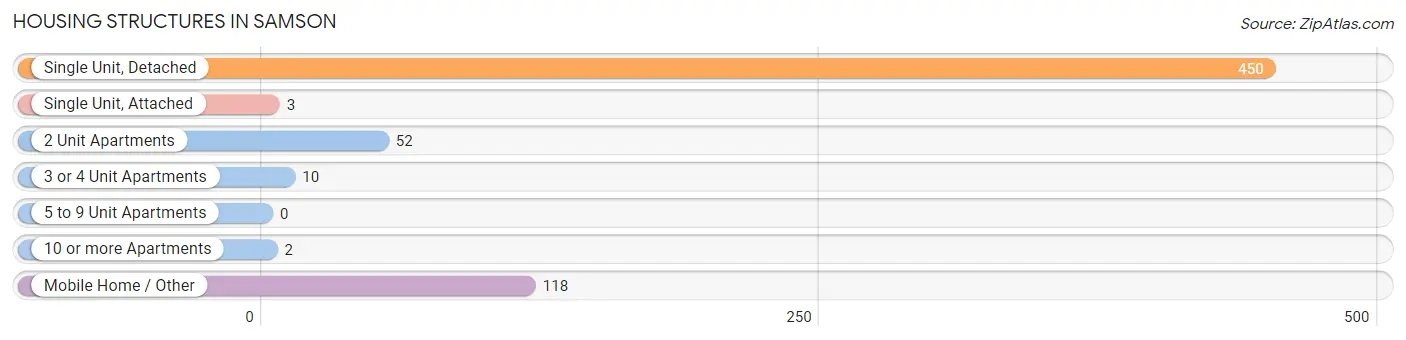
| Structure Type | # Housing Units | % Housing Units |
| Single Unit, Detached | 450 | 70.9% |
| Single Unit, Attached | 3 | 0.5% |
| 2 Unit Apartments | 52 | 8.2% |
| 3 or 4 Unit Apartments | 10 | 1.6% |
| 5 to 9 Unit Apartments | 0 | 0.0% |
| 10 or more Apartments | 2 | 0.3% |
| Mobile Home / Other | 118 | 18.6% |
| Total | 635 | 100.0% |
Housing Structures by Occupancy in Samson
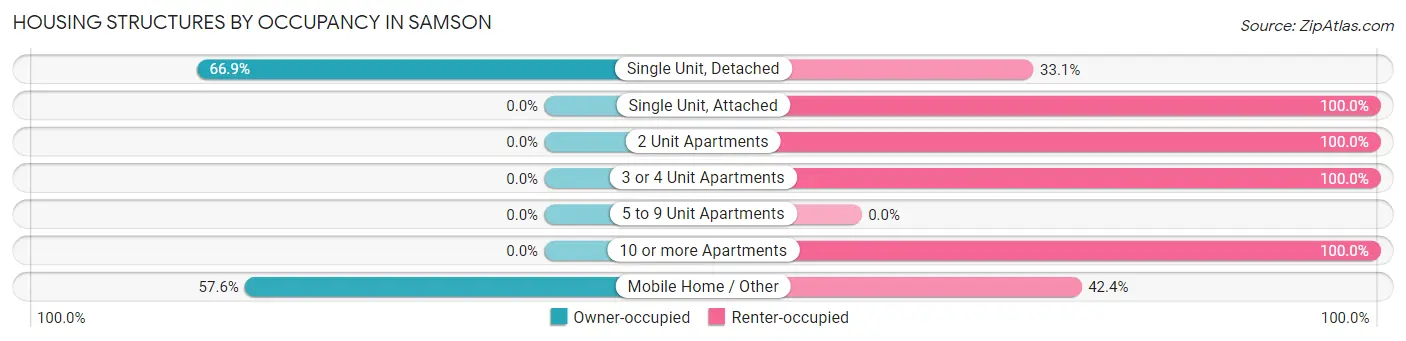
| Structure Type | Owner-occupied | Renter-occupied |
| Single Unit, Detached | 301 (66.9%) | 149 (33.1%) |
| Single Unit, Attached | 0 (0.0%) | 3 (100.0%) |
| 2 Unit Apartments | 0 (0.0%) | 52 (100.0%) |
| 3 or 4 Unit Apartments | 0 (0.0%) | 10 (100.0%) |
| 5 to 9 Unit Apartments | 0 (0.0%) | 0 (0.0%) |
| 10 or more Apartments | 0 (0.0%) | 2 (100.0%) |
| Mobile Home / Other | 68 (57.6%) | 50 (42.4%) |
| Total | 369 (58.1%) | 266 (41.9%) |
Housing Structures by Number of Rooms in Samson
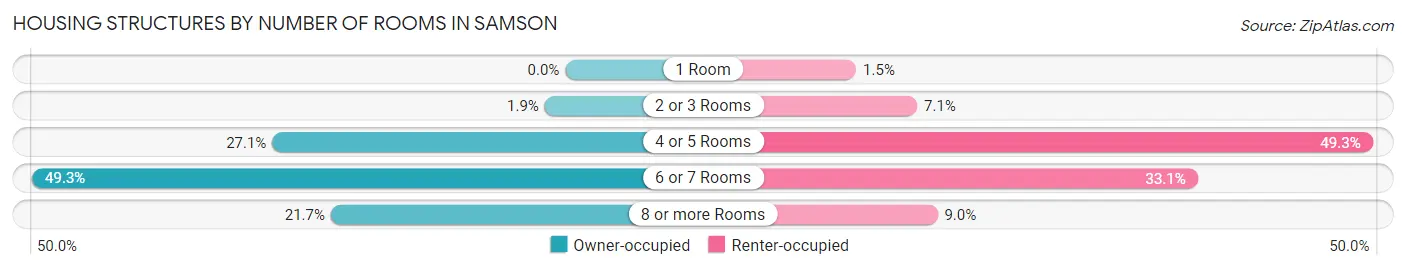
| Number of Rooms | Owner-occupied | Renter-occupied |
| 1 Room | 0 (0.0%) | 4 (1.5%) |
| 2 or 3 Rooms | 7 (1.9%) | 19 (7.1%) |
| 4 or 5 Rooms | 100 (27.1%) | 131 (49.2%) |
| 6 or 7 Rooms | 182 (49.3%) | 88 (33.1%) |
| 8 or more Rooms | 80 (21.7%) | 24 (9.0%) |
| Total | 369 (100.0%) | 266 (100.0%) |
Housing Structure by Heating Type in Samson
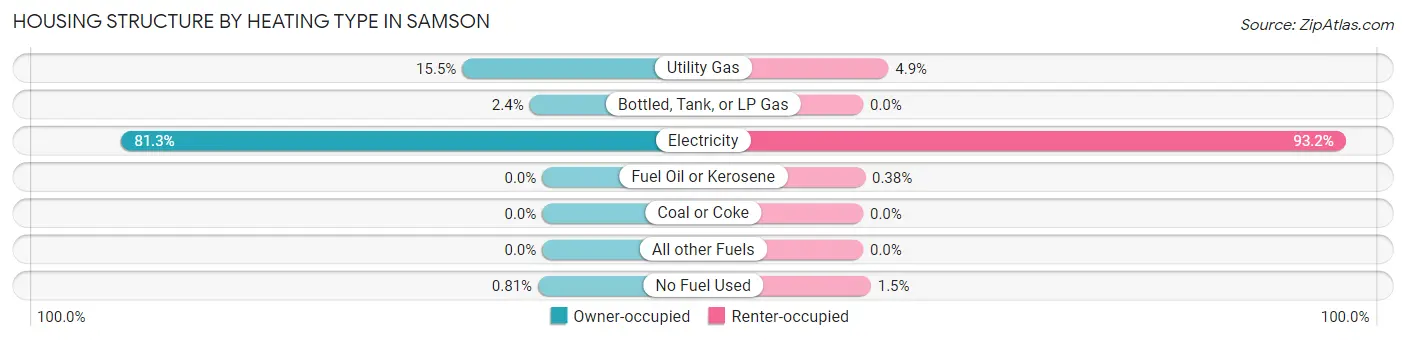
| Heating Type | Owner-occupied | Renter-occupied |
| Utility Gas | 57 (15.4%) | 13 (4.9%) |
| Bottled, Tank, or LP Gas | 9 (2.4%) | 0 (0.0%) |
| Electricity | 300 (81.3%) | 248 (93.2%) |
| Fuel Oil or Kerosene | 0 (0.0%) | 1 (0.4%) |
| Coal or Coke | 0 (0.0%) | 0 (0.0%) |
| All other Fuels | 0 (0.0%) | 0 (0.0%) |
| No Fuel Used | 3 (0.8%) | 4 (1.5%) |
| Total | 369 (100.0%) | 266 (100.0%) |
Household Vehicle Usage in Samson
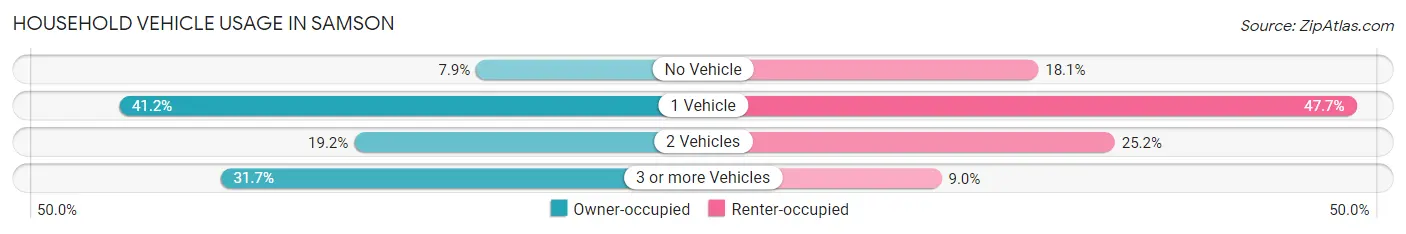
| Vehicles per Household | Owner-occupied | Renter-occupied |
| No Vehicle | 29 (7.9%) | 48 (18.0%) |
| 1 Vehicle | 152 (41.2%) | 127 (47.7%) |
| 2 Vehicles | 71 (19.2%) | 67 (25.2%) |
| 3 or more Vehicles | 117 (31.7%) | 24 (9.0%) |
| Total | 369 (100.0%) | 266 (100.0%) |
Real Estate & Mortgages in Samson
Real Estate and Mortgage Overview in Samson
| Characteristic | Without Mortgage | With Mortgage |
| Housing Units | 235 | 134 |
| Median Property Value | $68,000 | $87,700 |
| Median Household Income | $25,208 | $28 |
| Monthly Housing Costs | $298 | $0 |
| Real Estate Taxes | $199 | $23 |
Property Value by Mortgage Status in Samson
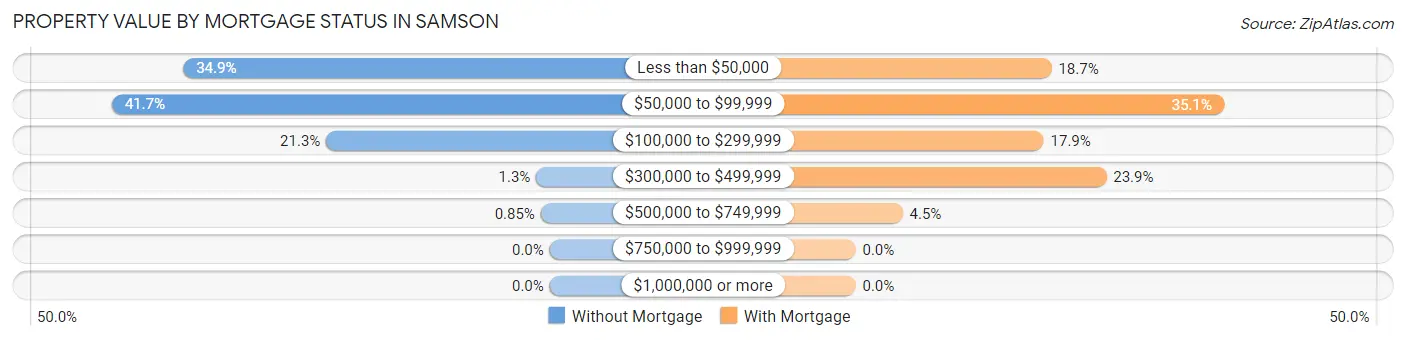
| Property Value | Without Mortgage | With Mortgage |
| Less than $50,000 | 82 (34.9%) | 25 (18.7%) |
| $50,000 to $99,999 | 98 (41.7%) | 47 (35.1%) |
| $100,000 to $299,999 | 50 (21.3%) | 24 (17.9%) |
| $300,000 to $499,999 | 3 (1.3%) | 32 (23.9%) |
| $500,000 to $749,999 | 2 (0.9%) | 6 (4.5%) |
| $750,000 to $999,999 | 0 (0.0%) | 0 (0.0%) |
| $1,000,000 or more | 0 (0.0%) | 0 (0.0%) |
| Total | 235 (100.0%) | 134 (100.0%) |
Household Income by Mortgage Status in Samson
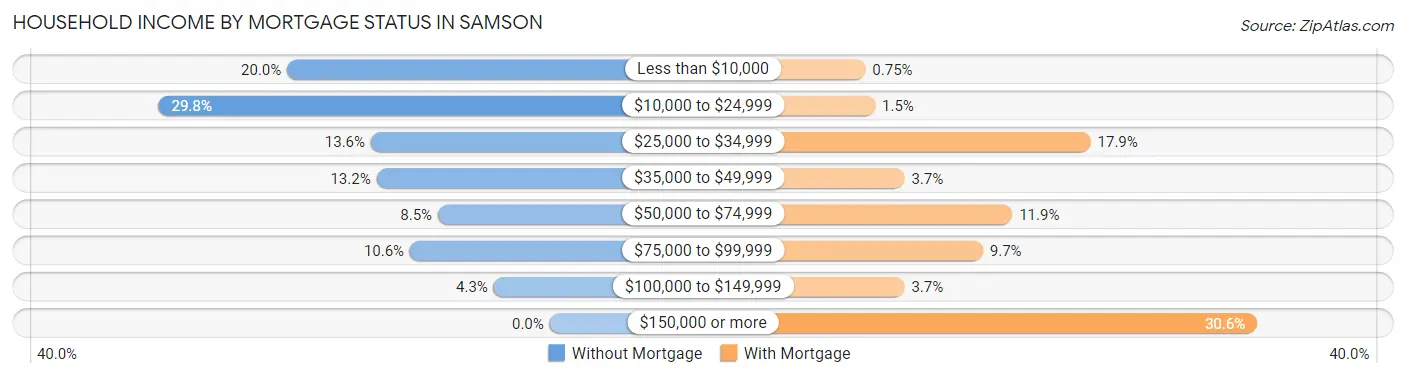
| Household Income | Without Mortgage | With Mortgage |
| Less than $10,000 | 47 (20.0%) | 1 (0.7%) |
| $10,000 to $24,999 | 70 (29.8%) | 2 (1.5%) |
| $25,000 to $34,999 | 32 (13.6%) | 24 (17.9%) |
| $35,000 to $49,999 | 31 (13.2%) | 5 (3.7%) |
| $50,000 to $74,999 | 20 (8.5%) | 16 (11.9%) |
| $75,000 to $99,999 | 25 (10.6%) | 13 (9.7%) |
| $100,000 to $149,999 | 10 (4.3%) | 5 (3.7%) |
| $150,000 or more | 0 (0.0%) | 41 (30.6%) |
| Total | 235 (100.0%) | 134 (100.0%) |
Property Value to Household Income Ratio in Samson
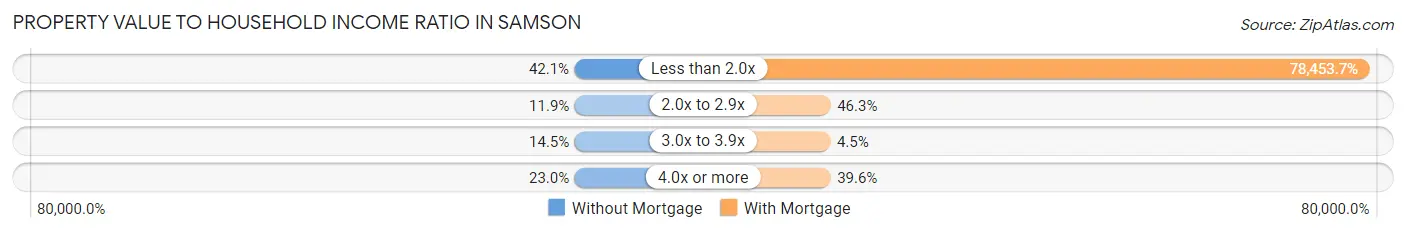
| Value-to-Income Ratio | Without Mortgage | With Mortgage |
| Less than 2.0x | 99 (42.1%) | 105,128 (78,453.7%) |
| 2.0x to 2.9x | 28 (11.9%) | 62 (46.3%) |
| 3.0x to 3.9x | 34 (14.5%) | 6 (4.5%) |
| 4.0x or more | 54 (23.0%) | 53 (39.6%) |
| Total | 235 (100.0%) | 134 (100.0%) |
Real Estate Taxes by Mortgage Status in Samson
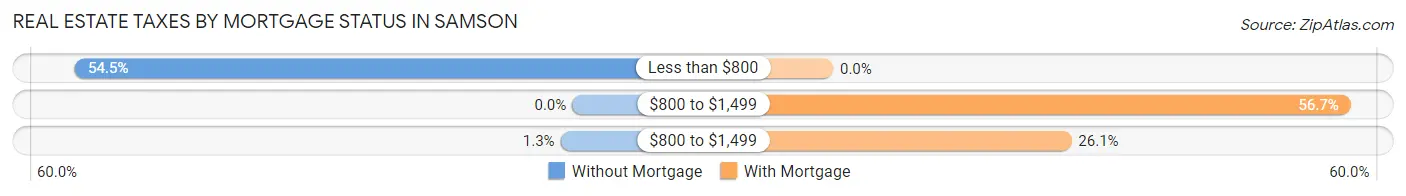
| Property Taxes | Without Mortgage | With Mortgage |
| Less than $800 | 128 (54.5%) | 0 (0.0%) |
| $800 to $1,499 | 0 (0.0%) | 76 (56.7%) |
| $800 to $1,499 | 3 (1.3%) | 35 (26.1%) |
| Total | 235 (100.0%) | 134 (100.0%) |
Health & Disability in Samson
Health Insurance Coverage by Age in Samson
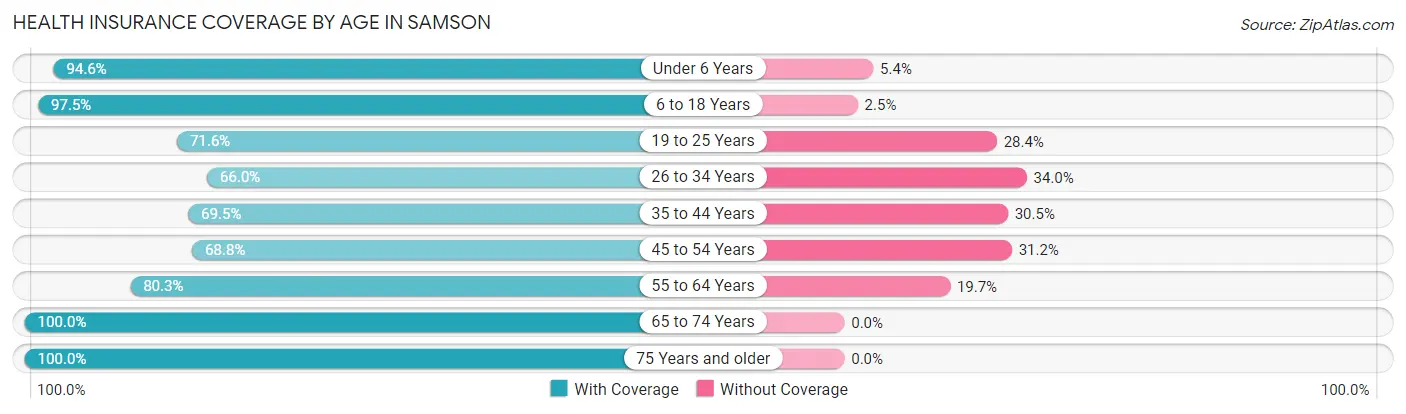
| Age Bracket | With Coverage | Without Coverage |
| Under 6 Years | 88 (94.6%) | 5 (5.4%) |
| 6 to 18 Years | 235 (97.5%) | 6 (2.5%) |
| 19 to 25 Years | 68 (71.6%) | 27 (28.4%) |
| 26 to 34 Years | 99 (66.0%) | 51 (34.0%) |
| 35 to 44 Years | 130 (69.5%) | 57 (30.5%) |
| 45 to 54 Years | 130 (68.8%) | 59 (31.2%) |
| 55 to 64 Years | 212 (80.3%) | 52 (19.7%) |
| 65 to 74 Years | 190 (100.0%) | 0 (0.0%) |
| 75 Years and older | 104 (100.0%) | 0 (0.0%) |
| Total | 1,256 (83.0%) | 257 (17.0%) |
Health Insurance Coverage by Citizenship Status in Samson
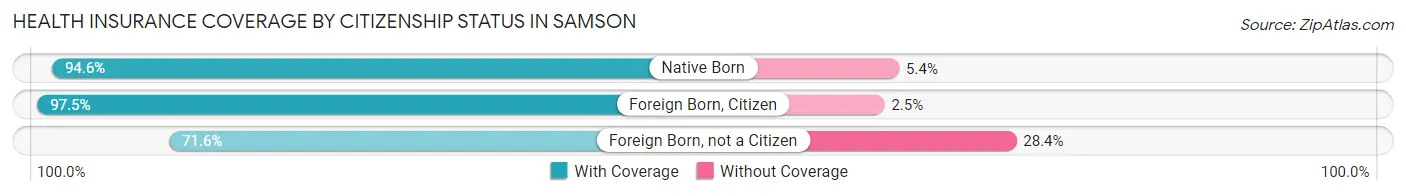
| Citizenship Status | With Coverage | Without Coverage |
| Native Born | 88 (94.6%) | 5 (5.4%) |
| Foreign Born, Citizen | 235 (97.5%) | 6 (2.5%) |
| Foreign Born, not a Citizen | 68 (71.6%) | 27 (28.4%) |
Health Insurance Coverage by Household Income in Samson
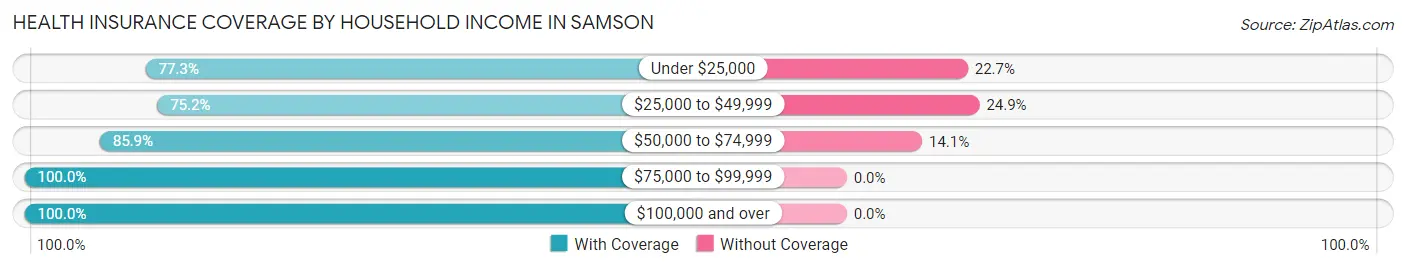
| Household Income | With Coverage | Without Coverage |
| Under $25,000 | 382 (77.3%) | 112 (22.7%) |
| $25,000 to $49,999 | 372 (75.1%) | 123 (24.8%) |
| $50,000 to $74,999 | 134 (85.9%) | 22 (14.1%) |
| $75,000 to $99,999 | 155 (100.0%) | 0 (0.0%) |
| $100,000 and over | 210 (100.0%) | 0 (0.0%) |
Public vs Private Health Insurance Coverage by Age in Samson
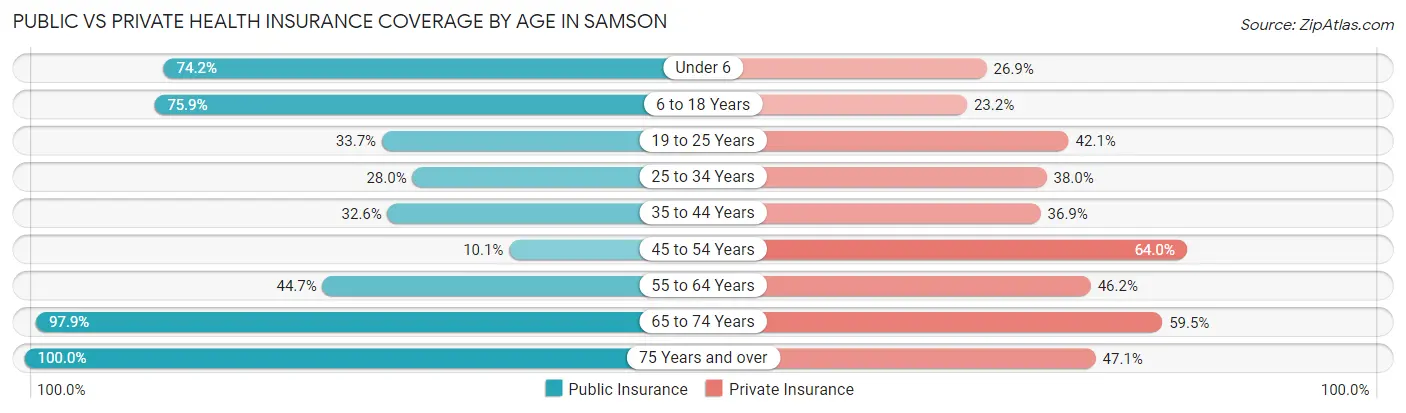
| Age Bracket | Public Insurance | Private Insurance |
| Under 6 | 69 (74.2%) | 25 (26.9%) |
| 6 to 18 Years | 183 (75.9%) | 56 (23.2%) |
| 19 to 25 Years | 32 (33.7%) | 40 (42.1%) |
| 25 to 34 Years | 42 (28.0%) | 57 (38.0%) |
| 35 to 44 Years | 61 (32.6%) | 69 (36.9%) |
| 45 to 54 Years | 19 (10.1%) | 121 (64.0%) |
| 55 to 64 Years | 118 (44.7%) | 122 (46.2%) |
| 65 to 74 Years | 186 (97.9%) | 113 (59.5%) |
| 75 Years and over | 104 (100.0%) | 49 (47.1%) |
| Total | 814 (53.8%) | 652 (43.1%) |
Disability Status by Sex by Age in Samson
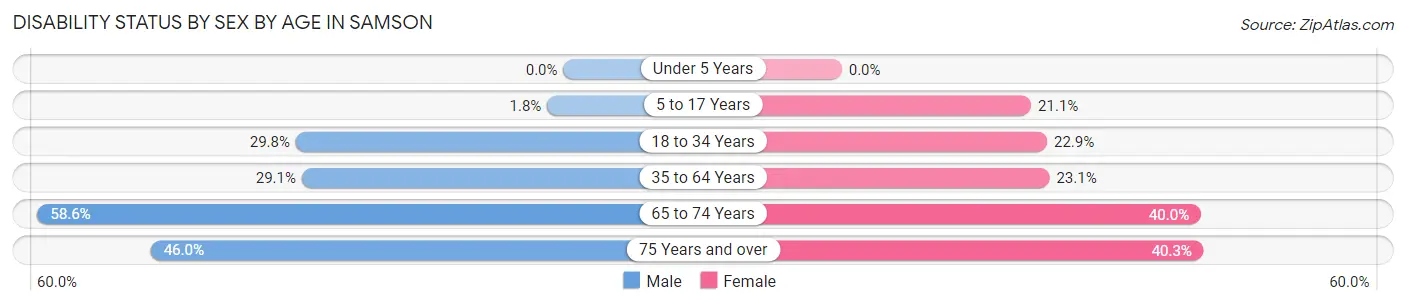
| Age Bracket | Male | Female |
| Under 5 Years | 0 (0.0%) | 0 (0.0%) |
| 5 to 17 Years | 2 (1.8%) | 27 (21.1%) |
| 18 to 34 Years | 45 (29.8%) | 24 (22.9%) |
| 35 to 64 Years | 97 (29.1%) | 71 (23.1%) |
| 65 to 74 Years | 41 (58.6%) | 48 (40.0%) |
| 75 Years and over | 17 (46.0%) | 27 (40.3%) |
Disability Class by Sex by Age in Samson
Disability Class: Hearing Difficulty
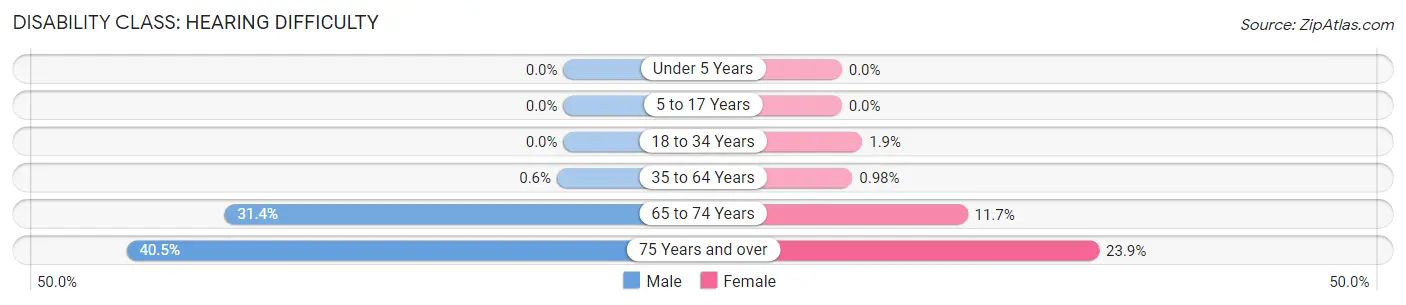
| Age Bracket | Male | Female |
| Under 5 Years | 0 (0.0%) | 0 (0.0%) |
| 5 to 17 Years | 0 (0.0%) | 0 (0.0%) |
| 18 to 34 Years | 0 (0.0%) | 2 (1.9%) |
| 35 to 64 Years | 2 (0.6%) | 3 (1.0%) |
| 65 to 74 Years | 22 (31.4%) | 14 (11.7%) |
| 75 Years and over | 15 (40.5%) | 16 (23.9%) |
Disability Class: Vision Difficulty
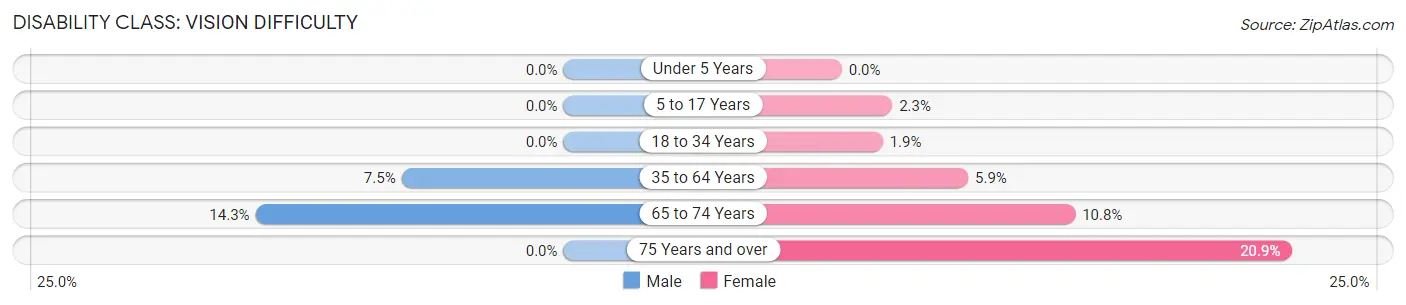
| Age Bracket | Male | Female |
| Under 5 Years | 0 (0.0%) | 0 (0.0%) |
| 5 to 17 Years | 0 (0.0%) | 3 (2.3%) |
| 18 to 34 Years | 0 (0.0%) | 2 (1.9%) |
| 35 to 64 Years | 25 (7.5%) | 18 (5.9%) |
| 65 to 74 Years | 10 (14.3%) | 13 (10.8%) |
| 75 Years and over | 0 (0.0%) | 14 (20.9%) |
Disability Class: Cognitive Difficulty
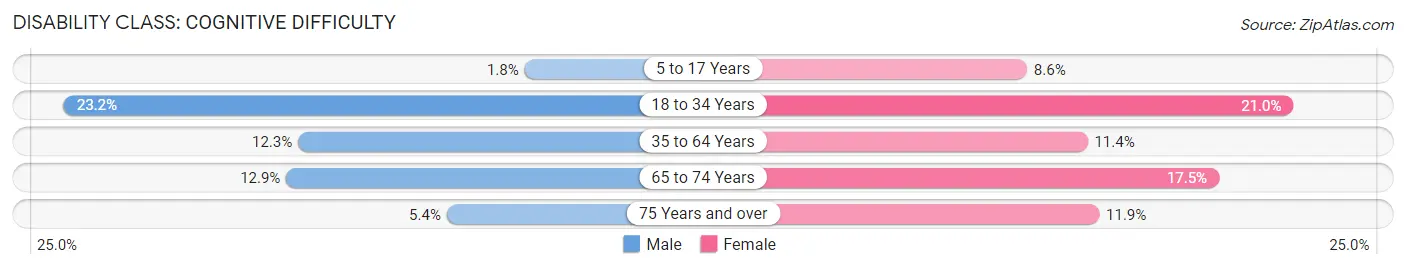
| Age Bracket | Male | Female |
| 5 to 17 Years | 2 (1.8%) | 11 (8.6%) |
| 18 to 34 Years | 35 (23.2%) | 22 (20.9%) |
| 35 to 64 Years | 41 (12.3%) | 35 (11.4%) |
| 65 to 74 Years | 9 (12.9%) | 21 (17.5%) |
| 75 Years and over | 2 (5.4%) | 8 (11.9%) |
Disability Class: Ambulatory Difficulty
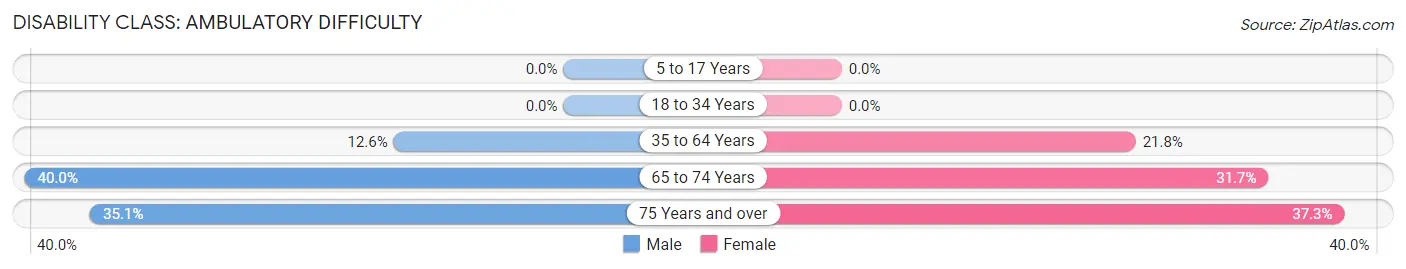
| Age Bracket | Male | Female |
| 5 to 17 Years | 0 (0.0%) | 0 (0.0%) |
| 18 to 34 Years | 0 (0.0%) | 0 (0.0%) |
| 35 to 64 Years | 42 (12.6%) | 67 (21.8%) |
| 65 to 74 Years | 28 (40.0%) | 38 (31.7%) |
| 75 Years and over | 13 (35.1%) | 25 (37.3%) |
Disability Class: Self-Care Difficulty
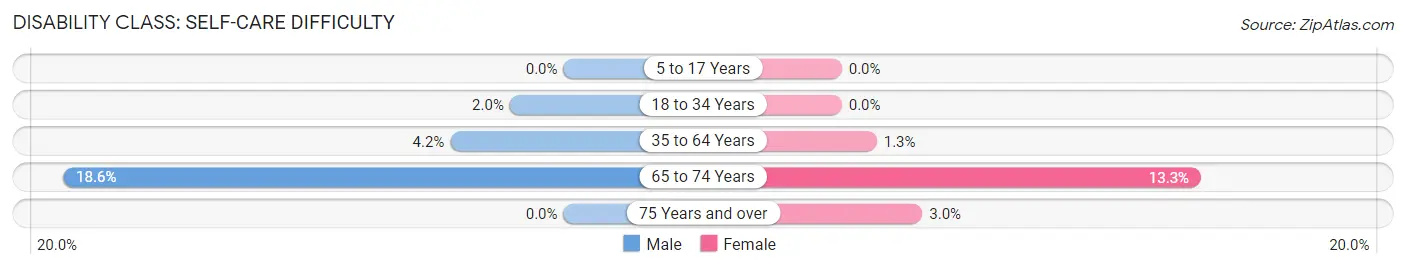
| Age Bracket | Male | Female |
| 5 to 17 Years | 0 (0.0%) | 0 (0.0%) |
| 18 to 34 Years | 3 (2.0%) | 0 (0.0%) |
| 35 to 64 Years | 14 (4.2%) | 4 (1.3%) |
| 65 to 74 Years | 13 (18.6%) | 16 (13.3%) |
| 75 Years and over | 0 (0.0%) | 2 (3.0%) |
Technology Access in Samson
Computing Device Access in Samson
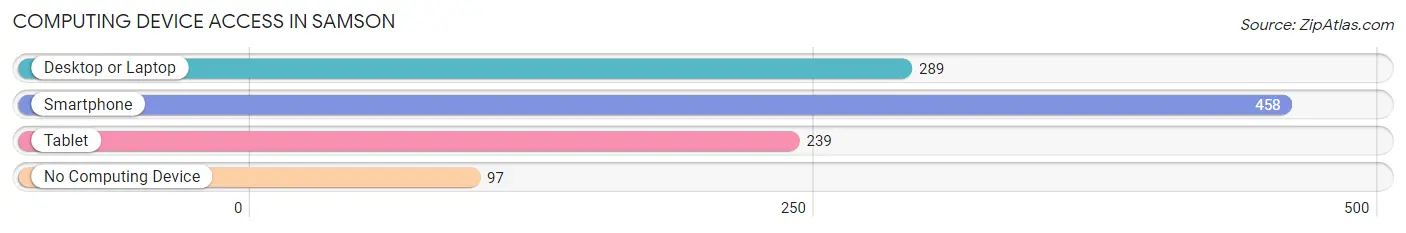
| Device Type | # Households | % Households |
| Desktop or Laptop | 289 | 45.5% |
| Smartphone | 458 | 72.1% |
| Tablet | 239 | 37.6% |
| No Computing Device | 97 | 15.3% |
| Total | 635 | 100.0% |
Internet Access in Samson
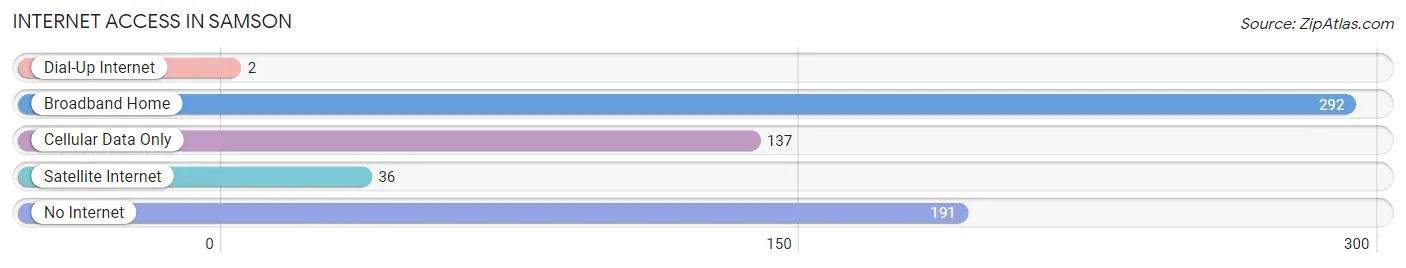
| Internet Type | # Households | % Households |
| Dial-Up Internet | 2 | 0.3% |
| Broadband Home | 292 | 46.0% |
| Cellular Data Only | 137 | 21.6% |
| Satellite Internet | 36 | 5.7% |
| No Internet | 191 | 30.1% |
| Total | 635 | 100.0% |
Samson Summary
Samson, Alabama is a small town located in the southeastern corner of the state, in Geneva County. It is situated on the banks of the Choctawhatchee River, and is home to a population of approximately 2,500 people. The town was founded in 1883 and was named after the Biblical figure, Samson.
Geography
Samson is located in the southeastern corner of Alabama, in Geneva County. It is situated on the banks of the Choctawhatchee River, and is bordered by the cities of Geneva, Hartford, and Slocomb. The town is located approximately 30 miles from the Florida border, and is about an hour and a half drive from the state capital of Montgomery. The town has a total area of 4.2 square miles, all of which is land.
Economy
The economy of Samson is largely based on agriculture and forestry. The town is home to several large farms, as well as a number of smaller family-owned farms. The town is also home to several timber companies, which harvest and process timber for use in construction and other industries. In addition to agriculture and forestry, Samson is home to a number of small businesses, including restaurants, retail stores, and service providers.
Demographics
As of the 2010 census, the population of Samson was 2,543. The racial makeup of the town was 79.3% White, 18.2% African American, 0.3% Native American, 0.3% Asian, 0.1% Pacific Islander, 0.7% from other races, and 1.2% from two or more races. Hispanic or Latino of any race were 1.7% of the population.
The median income for a household in the town was $30,938, and the median income for a family was $37,917. The per capita income for the town was $15,945. About 17.2% of families and 20.2% of the population were below the poverty line, including 28.3% of those under age 18 and 16.2% of those age 65 or over.
Education
Samson is served by the Geneva County School District, which operates three elementary schools, one middle school, and one high school. The town is also home to a number of private schools, including a Christian school and a Montessori school. In addition, the town is home to Wallace Community College, which offers a variety of associate degree and certificate programs.
Conclusion
Samson, Alabama is a small town located in the southeastern corner of the state, in Geneva County. It is situated on the banks of the Choctawhatchee River, and is home to a population of approximately 2,500 people. The town was founded in 1883 and was named after the Biblical figure, Samson. The economy of Samson is largely based on agriculture and forestry, and the town is home to several large farms, as well as a number of smaller family-owned farms. The town is also home to several timber companies, which harvest and process timber for use in construction and other industries. The town is served by the Geneva County School District, which operates three elementary schools, one middle school, and one high school. In addition, the town is home to Wallace Community College, which offers a variety of associate degree and certificate programs.
Common Questions
What is the Total Population of Samson?
Total Population of Samson is 1,513.
What is the Total Male Population of Samson?
Total Male Population of Samson is 753.
What is the Total Female Population of Samson?
Total Female Population of Samson is 760.
What is the Ratio of Males per 100 Females in Samson?
There are 99.08 Males per 100 Females in Samson.
What is the Ratio of Females per 100 Males in Samson?
There are 100.93 Females per 100 Males in Samson.
What is the Median Population Age in Samson?
Median Population Age in Samson is 44.5 Years.
What is the Average Family Size in Samson
Average Family Size in Samson is 3.1 People.
What is the Average Household Size in Samson
Average Household Size in Samson is 2.4 People.
What is Per Capita Income in Samson?
Per Capita income in Samson is $22,198.
What is the Median Family Income in Samson?
Median Family Income in Samson is $45,000.
What is the Median Household income in Samson?
Median Household Income in Samson is $29,338.
What is Income or Wage Gap in Samson?
Income or Wage Gap in Samson is 23.4%.
Women in Samson earn 76.6 cents for every dollar earned by a man.
What is Inequality or Gini Index in Samson?
Inequality or Gini Index in Samson is 0.54.
How Large is the Labor Force in Samson?
There are 590 People in the Labor Forcein in Samson.
What is the Percentage of People in the Labor Force in Samson?
47.3% of People are in the Labor Force in Samson.
What is the Unemployment Rate in Samson?
Unemployment Rate in Samson is 12.5%.