Piedmont, AL Map & Demographics
Piedmont Map
Piedmont Overview
$23,940
PER CAPITA INCOME
$59,888
AVG FAMILY INCOME
$44,944
AVG HOUSEHOLD INCOME
12.5%
WAGE / INCOME GAP [ % ]
87.5¢/ $1
WAGE / INCOME GAP [ $ ]
0.44
INEQUALITY / GINI INDEX
4,761
TOTAL POPULATION
2,024
MALE POPULATION
2,737
FEMALE POPULATION
73.95
MALES / 100 FEMALES
135.23
FEMALES / 100 MALES
39.5
MEDIAN AGE
3.4
AVG FAMILY SIZE
2.7
AVG HOUSEHOLD SIZE
2,297
LABOR FORCE [ PEOPLE ]
59.8%
PERCENT IN LABOR FORCE
4.4%
UNEMPLOYMENT RATE
Piedmont Zip Codes
Piedmont Area Codes
Income in Piedmont
Income Overview in Piedmont
Per Capita Income in Piedmont is $23,940, while median incomes of families and households are $59,888 and $44,944 respectively.
| Characteristic | Number | Measure |
| Per Capita Income | 4,761 | $23,940 |
| Median Family Income | 1,067 | $59,888 |
| Mean Family Income | 1,067 | $77,454 |
| Median Household Income | 1,728 | $44,944 |
| Mean Household Income | 1,728 | $61,472 |
| Income Deficit | 1,067 | $0 |
| Wage / Income Gap (%) | 4,761 | 12.55% |
| Wage / Income Gap ($) | 4,761 | 87.45¢ per $1 |
| Gini / Inequality Index | 4,761 | 0.44 |
Earnings by Sex in Piedmont
Average Earnings in Piedmont are $28,370, $26,835 for men and $30,685 for women, a difference of 12.6%.
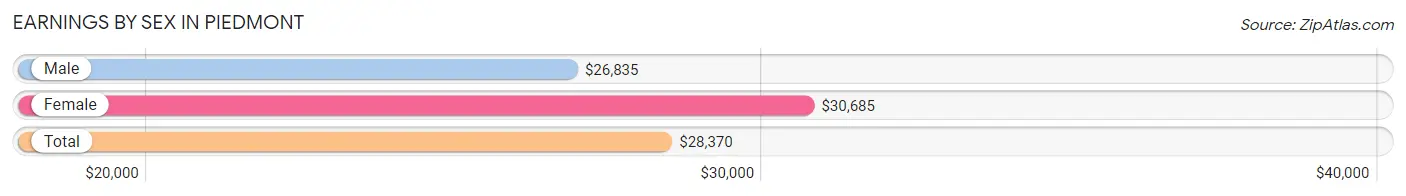
| Sex | Number | Average Earnings |
| Male | 1,247 (49.1%) | $26,835 |
| Female | 1,291 (50.9%) | $30,685 |
| Total | 2,538 (100.0%) | $28,370 |
Earnings by Sex by Income Bracket in Piedmont
The most common earnings brackets in Piedmont are $7,500 to $9,999 for men (216 | 17.3%) and $25,000 to $29,999 for women (156 | 12.1%).
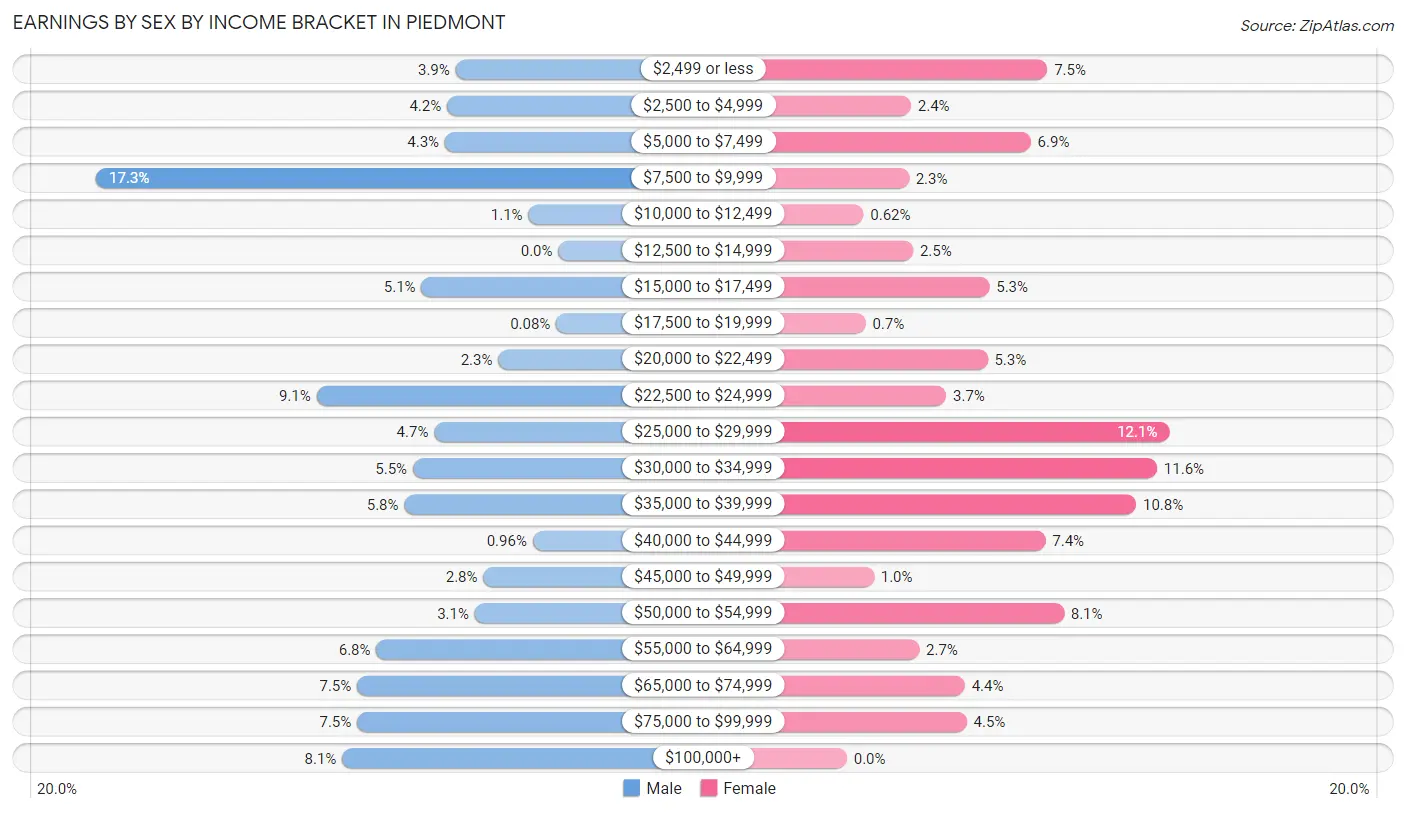
| Income | Male | Female |
| $2,499 or less | 48 (3.8%) | 97 (7.5%) |
| $2,500 to $4,999 | 52 (4.2%) | 31 (2.4%) |
| $5,000 to $7,499 | 53 (4.3%) | 89 (6.9%) |
| $7,500 to $9,999 | 216 (17.3%) | 30 (2.3%) |
| $10,000 to $12,499 | 14 (1.1%) | 8 (0.6%) |
| $12,500 to $14,999 | 0 (0.0%) | 32 (2.5%) |
| $15,000 to $17,499 | 64 (5.1%) | 69 (5.3%) |
| $17,500 to $19,999 | 1 (0.1%) | 9 (0.7%) |
| $20,000 to $22,499 | 28 (2.2%) | 68 (5.3%) |
| $22,500 to $24,999 | 113 (9.1%) | 48 (3.7%) |
| $25,000 to $29,999 | 58 (4.6%) | 156 (12.1%) |
| $30,000 to $34,999 | 68 (5.4%) | 150 (11.6%) |
| $35,000 to $39,999 | 72 (5.8%) | 140 (10.8%) |
| $40,000 to $44,999 | 12 (1.0%) | 96 (7.4%) |
| $45,000 to $49,999 | 35 (2.8%) | 13 (1.0%) |
| $50,000 to $54,999 | 39 (3.1%) | 105 (8.1%) |
| $55,000 to $64,999 | 85 (6.8%) | 35 (2.7%) |
| $65,000 to $74,999 | 94 (7.5%) | 57 (4.4%) |
| $75,000 to $99,999 | 94 (7.5%) | 58 (4.5%) |
| $100,000+ | 101 (8.1%) | 0 (0.0%) |
| Total | 1,247 (100.0%) | 1,291 (100.0%) |
Earnings by Sex by Educational Attainment in Piedmont
Average earnings in Piedmont are $37,547 for men and $34,552 for women, a difference of 8.0%. Men with an educational attainment of bachelor's degree enjoy the highest average annual earnings of $68,542, while those with less than high school education earn the least with $25,357. Women with an educational attainment of graduate degree earn the most with the average annual earnings of $52,333, while those with less than high school education have the smallest earnings of $2,499.
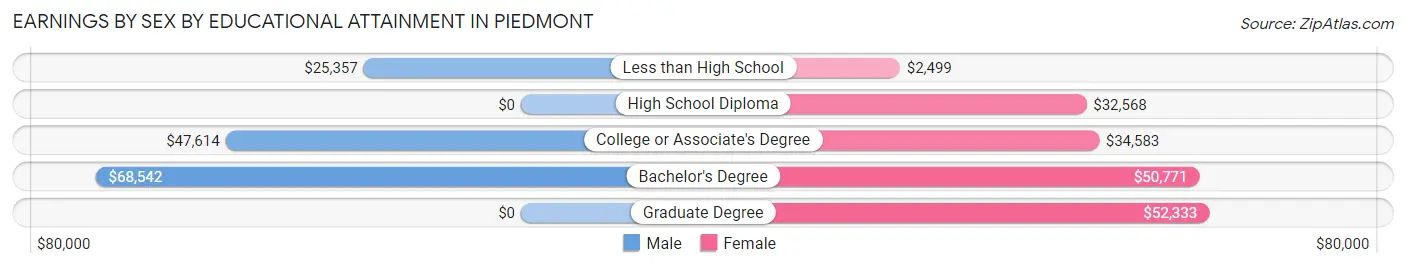
| Educational Attainment | Male Income | Female Income |
| Less than High School | $25,357 | $2,499 |
| High School Diploma | - | - |
| College or Associate's Degree | $47,614 | $34,583 |
| Bachelor's Degree | $68,542 | $50,771 |
| Graduate Degree | - | - |
| Total | $37,547 | $34,552 |
Family Income in Piedmont
Family Income Brackets in Piedmont
According to the Piedmont family income data, there are 220 families falling into the $100,000 to $149,999 income range, which is the most common income bracket and makes up 20.6% of all families. Conversely, the less than $10,000 income bracket is the least frequent group with only 7 families (0.7%) belonging to this category.
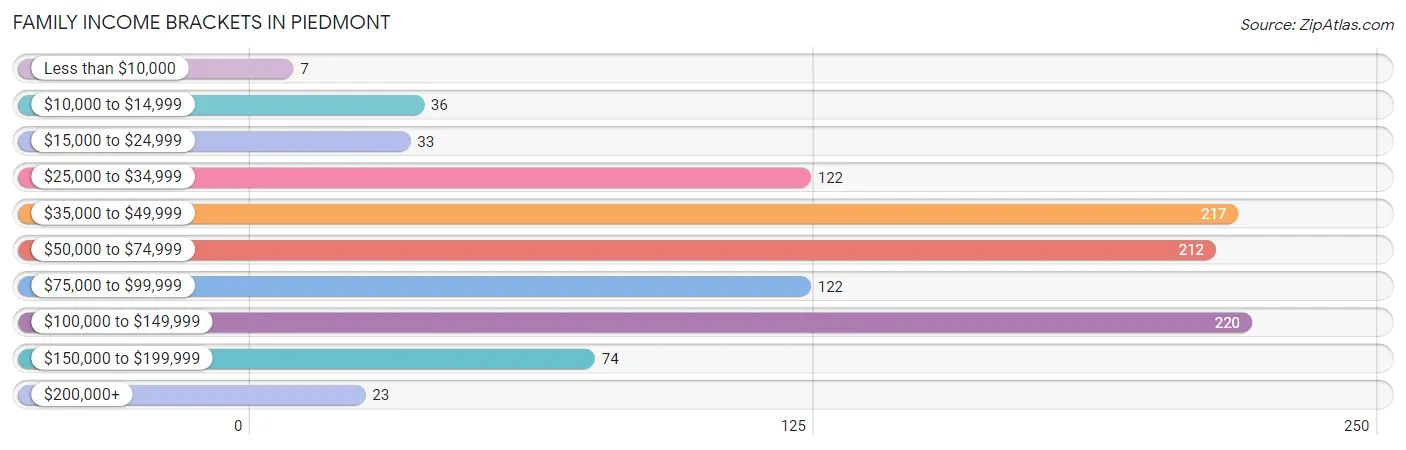
| Income Bracket | # Families | % Families |
| Less than $10,000 | 7 | 0.7% |
| $10,000 to $14,999 | 36 | 3.4% |
| $15,000 to $24,999 | 33 | 3.1% |
| $25,000 to $34,999 | 122 | 11.4% |
| $35,000 to $49,999 | 217 | 20.3% |
| $50,000 to $74,999 | 212 | 19.9% |
| $75,000 to $99,999 | 122 | 11.4% |
| $100,000 to $149,999 | 220 | 20.6% |
| $150,000 to $199,999 | 74 | 6.9% |
| $200,000+ | 23 | 2.2% |
Family Income by Famaliy Size in Piedmont
5-person families (80 | 7.5%) account for the highest median family income in Piedmont with $155,776 per family, while 5-person families (80 | 7.5%) have the highest median income of $31,155 per family member.
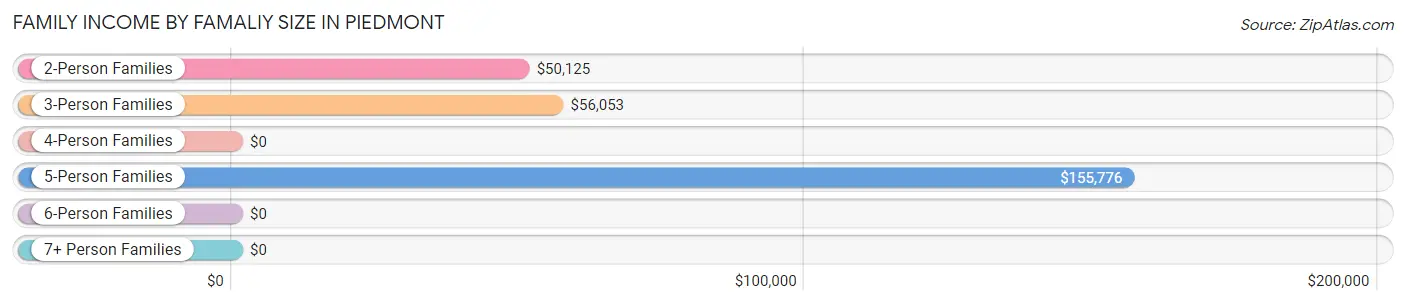
| Income Bracket | # Families | Median Income |
| 2-Person Families | 459 (43.0%) | $50,125 |
| 3-Person Families | 338 (31.7%) | $56,053 |
| 4-Person Families | 171 (16.0%) | $0 |
| 5-Person Families | 80 (7.5%) | $155,776 |
| 6-Person Families | 16 (1.5%) | $0 |
| 7+ Person Families | 3 (0.3%) | $0 |
| Total | 1,067 (100.0%) | $59,888 |
Family Income by Number of Earners in Piedmont
The median family income in Piedmont is $59,888, with families comprising 2 earners (321) having the highest median family income of $121,141, while families with no earners (132) have the lowest median family income of $42,727, accounting for 30.1% and 12.4% of families, respectively.
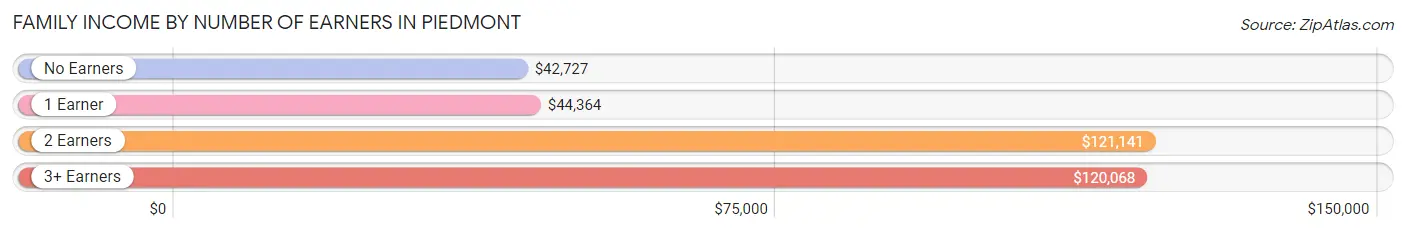
| Number of Earners | # Families | Median Income |
| No Earners | 132 (12.4%) | $42,727 |
| 1 Earner | 434 (40.7%) | $44,364 |
| 2 Earners | 321 (30.1%) | $121,141 |
| 3+ Earners | 180 (16.9%) | $120,068 |
| Total | 1,067 (100.0%) | $59,888 |
Household Income in Piedmont
Household Income Brackets in Piedmont
With 342 households falling in the category, the $50,000 to $74,999 income range is the most frequent in Piedmont, accounting for 19.8% of all households. In contrast, only 22 households (1.3%) fall into the $200,000+ income bracket, making it the least populous group.
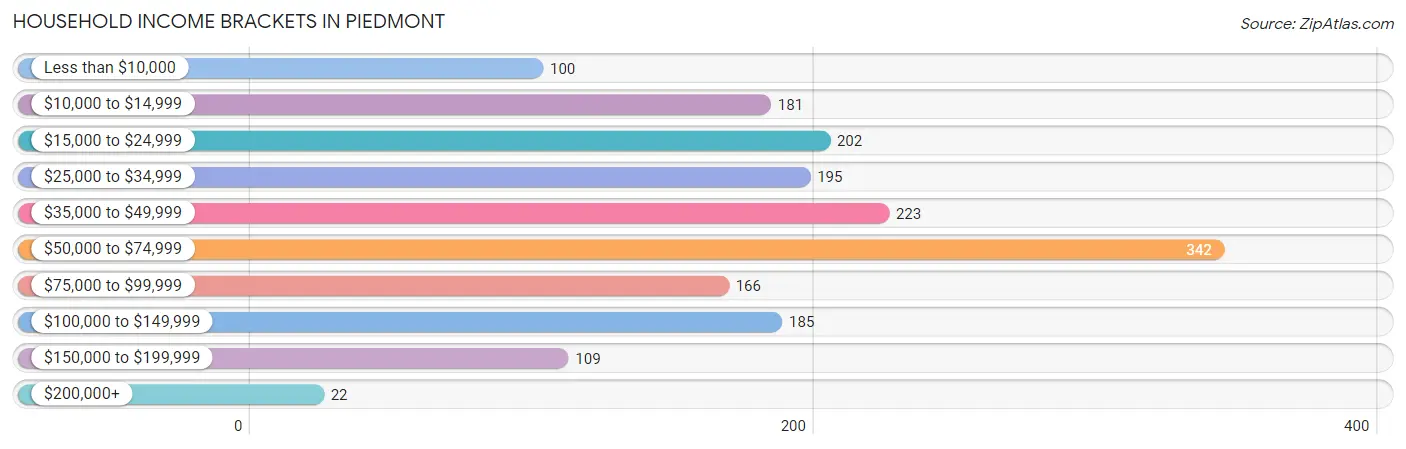
| Income Bracket | # Households | % Households |
| Less than $10,000 | 100 | 5.8% |
| $10,000 to $14,999 | 181 | 10.5% |
| $15,000 to $24,999 | 202 | 11.7% |
| $25,000 to $34,999 | 195 | 11.3% |
| $35,000 to $49,999 | 223 | 12.9% |
| $50,000 to $74,999 | 342 | 19.8% |
| $75,000 to $99,999 | 166 | 9.6% |
| $100,000 to $149,999 | 185 | 10.7% |
| $150,000 to $199,999 | 109 | 6.3% |
| $200,000+ | 22 | 1.3% |
Household Income by Householder Age in Piedmont
The median household income in Piedmont is $44,944, with the highest median household income of $63,702 found in the 15 to 24 years age bracket for the primary householder. A total of 120 households (6.9%) fall into this category. Meanwhile, the 65+ years age bracket for the primary householder has the lowest median household income of $19,915, with 417 households (24.1%) in this group.
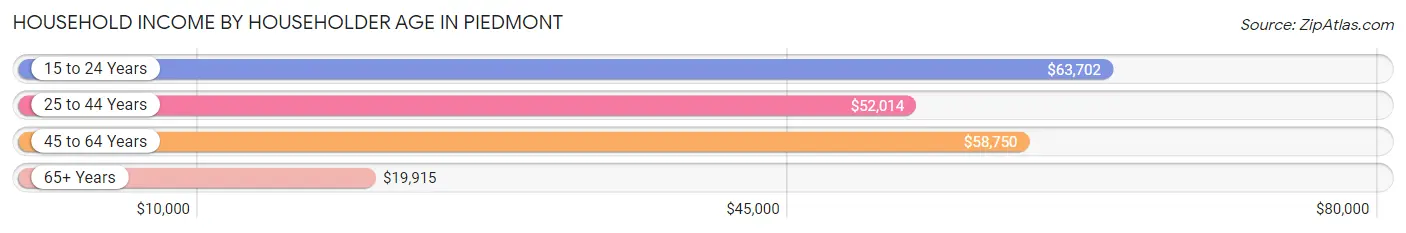
| Income Bracket | # Households | Median Income |
| 15 to 24 Years | 120 (6.9%) | $63,702 |
| 25 to 44 Years | 472 (27.3%) | $52,014 |
| 45 to 64 Years | 719 (41.6%) | $58,750 |
| 65+ Years | 417 (24.1%) | $19,915 |
| Total | 1,728 (100.0%) | $44,944 |
Poverty in Piedmont
Income Below Poverty by Sex and Age in Piedmont
With 14.4% poverty level for males and 15.2% for females among the residents of Piedmont, 6 to 11 year old males and 5 year old females are the most vulnerable to poverty, with 29 males (55.8%) and 2 females (100.0%) in their respective age groups living below the poverty level.
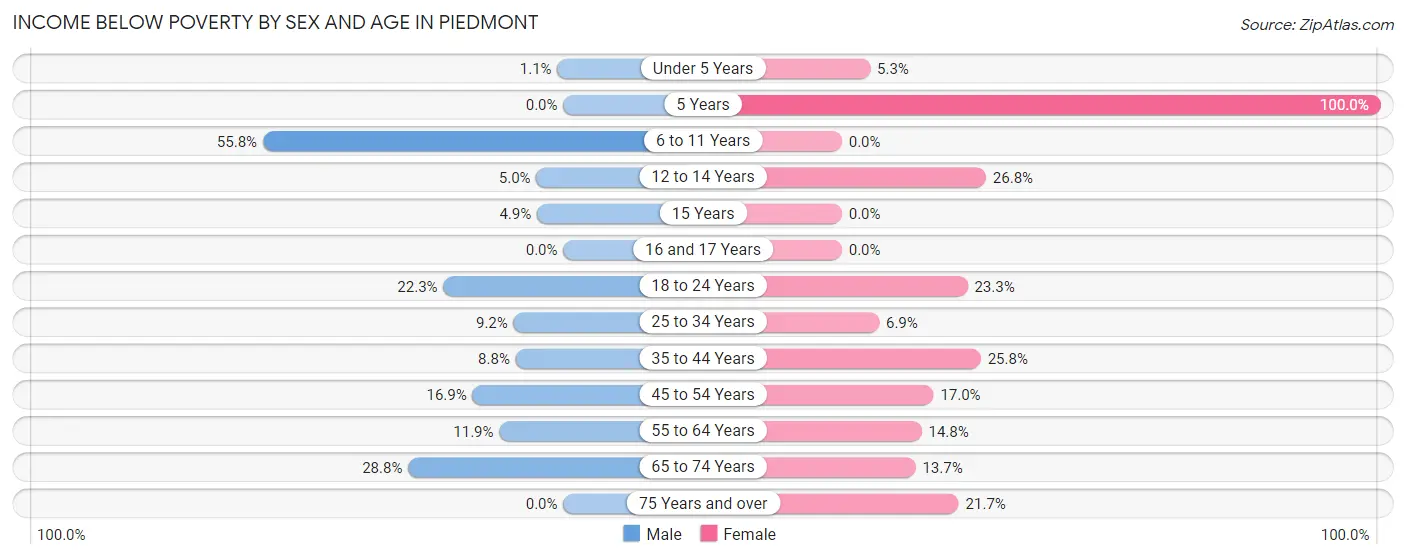
| Age Bracket | Male | Female |
| Under 5 Years | 1 (1.1%) | 11 (5.3%) |
| 5 Years | 0 (0.0%) | 2 (100.0%) |
| 6 to 11 Years | 29 (55.8%) | 0 (0.0%) |
| 12 to 14 Years | 4 (5.0%) | 42 (26.8%) |
| 15 Years | 2 (4.9%) | 0 (0.0%) |
| 16 and 17 Years | 0 (0.0%) | 0 (0.0%) |
| 18 to 24 Years | 69 (22.3%) | 63 (23.3%) |
| 25 to 34 Years | 18 (9.2%) | 27 (6.9%) |
| 35 to 44 Years | 19 (8.8%) | 82 (25.8%) |
| 45 to 54 Years | 57 (16.9%) | 75 (17.0%) |
| 55 to 64 Years | 53 (11.9%) | 37 (14.8%) |
| 65 to 74 Years | 38 (28.8%) | 16 (13.7%) |
| 75 Years and over | 0 (0.0%) | 54 (21.7%) |
| Total | 290 (14.4%) | 409 (15.2%) |
Income Above Poverty by Sex and Age in Piedmont
According to the poverty statistics in Piedmont, males aged 5 years and females aged 6 to 11 years are the age groups that are most secure financially, with 100.0% of males and 100.0% of females in these age groups living above the poverty line.
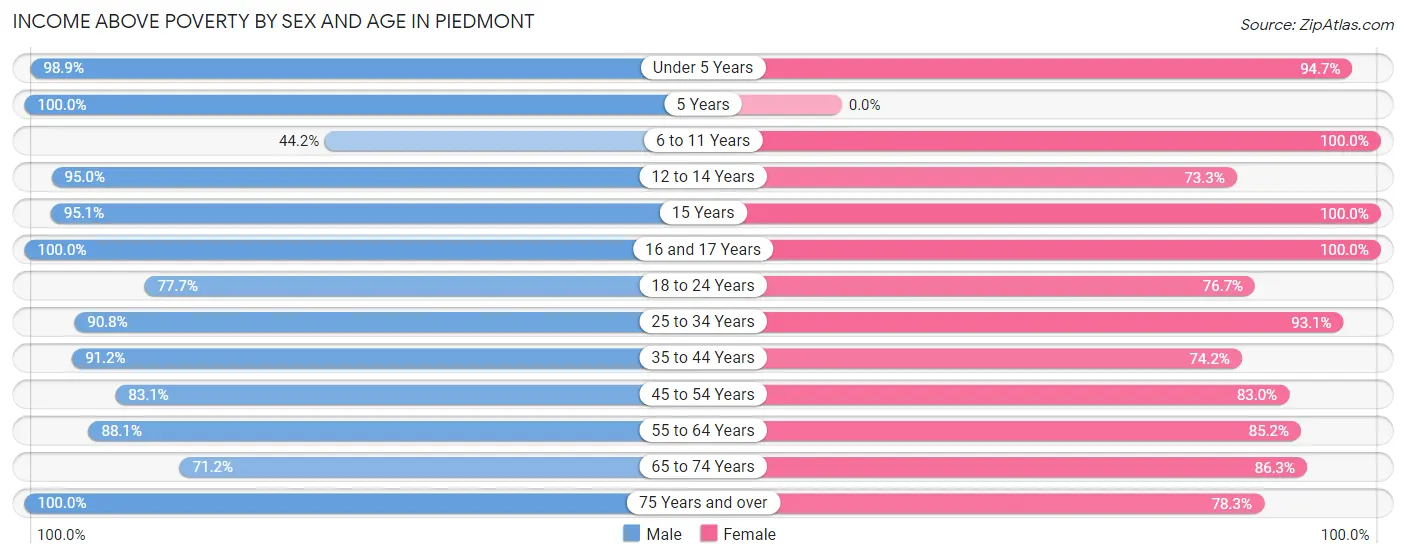
| Age Bracket | Male | Female |
| Under 5 Years | 90 (98.9%) | 198 (94.7%) |
| 5 Years | 37 (100.0%) | 0 (0.0%) |
| 6 to 11 Years | 23 (44.2%) | 214 (100.0%) |
| 12 to 14 Years | 76 (95.0%) | 115 (73.3%) |
| 15 Years | 39 (95.1%) | 29 (100.0%) |
| 16 and 17 Years | 38 (100.0%) | 45 (100.0%) |
| 18 to 24 Years | 241 (77.7%) | 207 (76.7%) |
| 25 to 34 Years | 177 (90.8%) | 364 (93.1%) |
| 35 to 44 Years | 196 (91.2%) | 236 (74.2%) |
| 45 to 54 Years | 281 (83.1%) | 366 (83.0%) |
| 55 to 64 Years | 393 (88.1%) | 213 (85.2%) |
| 65 to 74 Years | 94 (71.2%) | 101 (86.3%) |
| 75 Years and over | 45 (100.0%) | 195 (78.3%) |
| Total | 1,730 (85.6%) | 2,283 (84.8%) |
Income Below Poverty Among Married-Couple Families in Piedmont
The poverty statistics for married-couple families in Piedmont show that 2.0% or 13 of the total 640 families live below the poverty line. Families with no children have the highest poverty rate of 3.4%, comprising of 13 families. On the other hand, families with 1 or 2 children have the lowest poverty rate of 0.0%, which includes 0 families.
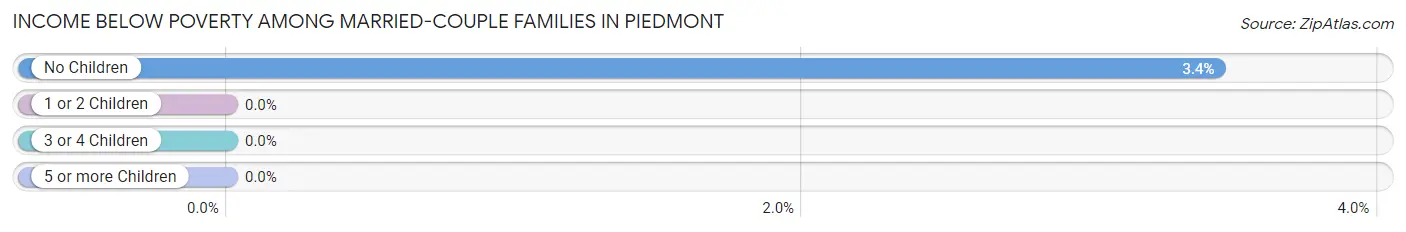
| Children | Above Poverty | Below Poverty |
| No Children | 365 (96.6%) | 13 (3.4%) |
| 1 or 2 Children | 194 (100.0%) | 0 (0.0%) |
| 3 or 4 Children | 65 (100.0%) | 0 (0.0%) |
| 5 or more Children | 3 (100.0%) | 0 (0.0%) |
| Total | 627 (98.0%) | 13 (2.0%) |
Income Below Poverty Among Single-Parent Households in Piedmont
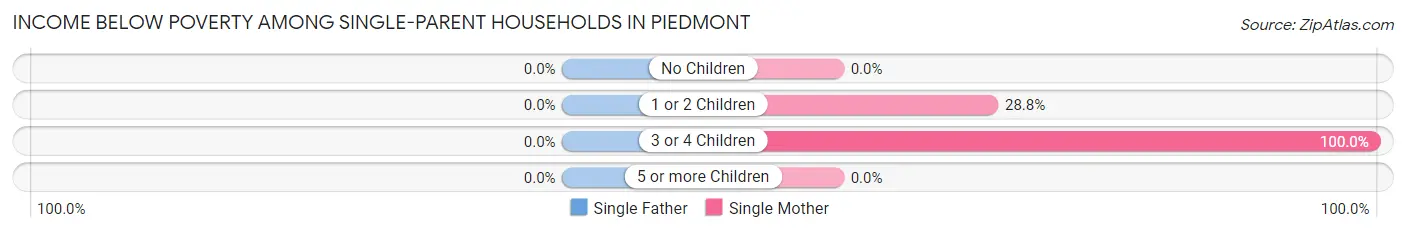
| Children | Single Father | Single Mother |
| No Children | 0 (0.0%) | 0 (0.0%) |
| 1 or 2 Children | 0 (0.0%) | 46 (28.7%) |
| 3 or 4 Children | 0 (0.0%) | 7 (100.0%) |
| 5 or more Children | 0 (0.0%) | 0 (0.0%) |
| Total | 0 (0.0%) | 53 (18.9%) |
Income Below Poverty Among Married-Couple vs Single-Parent Households in Piedmont
The poverty data for Piedmont shows that 13 of the married-couple family households (2.0%) and 53 of the single-parent households (12.4%) are living below the poverty level. Within the married-couple family households, those with no children have the highest poverty rate, with 13 households (3.4%) falling below the poverty line. Among the single-parent households, those with 3 or 4 children have the highest poverty rate, with 7 household (26.9%) living below poverty.
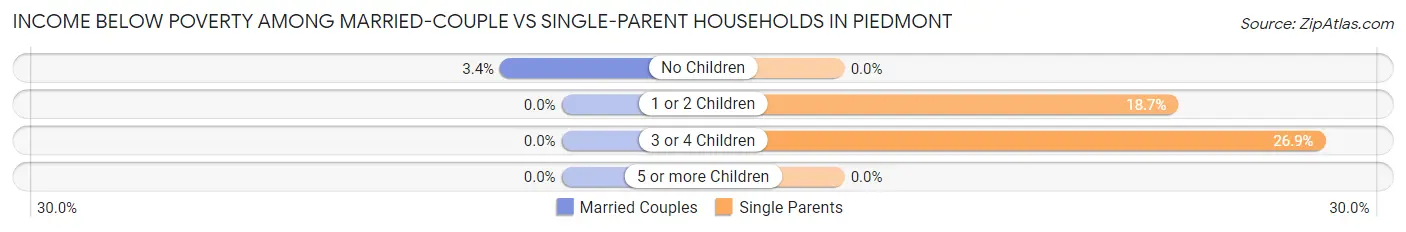
| Children | Married-Couple Families | Single-Parent Households |
| No Children | 13 (3.4%) | 0 (0.0%) |
| 1 or 2 Children | 0 (0.0%) | 46 (18.7%) |
| 3 or 4 Children | 0 (0.0%) | 7 (26.9%) |
| 5 or more Children | 0 (0.0%) | 0 (0.0%) |
| Total | 13 (2.0%) | 53 (12.4%) |
Race in Piedmont
The most populous races in Piedmont are White / Caucasian (4,220 | 88.6%), Black / African American (434 | 9.1%), and Hispanic or Latino (269 | 5.7%).
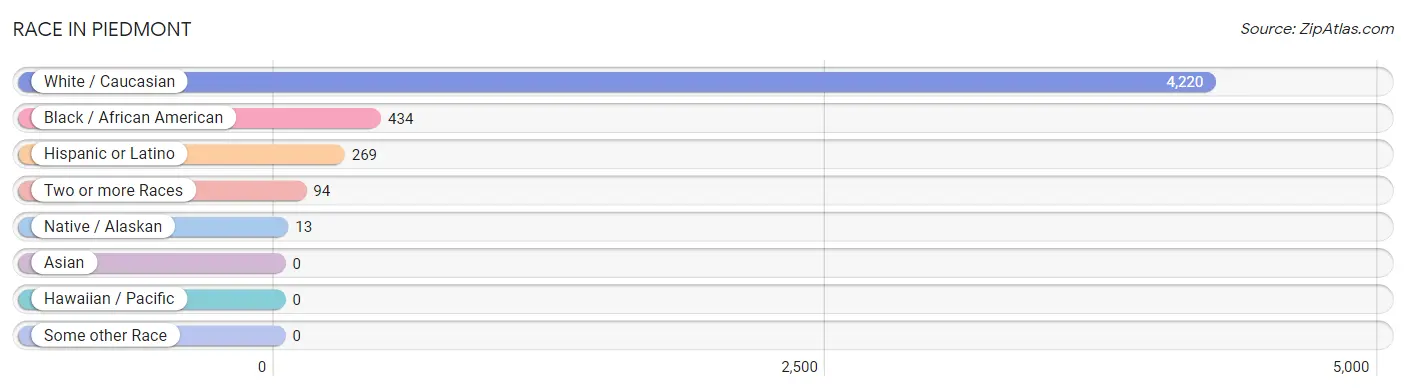
| Race | # Population | % Population |
| Asian | 0 | 0.0% |
| Black / African American | 434 | 9.1% |
| Hawaiian / Pacific | 0 | 0.0% |
| Hispanic or Latino | 269 | 5.7% |
| Native / Alaskan | 13 | 0.3% |
| White / Caucasian | 4,220 | 88.6% |
| Two or more Races | 94 | 2.0% |
| Some other Race | 0 | 0.0% |
| Total | 4,761 | 100.0% |
Ancestry in Piedmont
The most populous ancestries reported in Piedmont are American (829 | 17.4%), Irish (720 | 15.1%), English (562 | 11.8%), German (526 | 11.1%), and Puerto Rican (148 | 3.1%), together accounting for 58.5% of all Piedmont residents.
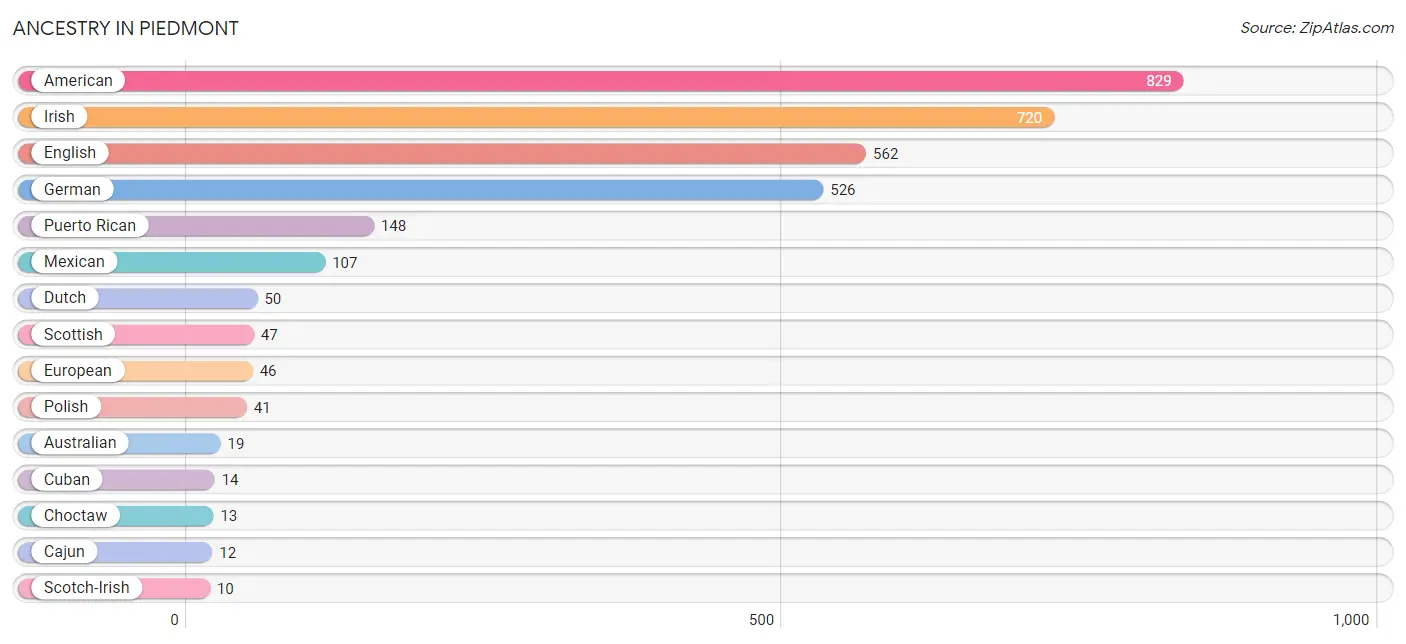
| Ancestry | # Population | % Population |
| American | 829 | 17.4% |
| Australian | 19 | 0.4% |
| Cajun | 12 | 0.3% |
| Cherokee | 4 | 0.1% |
| Choctaw | 13 | 0.3% |
| Cuban | 14 | 0.3% |
| Dutch | 50 | 1.1% |
| English | 562 | 11.8% |
| European | 46 | 1.0% |
| German | 526 | 11.1% |
| Irish | 720 | 15.1% |
| Italian | 4 | 0.1% |
| Mexican | 107 | 2.2% |
| Polish | 41 | 0.9% |
| Puerto Rican | 148 | 3.1% |
| Scotch-Irish | 10 | 0.2% |
| Scottish | 47 | 1.0% |
| Welsh | 8 | 0.2% | View All 18 Rows |
Immigrants in Piedmont
The most numerous immigrant groups reported in Piedmont came from Central America (21 | 0.4%), Latin America (21 | 0.4%), Mexico (21 | 0.4%), Europe (4 | 0.1%), and Italy (4 | 0.1%), together accounting for 1.5% of all Piedmont residents.
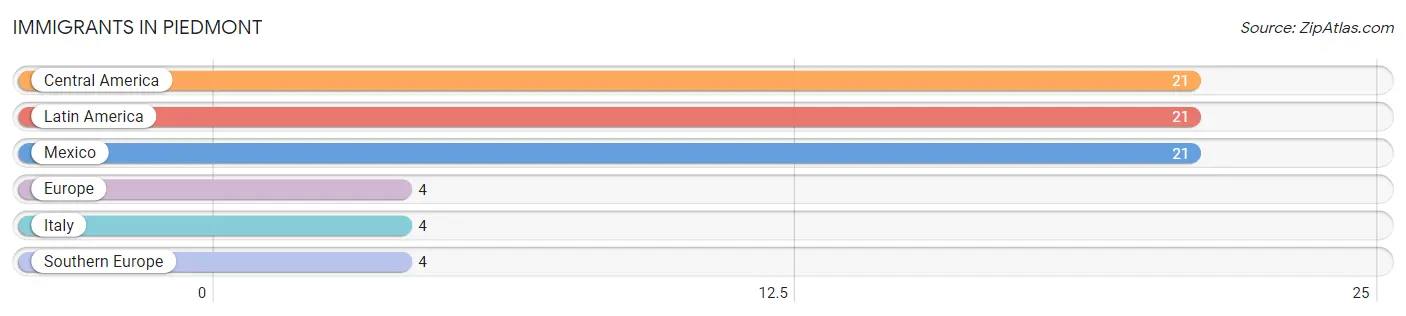
| Immigration Origin | # Population | % Population |
| Central America | 21 | 0.4% |
| Europe | 4 | 0.1% |
| Italy | 4 | 0.1% |
| Latin America | 21 | 0.4% |
| Mexico | 21 | 0.4% |
| Southern Europe | 4 | 0.1% | View All 6 Rows |
Sex and Age in Piedmont
Sex and Age in Piedmont
The most populous age groups in Piedmont are 60 to 64 Years (264 | 13.0%) for men and 45 to 49 Years (338 | 12.3%) for women.
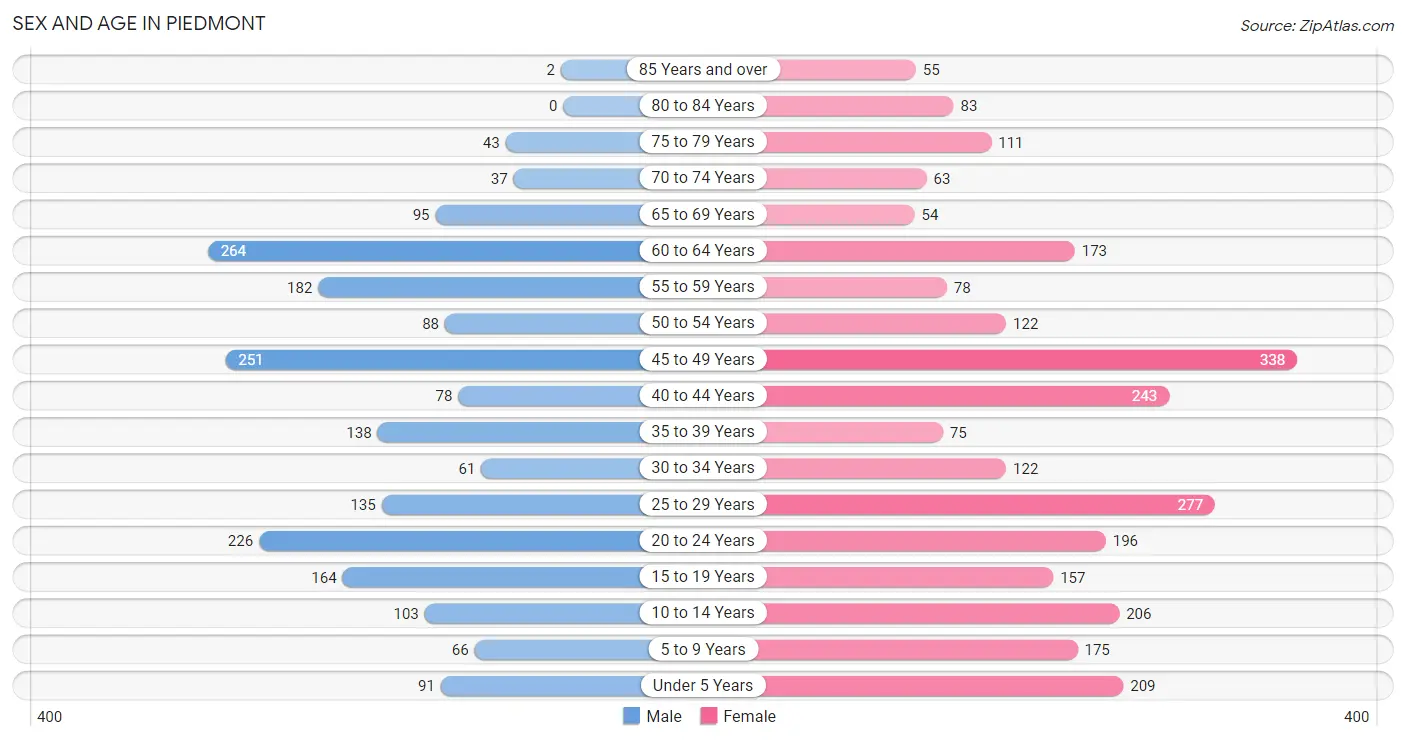
| Age Bracket | Male | Female |
| Under 5 Years | 91 (4.5%) | 209 (7.6%) |
| 5 to 9 Years | 66 (3.3%) | 175 (6.4%) |
| 10 to 14 Years | 103 (5.1%) | 206 (7.5%) |
| 15 to 19 Years | 164 (8.1%) | 157 (5.7%) |
| 20 to 24 Years | 226 (11.2%) | 196 (7.2%) |
| 25 to 29 Years | 135 (6.7%) | 277 (10.1%) |
| 30 to 34 Years | 61 (3.0%) | 122 (4.5%) |
| 35 to 39 Years | 138 (6.8%) | 75 (2.7%) |
| 40 to 44 Years | 78 (3.8%) | 243 (8.9%) |
| 45 to 49 Years | 251 (12.4%) | 338 (12.3%) |
| 50 to 54 Years | 88 (4.3%) | 122 (4.5%) |
| 55 to 59 Years | 182 (9.0%) | 78 (2.9%) |
| 60 to 64 Years | 264 (13.0%) | 173 (6.3%) |
| 65 to 69 Years | 95 (4.7%) | 54 (2.0%) |
| 70 to 74 Years | 37 (1.8%) | 63 (2.3%) |
| 75 to 79 Years | 43 (2.1%) | 111 (4.1%) |
| 80 to 84 Years | 0 (0.0%) | 83 (3.0%) |
| 85 Years and over | 2 (0.1%) | 55 (2.0%) |
| Total | 2,024 (100.0%) | 2,737 (100.0%) |
Families and Households in Piedmont
Median Family Size in Piedmont
The median family size in Piedmont is 3.36 persons per family, with single female/mother families (280 | 26.2%) accounting for the largest median family size of 4.19 persons per family. On the other hand, single male/father families (147 | 13.8%) represent the smallest median family size with 2.67 persons per family.
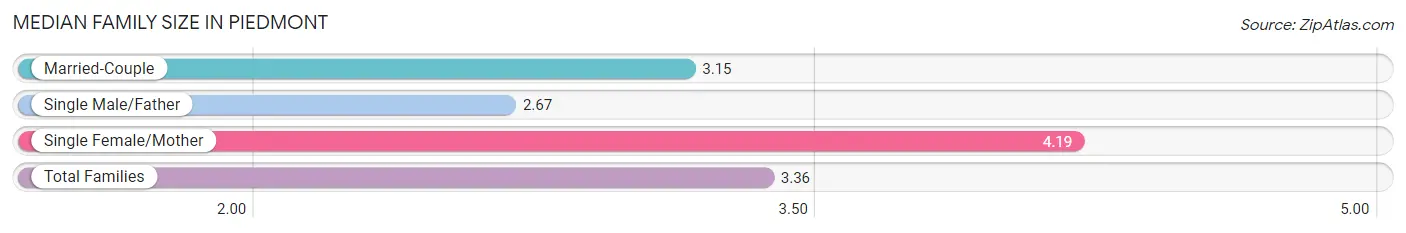
| Family Type | # Families | Family Size |
| Married-Couple | 640 (60.0%) | 3.15 |
| Single Male/Father | 147 (13.8%) | 2.67 |
| Single Female/Mother | 280 (26.2%) | 4.19 |
| Total Families | 1,067 (100.0%) | 3.36 |
Median Household Size in Piedmont
The median household size in Piedmont is 2.73 persons per household, with single female/mother households (280 | 16.2%) accounting for the largest median household size of 4.55 persons per household. non-family households (661 | 38.3%) represent the smallest median household size with 1.35 persons per household.
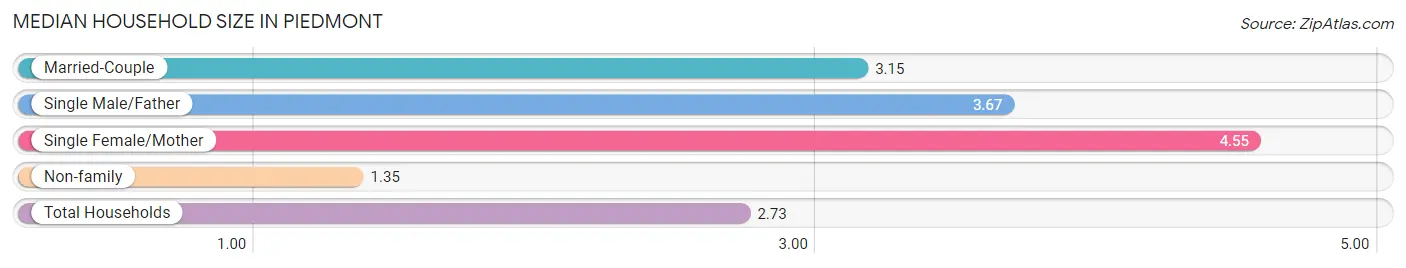
| Household Type | # Households | Household Size |
| Married-Couple | 640 (37.0%) | 3.15 |
| Single Male/Father | 147 (8.5%) | 3.67 |
| Single Female/Mother | 280 (16.2%) | 4.55 |
| Non-family | 661 (38.3%) | 1.35 |
| Total Households | 1,728 (100.0%) | 2.73 |
Household Size by Marriage Status in Piedmont
Out of a total of 1,728 households in Piedmont, 1,067 (61.8%) are family households, while 661 (38.3%) are nonfamily households. The most numerous type of family households are 3-person households, comprising 421, and the most common type of nonfamily households are 1-person households, comprising 521.
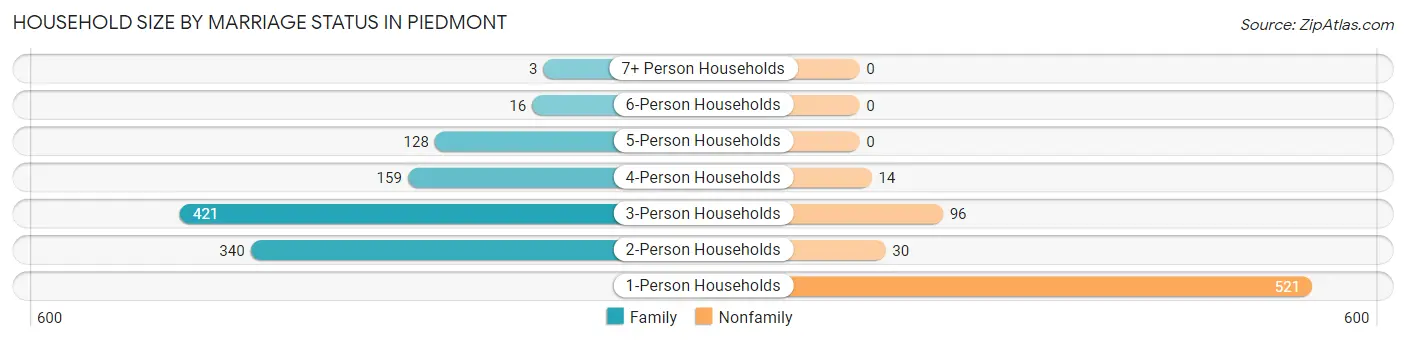
| Household Size | Family Households | Nonfamily Households |
| 1-Person Households | - | 521 (30.1%) |
| 2-Person Households | 340 (19.7%) | 30 (1.7%) |
| 3-Person Households | 421 (24.4%) | 96 (5.6%) |
| 4-Person Households | 159 (9.2%) | 14 (0.8%) |
| 5-Person Households | 128 (7.4%) | 0 (0.0%) |
| 6-Person Households | 16 (0.9%) | 0 (0.0%) |
| 7+ Person Households | 3 (0.2%) | 0 (0.0%) |
| Total | 1,067 (61.8%) | 661 (38.3%) |
Female Fertility in Piedmont
Fertility by Age in Piedmont
Average fertility rate in Piedmont is 94.0 births per 1,000 women. Women in the age bracket of 20 to 34 years have the highest fertility rate with 113.0 births per 1,000 women. Women in the age bracket of 20 to 34 years acount for 50.4% of all women with births.
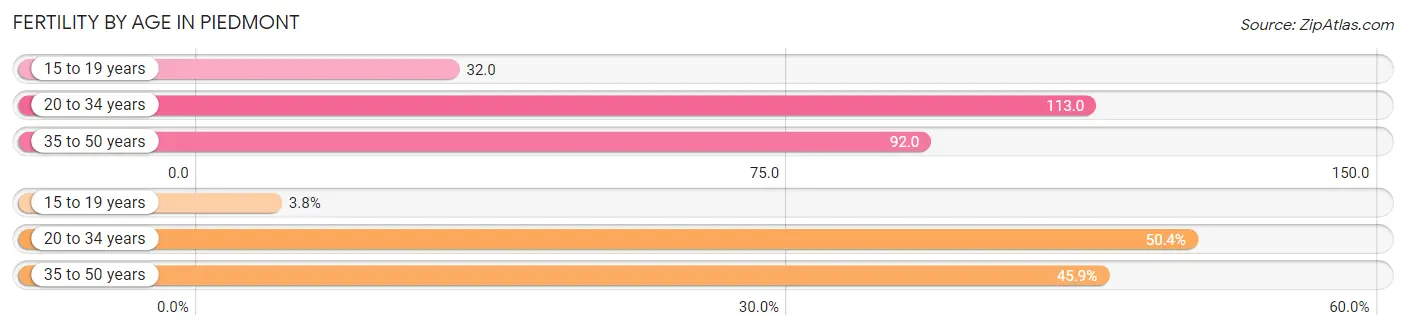
| Age Bracket | Women with Births | Births / 1,000 Women |
| 15 to 19 years | 5 (3.8%) | 32.0 |
| 20 to 34 years | 67 (50.4%) | 113.0 |
| 35 to 50 years | 61 (45.9%) | 92.0 |
| Total | 133 (100.0%) | 94.0 |
Fertility by Age by Marriage Status in Piedmont
45.9% of women with births (133) in Piedmont are married. The highest percentage of unmarried women with births falls into 15 to 19 years age bracket with 100.0% of them unmarried at the time of birth, while the lowest percentage of unmarried women with births belong to 35 to 50 years age bracket with 0.0% of them unmarried.
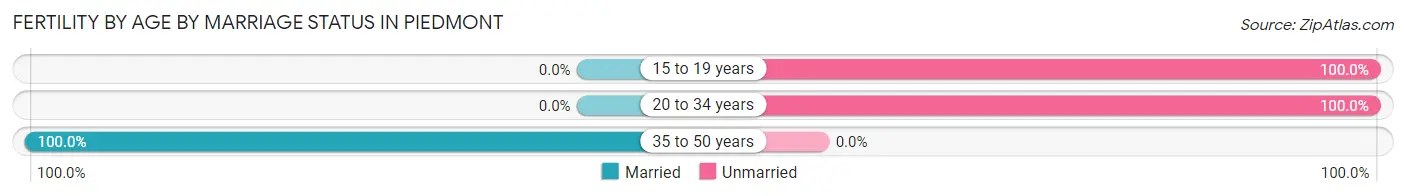
| Age Bracket | Married | Unmarried |
| 15 to 19 years | 0 (0.0%) | 5 (100.0%) |
| 20 to 34 years | 0 (0.0%) | 67 (100.0%) |
| 35 to 50 years | 61 (100.0%) | 0 (0.0%) |
| Total | 61 (45.9%) | 72 (54.1%) |
Fertility by Education in Piedmont
Average fertility rate in Piedmont is 94.0 births per 1,000 women. Women with the education attainment of graduate degree have the highest fertility rate of 600.0 births per 1,000 women, while women with the education attainment of high school diploma have the lowest fertility at 16.0 births per 1,000 women. Women with the education attainment of college or associate's degree represent 37.6% of all women with births.
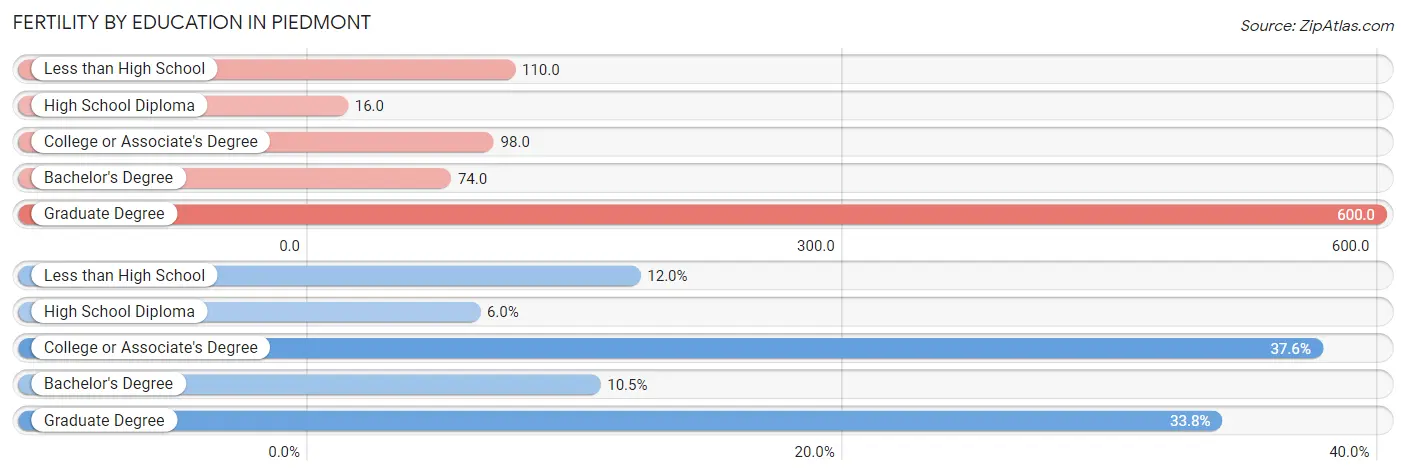
| Educational Attainment | Women with Births | Births / 1,000 Women |
| Less than High School | 16 (12.0%) | 110.0 |
| High School Diploma | 8 (6.0%) | 16.0 |
| College or Associate's Degree | 50 (37.6%) | 98.0 |
| Bachelor's Degree | 14 (10.5%) | 74.0 |
| Graduate Degree | 45 (33.8%) | 600.0 |
| Total | 133 (100.0%) | 94.0 |
Fertility by Education by Marriage Status in Piedmont
54.1% of women with births in Piedmont are unmarried. Women with the educational attainment of less than high school are most likely to be married with 100.0% of them married at childbirth, while women with the educational attainment of high school diploma are least likely to be married with 100.0% of them unmarried at childbirth.
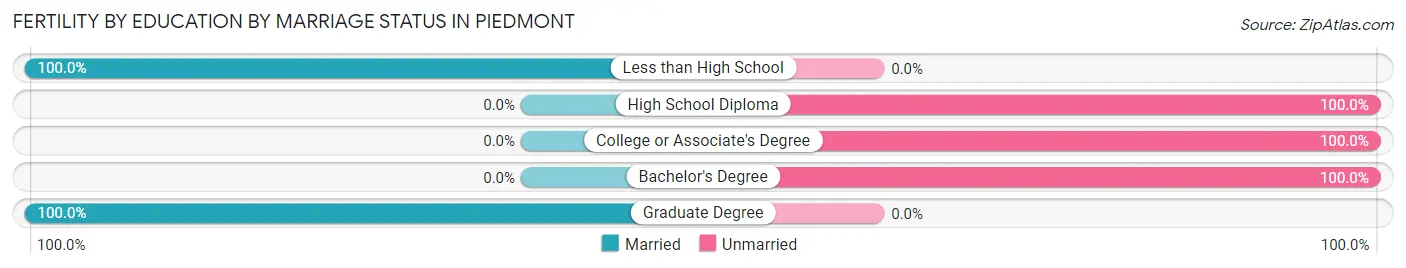
| Educational Attainment | Married | Unmarried |
| Less than High School | 16 (100.0%) | 0 (0.0%) |
| High School Diploma | 0 (0.0%) | 8 (100.0%) |
| College or Associate's Degree | 0 (0.0%) | 50 (100.0%) |
| Bachelor's Degree | 0 (0.0%) | 14 (100.0%) |
| Graduate Degree | 45 (100.0%) | 0 (0.0%) |
| Total | 61 (45.9%) | 72 (54.1%) |
Employment Characteristics in Piedmont
Employment by Class of Employer in Piedmont
Among the 2,181 employed individuals in Piedmont, private company employees (1,658 | 76.0%), local government employees (180 | 8.3%), and federal government employees (90 | 4.1%) make up the most common classes of employment.
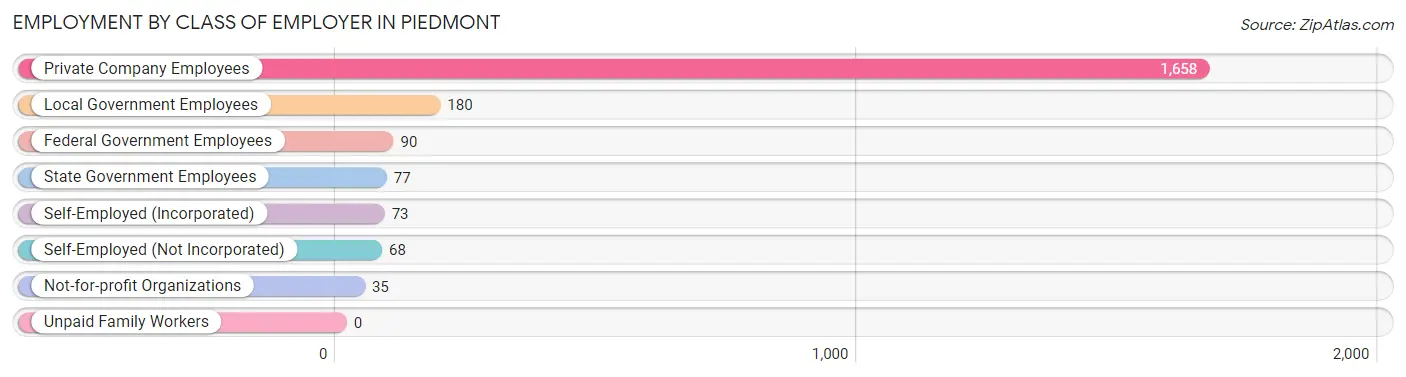
| Employer Class | # Employees | % Employees |
| Private Company Employees | 1,658 | 76.0% |
| Self-Employed (Incorporated) | 73 | 3.4% |
| Self-Employed (Not Incorporated) | 68 | 3.1% |
| Not-for-profit Organizations | 35 | 1.6% |
| Local Government Employees | 180 | 8.3% |
| State Government Employees | 77 | 3.5% |
| Federal Government Employees | 90 | 4.1% |
| Unpaid Family Workers | 0 | 0.0% |
| Total | 2,181 | 100.0% |
Employment Status by Age in Piedmont
According to the labor force statistics for Piedmont, out of the total population over 16 years of age (3,841), 59.8% or 2,297 individuals are in the labor force, with 4.4% or 101 of them unemployed. The age group with the highest labor force participation rate is 25 to 29 years, with 83.3% or 343 individuals in the labor force. Within the labor force, the 16 to 19 years age range has the highest percentage of unemployed individuals, with 34.0% or 48 of them being unemployed.
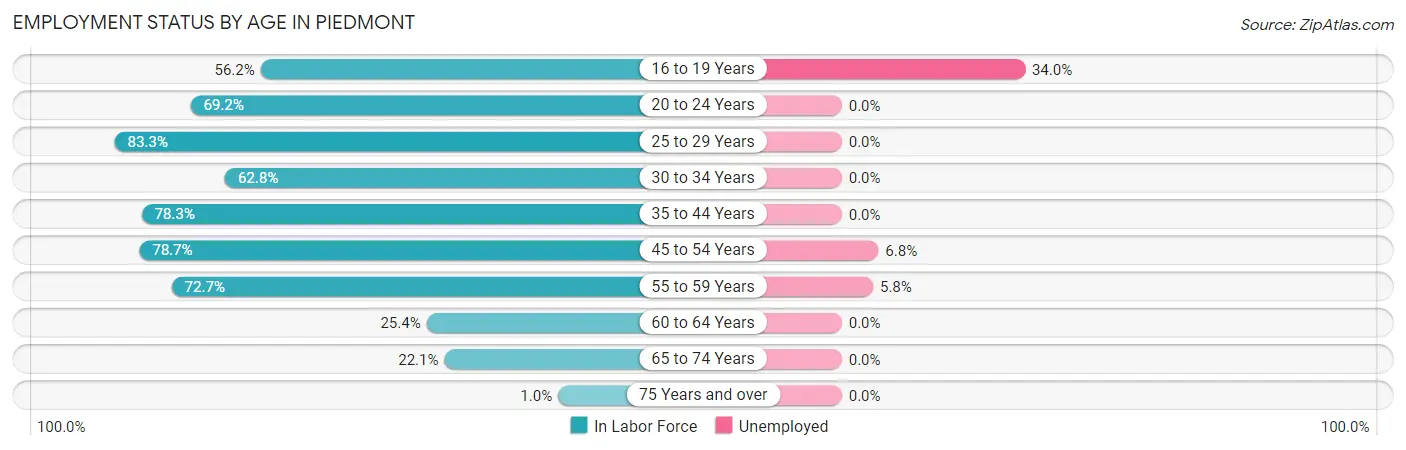
| Age Bracket | In Labor Force | Unemployed |
| 16 to 19 Years | 141 (56.2%) | 48 (34.0%) |
| 20 to 24 Years | 292 (69.2%) | 0 (0.0%) |
| 25 to 29 Years | 343 (83.3%) | 0 (0.0%) |
| 30 to 34 Years | 115 (62.8%) | 0 (0.0%) |
| 35 to 44 Years | 418 (78.3%) | 0 (0.0%) |
| 45 to 54 Years | 629 (78.7%) | 43 (6.8%) |
| 55 to 59 Years | 189 (72.7%) | 11 (5.8%) |
| 60 to 64 Years | 111 (25.4%) | 0 (0.0%) |
| 65 to 74 Years | 55 (22.1%) | 0 (0.0%) |
| 75 Years and over | 3 (1.0%) | 0 (0.0%) |
| Total | 2,297 (59.8%) | 101 (4.4%) |
Employment Status by Educational Attainment in Piedmont
According to labor force statistics for Piedmont, 68.8% of individuals (1,806) out of the total population between 25 and 64 years of age (2,625) are in the labor force, with 3.0% or 54 of them being unemployed. The group with the highest labor force participation rate are those with the educational attainment of bachelor's degree or higher, with 79.2% or 320 individuals in the labor force. Within the labor force, individuals with high school diploma education have the highest percentage of unemployment, with 5.7% or 43 of them being unemployed.
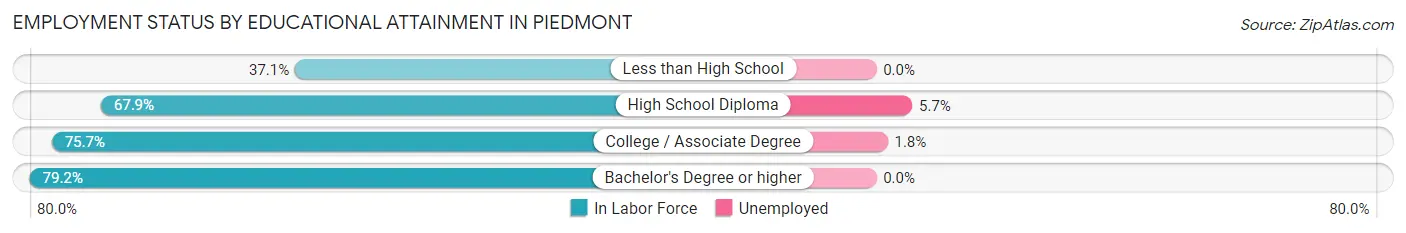
| Educational Attainment | In Labor Force | Unemployed |
| Less than High School | 105 (37.1%) | 0 (0.0%) |
| High School Diploma | 755 (67.9%) | 63 (5.7%) |
| College / Associate Degree | 625 (75.7%) | 15 (1.8%) |
| Bachelor's Degree or higher | 320 (79.2%) | 0 (0.0%) |
| Total | 1,806 (68.8%) | 79 (3.0%) |
Employment Occupations by Sex in Piedmont
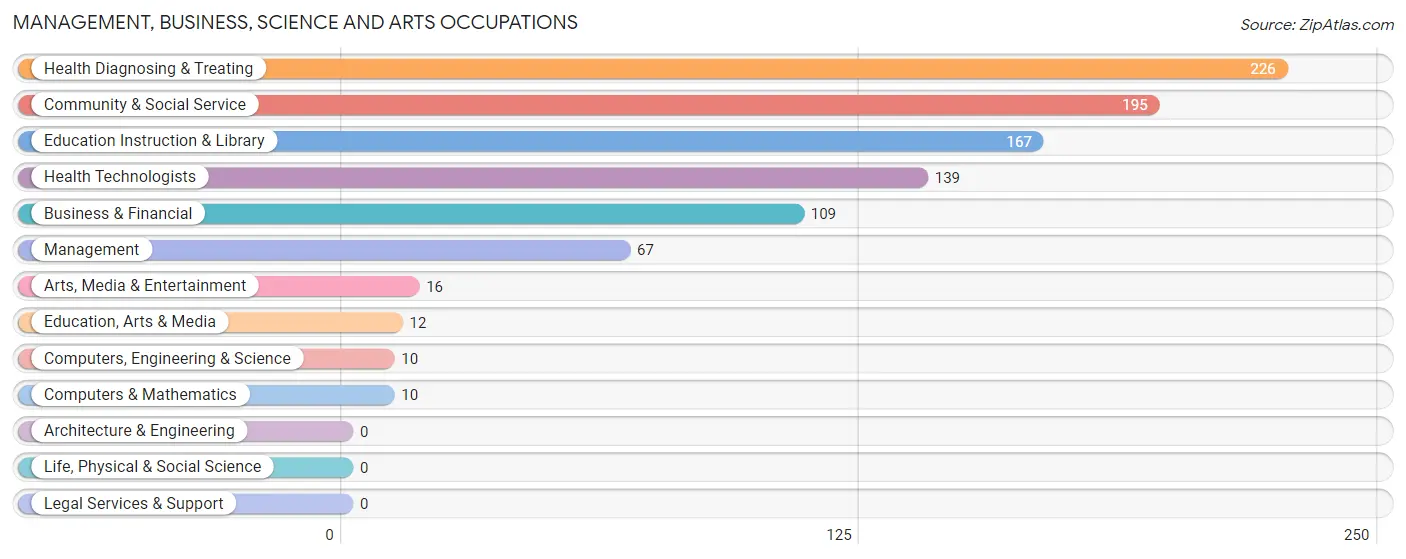
Management, Business, Science and Arts Occupations
The most common Management, Business, Science and Arts occupations in Piedmont are Health Diagnosing & Treating (226 | 10.3%), Community & Social Service (195 | 8.9%), Education Instruction & Library (167 | 7.6%), Health Technologists (139 | 6.3%), and Business & Financial (109 | 5.0%).
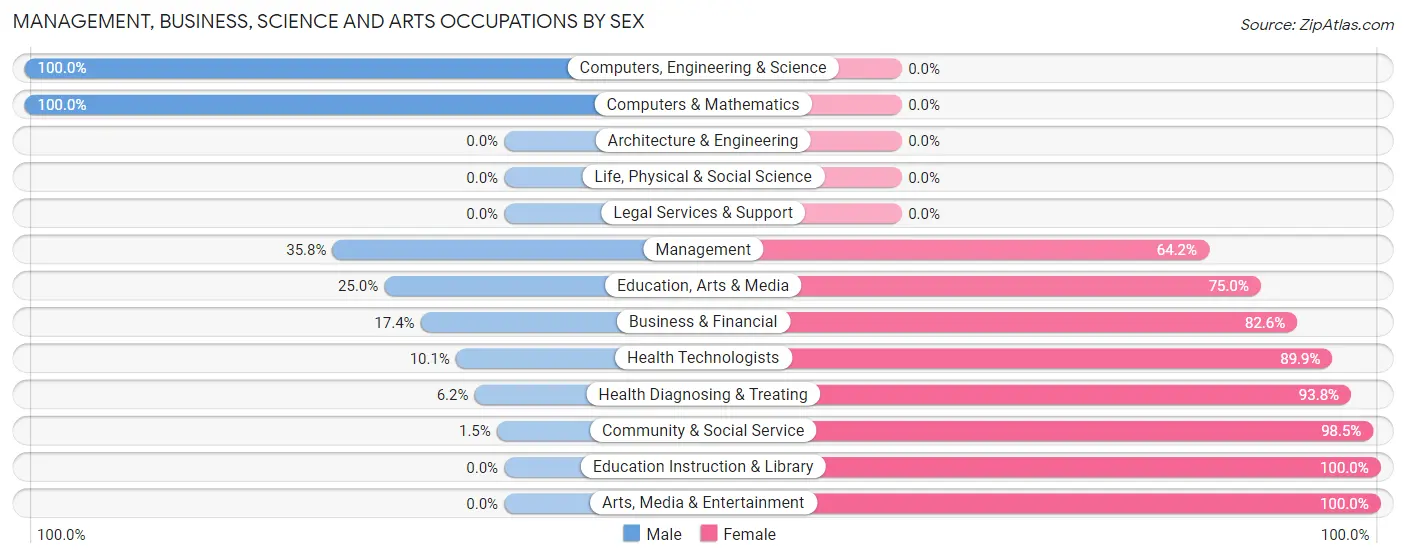
Management, Business, Science and Arts Occupations by Sex
Within the Management, Business, Science and Arts occupations in Piedmont, the most male-oriented occupations are Computers, Engineering & Science (100.0%), Computers & Mathematics (100.0%), and Management (35.8%), while the most female-oriented occupations are Education Instruction & Library (100.0%), Arts, Media & Entertainment (100.0%), and Community & Social Service (98.5%).
| Occupation | Male | Female |
| Management | 24 (35.8%) | 43 (64.2%) |
| Business & Financial | 19 (17.4%) | 90 (82.6%) |
| Computers, Engineering & Science | 10 (100.0%) | 0 (0.0%) |
| Computers & Mathematics | 10 (100.0%) | 0 (0.0%) |
| Architecture & Engineering | 0 (0.0%) | 0 (0.0%) |
| Life, Physical & Social Science | 0 (0.0%) | 0 (0.0%) |
| Community & Social Service | 3 (1.5%) | 192 (98.5%) |
| Education, Arts & Media | 3 (25.0%) | 9 (75.0%) |
| Legal Services & Support | 0 (0.0%) | 0 (0.0%) |
| Education Instruction & Library | 0 (0.0%) | 167 (100.0%) |
| Arts, Media & Entertainment | 0 (0.0%) | 16 (100.0%) |
| Health Diagnosing & Treating | 14 (6.2%) | 212 (93.8%) |
| Health Technologists | 14 (10.1%) | 125 (89.9%) |
| Total (Category) | 70 (11.5%) | 537 (88.5%) |
| Total (Overall) | 1,094 (49.9%) | 1,100 (50.1%) |
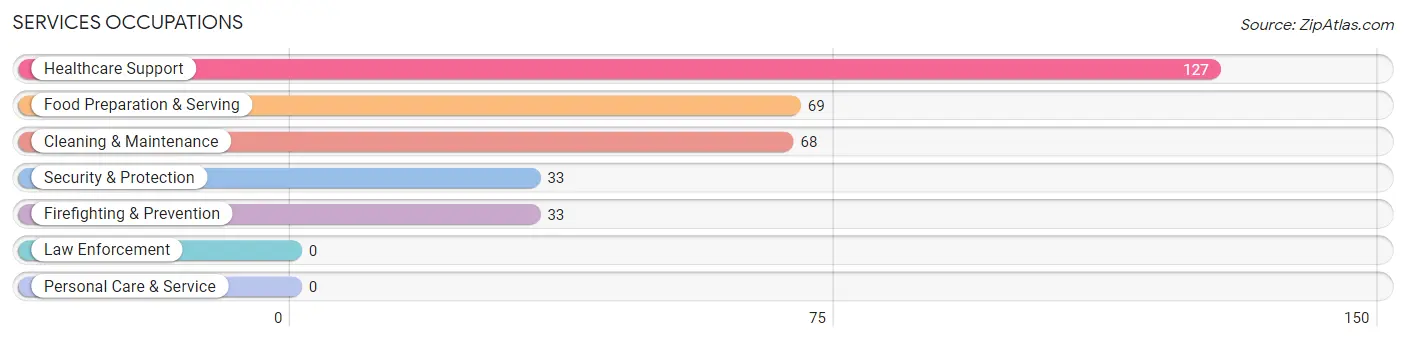
Services Occupations
The most common Services occupations in Piedmont are Healthcare Support (127 | 5.8%), Food Preparation & Serving (69 | 3.1%), Cleaning & Maintenance (68 | 3.1%), Security & Protection (33 | 1.5%), and Firefighting & Prevention (33 | 1.5%).
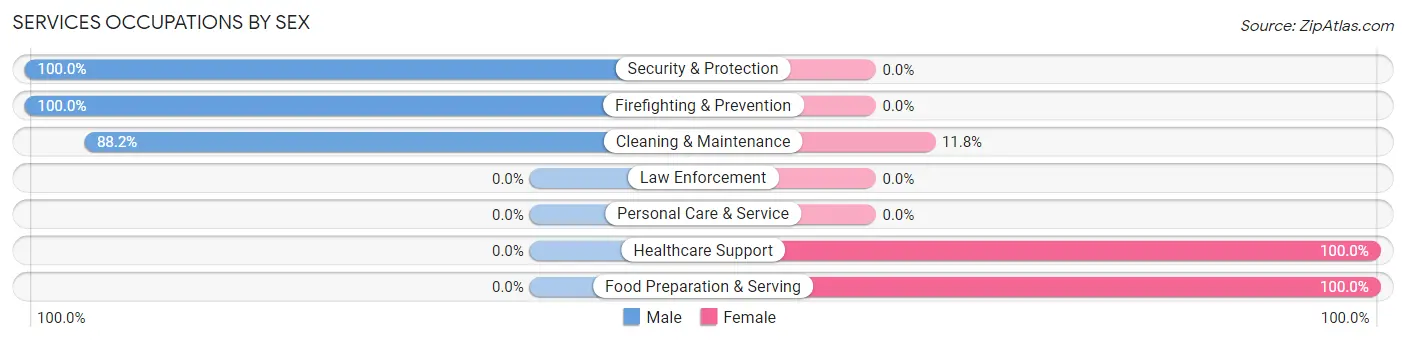
Services Occupations by Sex
Within the Services occupations in Piedmont, the most male-oriented occupations are Security & Protection (100.0%), Firefighting & Prevention (100.0%), and Cleaning & Maintenance (88.2%), while the most female-oriented occupations are Healthcare Support (100.0%), Food Preparation & Serving (100.0%), and Cleaning & Maintenance (11.8%).
| Occupation | Male | Female |
| Healthcare Support | 0 (0.0%) | 127 (100.0%) |
| Security & Protection | 33 (100.0%) | 0 (0.0%) |
| Firefighting & Prevention | 33 (100.0%) | 0 (0.0%) |
| Law Enforcement | 0 (0.0%) | 0 (0.0%) |
| Food Preparation & Serving | 0 (0.0%) | 69 (100.0%) |
| Cleaning & Maintenance | 60 (88.2%) | 8 (11.8%) |
| Personal Care & Service | 0 (0.0%) | 0 (0.0%) |
| Total (Category) | 93 (31.3%) | 204 (68.7%) |
| Total (Overall) | 1,094 (49.9%) | 1,100 (50.1%) |
Sales and Office Occupations
The most common Sales and Office occupations in Piedmont are Sales & Related (311 | 14.2%), and Office & Administration (172 | 7.8%).
Sales and Office Occupations by Sex

| Occupation | Male | Female |
| Sales & Related | 126 (40.5%) | 185 (59.5%) |
| Office & Administration | 26 (15.1%) | 146 (84.9%) |
| Total (Category) | 152 (31.5%) | 331 (68.5%) |
| Total (Overall) | 1,094 (49.9%) | 1,100 (50.1%) |
Natural Resources, Construction and Maintenance Occupations
The most common Natural Resources, Construction and Maintenance occupations in Piedmont are Installation, Maintenance & Repair (175 | 8.0%), and Construction & Extraction (146 | 6.7%).
Natural Resources, Construction and Maintenance Occupations by Sex
| Occupation | Male | Female |
| Farming, Fishing & Forestry | 0 (0.0%) | 0 (0.0%) |
| Construction & Extraction | 146 (100.0%) | 0 (0.0%) |
| Installation, Maintenance & Repair | 175 (100.0%) | 0 (0.0%) |
| Total (Category) | 321 (100.0%) | 0 (0.0%) |
| Total (Overall) | 1,094 (49.9%) | 1,100 (50.1%) |
Production, Transportation and Moving Occupations
The most common Production, Transportation and Moving occupations in Piedmont are Production (285 | 13.0%), Material Moving (125 | 5.7%), and Transportation (76 | 3.5%).
Production, Transportation and Moving Occupations by Sex
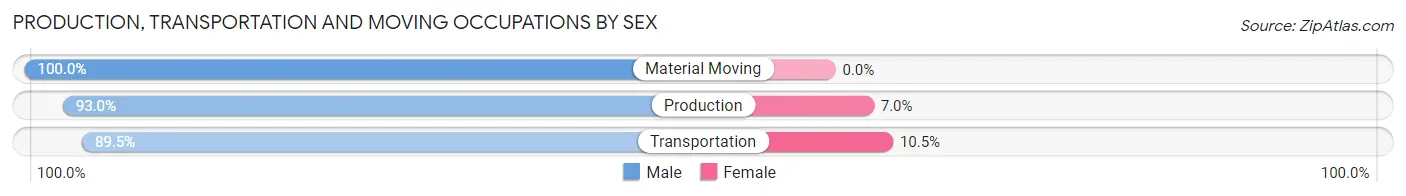
| Occupation | Male | Female |
| Production | 265 (93.0%) | 20 (7.0%) |
| Transportation | 68 (89.5%) | 8 (10.5%) |
| Material Moving | 125 (100.0%) | 0 (0.0%) |
| Total (Category) | 458 (94.2%) | 28 (5.8%) |
| Total (Overall) | 1,094 (49.9%) | 1,100 (50.1%) |
Employment Industries by Sex in Piedmont
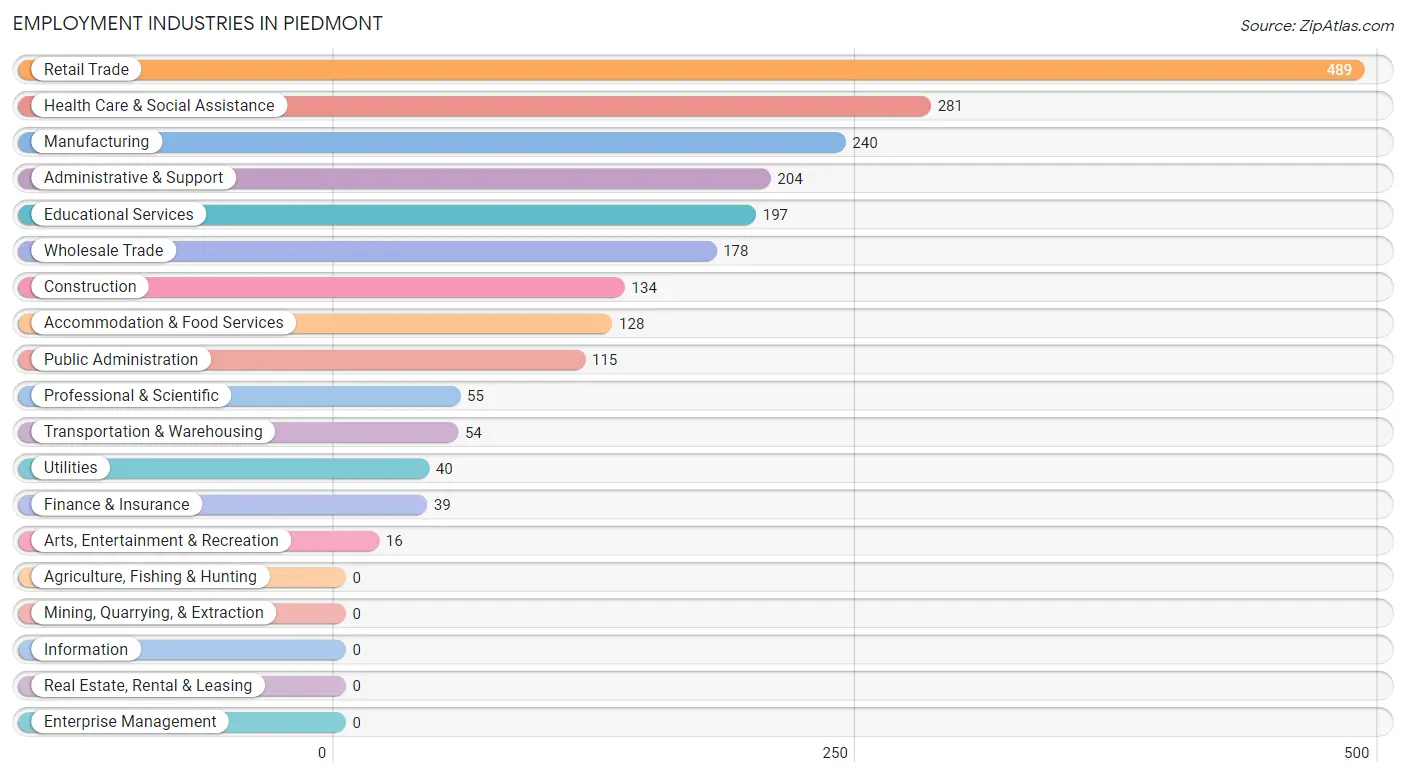
Employment Industries in Piedmont
The major employment industries in Piedmont include Retail Trade (489 | 22.3%), Health Care & Social Assistance (281 | 12.8%), Manufacturing (240 | 10.9%), Administrative & Support (204 | 9.3%), and Educational Services (197 | 9.0%).
Employment Industries by Sex in Piedmont
The Piedmont industries that see more men than women are Construction (100.0%), Wholesale Trade (100.0%), and Utilities (100.0%), whereas the industries that tend to have a higher number of women are Finance & Insurance (100.0%), Professional & Scientific (100.0%), and Arts, Entertainment & Recreation (100.0%).
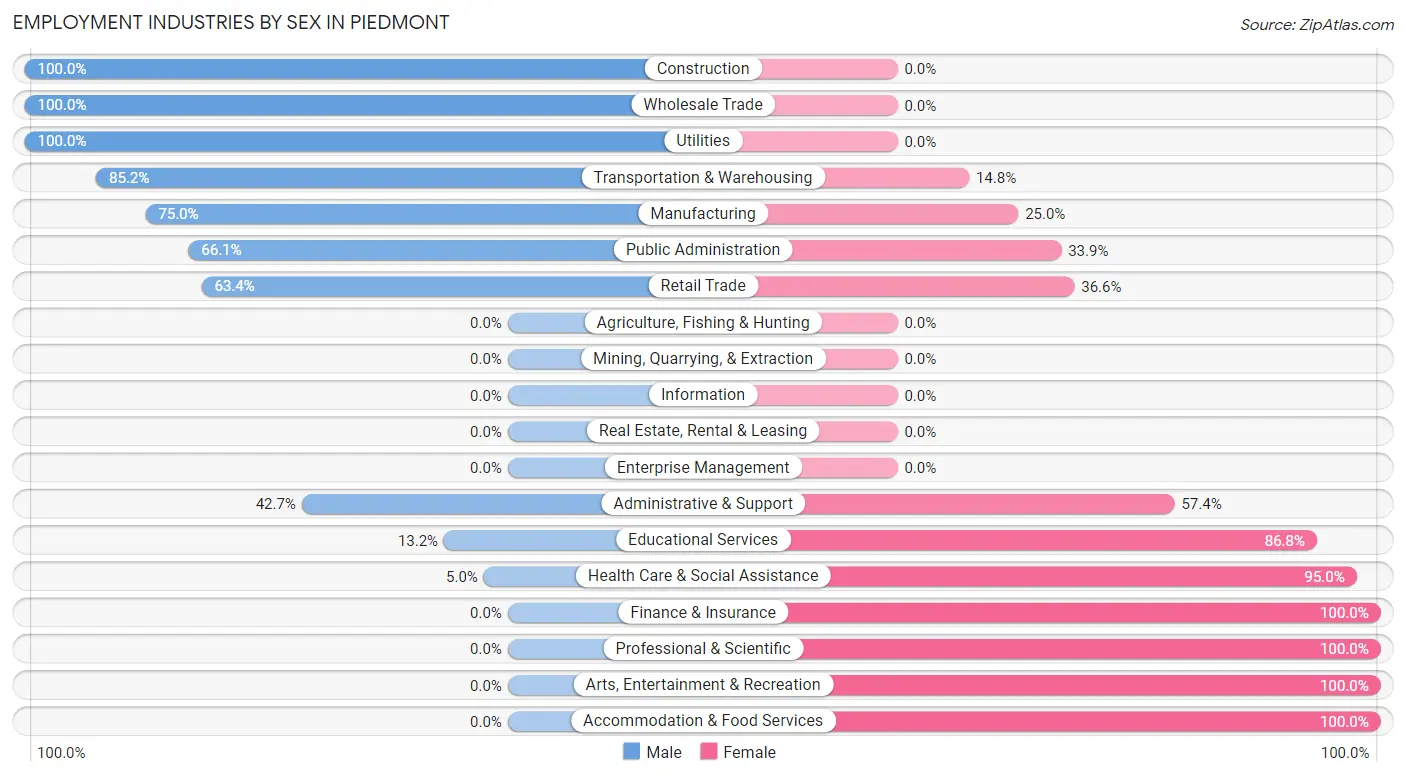
| Industry | Male | Female |
| Agriculture, Fishing & Hunting | 0 (0.0%) | 0 (0.0%) |
| Mining, Quarrying, & Extraction | 0 (0.0%) | 0 (0.0%) |
| Construction | 134 (100.0%) | 0 (0.0%) |
| Manufacturing | 180 (75.0%) | 60 (25.0%) |
| Wholesale Trade | 178 (100.0%) | 0 (0.0%) |
| Retail Trade | 310 (63.4%) | 179 (36.6%) |
| Transportation & Warehousing | 46 (85.2%) | 8 (14.8%) |
| Utilities | 40 (100.0%) | 0 (0.0%) |
| Information | 0 (0.0%) | 0 (0.0%) |
| Finance & Insurance | 0 (0.0%) | 39 (100.0%) |
| Real Estate, Rental & Leasing | 0 (0.0%) | 0 (0.0%) |
| Professional & Scientific | 0 (0.0%) | 55 (100.0%) |
| Enterprise Management | 0 (0.0%) | 0 (0.0%) |
| Administrative & Support | 87 (42.6%) | 117 (57.4%) |
| Educational Services | 26 (13.2%) | 171 (86.8%) |
| Health Care & Social Assistance | 14 (5.0%) | 267 (95.0%) |
| Arts, Entertainment & Recreation | 0 (0.0%) | 16 (100.0%) |
| Accommodation & Food Services | 0 (0.0%) | 128 (100.0%) |
| Public Administration | 76 (66.1%) | 39 (33.9%) |
| Total | 1,094 (49.9%) | 1,100 (50.1%) |
Education in Piedmont
School Enrollment in Piedmont
The most common levels of schooling among the 1,198 students in Piedmont are middle school (267 | 22.3%), high school (266 | 22.2%), and college / undergraduate (252 | 21.0%).
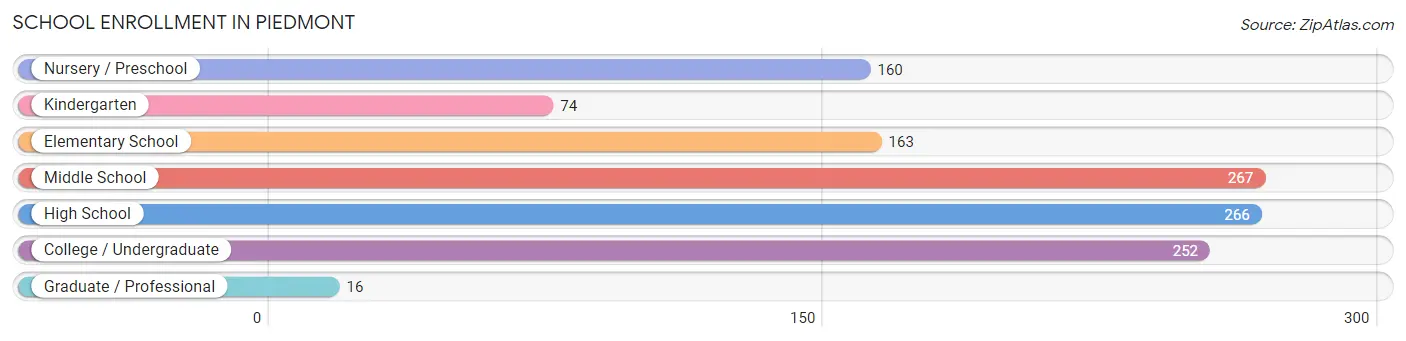
| School Level | # Students | % Students |
| Nursery / Preschool | 160 | 13.4% |
| Kindergarten | 74 | 6.2% |
| Elementary School | 163 | 13.6% |
| Middle School | 267 | 22.3% |
| High School | 266 | 22.2% |
| College / Undergraduate | 252 | 21.0% |
| Graduate / Professional | 16 | 1.3% |
| Total | 1,198 | 100.0% |
School Enrollment by Age by Funding Source in Piedmont
Out of a total of 1,198 students who are enrolled in schools in Piedmont, 10 (0.8%) attend a private institution, while the remaining 1,188 (99.2%) are enrolled in public schools. The age group of 10 to 14 year olds has the highest likelihood of being enrolled in private schools, with 9 (2.9% in the age bracket) enrolled. Conversely, the age group of 3 to 4 year olds has the lowest likelihood of being enrolled in a private school, with 168 (100.0% in the age bracket) attending a public institution.
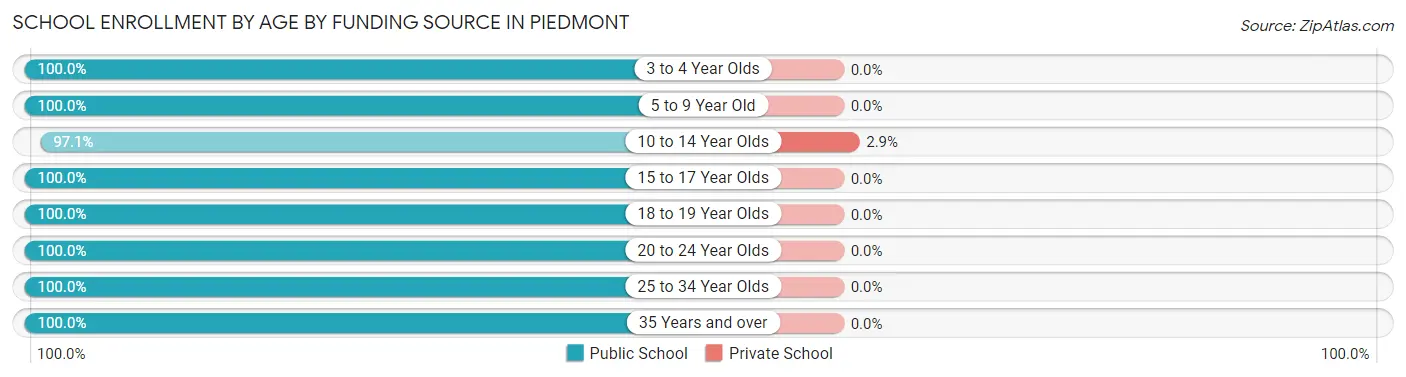
| Age Bracket | Public School | Private School |
| 3 to 4 Year Olds | 168 (100.0%) | 0 (0.0%) |
| 5 to 9 Year Old | 229 (100.0%) | 0 (0.0%) |
| 10 to 14 Year Olds | 300 (97.1%) | 9 (2.9%) |
| 15 to 17 Year Olds | 153 (100.0%) | 0 (0.0%) |
| 18 to 19 Year Olds | 79 (100.0%) | 0 (0.0%) |
| 20 to 24 Year Olds | 110 (100.0%) | 0 (0.0%) |
| 25 to 34 Year Olds | 80 (100.0%) | 0 (0.0%) |
| 35 Years and over | 70 (100.0%) | 0 (0.0%) |
| Total | 1,188 (99.2%) | 10 (0.8%) |
Educational Attainment by Field of Study in Piedmont
Business (171 | 34.4%), education (123 | 24.7%), science & technology (102 | 20.5%), bio, nature & agricultural (50 | 10.1%), and computers & mathematics (18 | 3.6%) are the most common fields of study among 497 individuals in Piedmont who have obtained a bachelor's degree or higher.
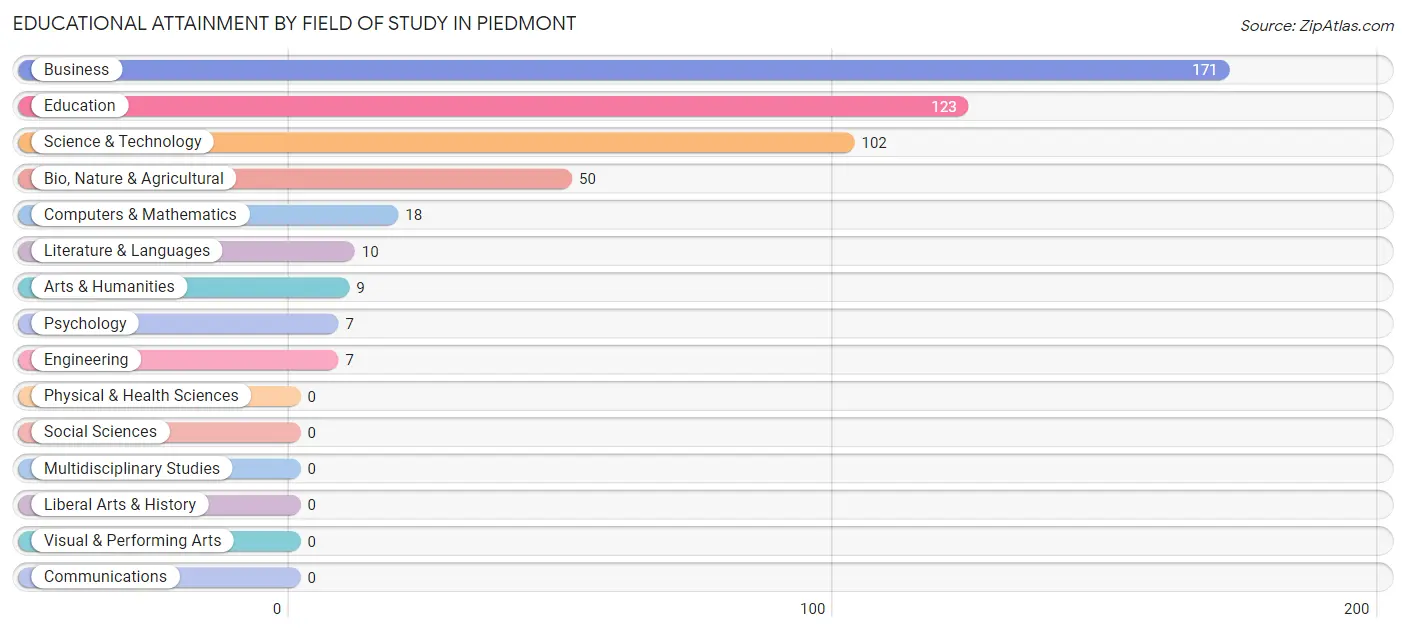
| Field of Study | # Graduates | % Graduates |
| Computers & Mathematics | 18 | 3.6% |
| Bio, Nature & Agricultural | 50 | 10.1% |
| Physical & Health Sciences | 0 | 0.0% |
| Psychology | 7 | 1.4% |
| Social Sciences | 0 | 0.0% |
| Engineering | 7 | 1.4% |
| Multidisciplinary Studies | 0 | 0.0% |
| Science & Technology | 102 | 20.5% |
| Business | 171 | 34.4% |
| Education | 123 | 24.7% |
| Literature & Languages | 10 | 2.0% |
| Liberal Arts & History | 0 | 0.0% |
| Visual & Performing Arts | 0 | 0.0% |
| Communications | 0 | 0.0% |
| Arts & Humanities | 9 | 1.8% |
| Total | 497 | 100.0% |
Transportation & Commute in Piedmont
Vehicle Availability by Sex in Piedmont
The most prevalent vehicle ownership categories in Piedmont are males with 2 vehicles (313, accounting for 28.9%) and females with 2 vehicles (318, making up 28.4%).
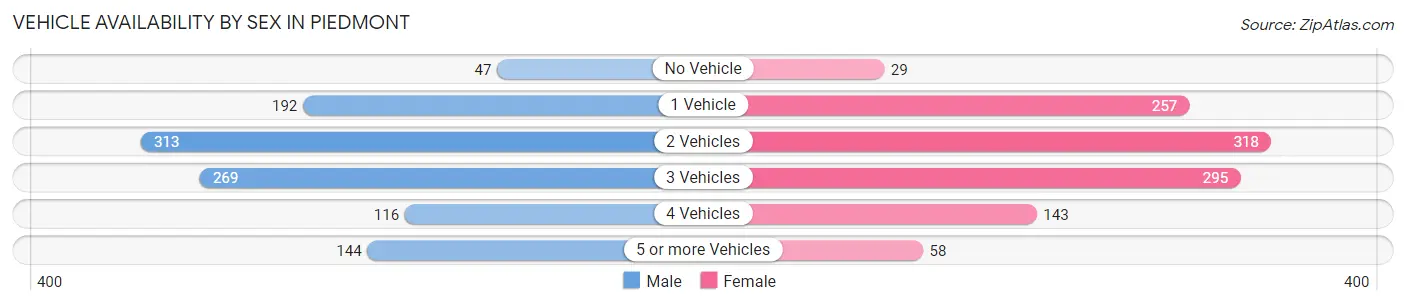
| Vehicles Available | Male | Female |
| No Vehicle | 47 (4.3%) | 29 (2.6%) |
| 1 Vehicle | 192 (17.8%) | 257 (23.4%) |
| 2 Vehicles | 313 (28.9%) | 318 (28.9%) |
| 3 Vehicles | 269 (24.9%) | 295 (26.8%) |
| 4 Vehicles | 116 (10.7%) | 143 (13.0%) |
| 5 or more Vehicles | 144 (13.3%) | 58 (5.3%) |
| Total | 1,081 (100.0%) | 1,100 (100.0%) |
Commute Time in Piedmont
The most frequently occuring commute durations in Piedmont are 45 to 59 minutes (424 commuters, 19.8%), 15 to 19 minutes (294 commuters, 13.7%), and 30 to 34 minutes (263 commuters, 12.3%).
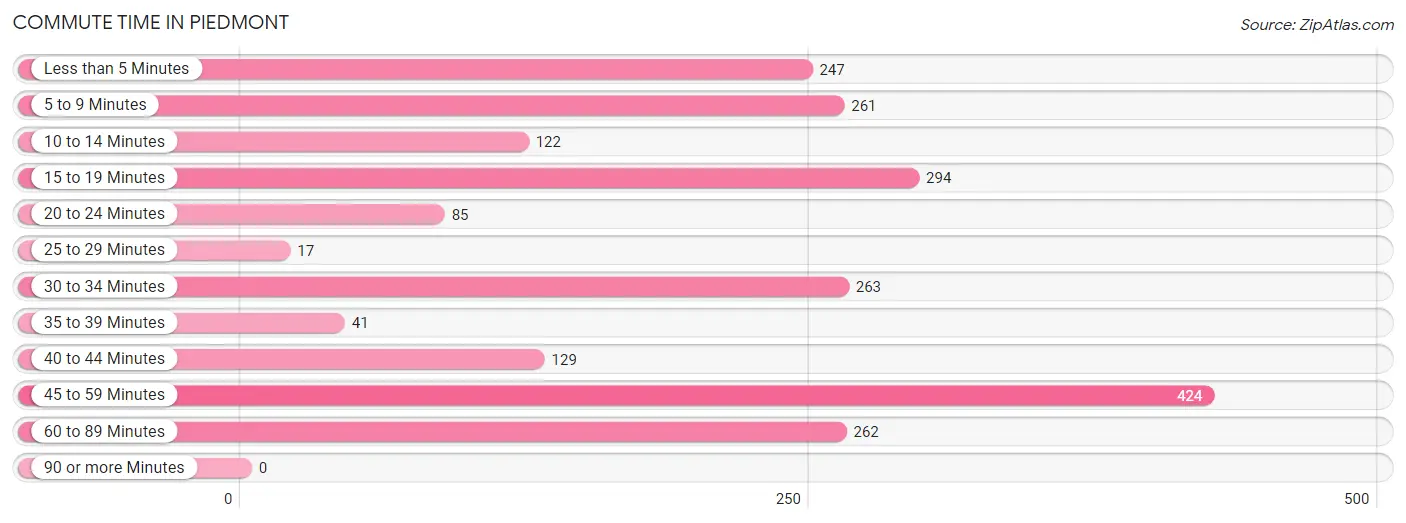
| Commute Time | # Commuters | % Commuters |
| Less than 5 Minutes | 247 | 11.5% |
| 5 to 9 Minutes | 261 | 12.2% |
| 10 to 14 Minutes | 122 | 5.7% |
| 15 to 19 Minutes | 294 | 13.7% |
| 20 to 24 Minutes | 85 | 4.0% |
| 25 to 29 Minutes | 17 | 0.8% |
| 30 to 34 Minutes | 263 | 12.3% |
| 35 to 39 Minutes | 41 | 1.9% |
| 40 to 44 Minutes | 129 | 6.0% |
| 45 to 59 Minutes | 424 | 19.8% |
| 60 to 89 Minutes | 262 | 12.2% |
| 90 or more Minutes | 0 | 0.0% |
Commute Time by Sex in Piedmont
The most common commute times in Piedmont are 45 to 59 minutes (311 commuters, 28.8%) for males and 15 to 19 minutes (186 commuters, 17.5%) for females.
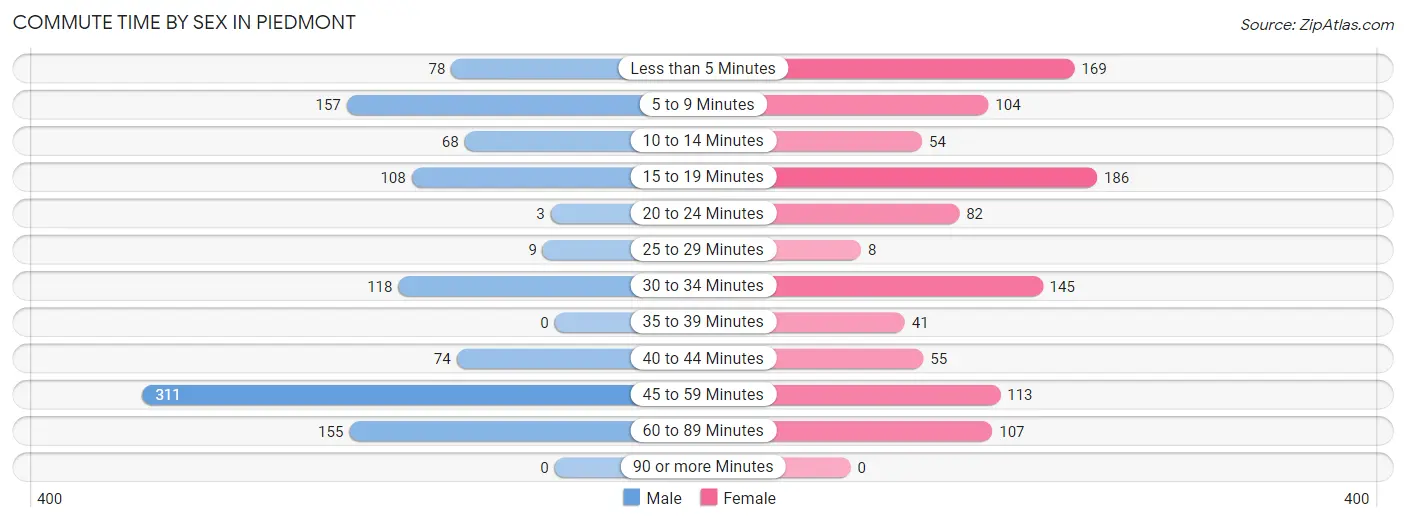
| Commute Time | Male | Female |
| Less than 5 Minutes | 78 (7.2%) | 169 (15.9%) |
| 5 to 9 Minutes | 157 (14.5%) | 104 (9.8%) |
| 10 to 14 Minutes | 68 (6.3%) | 54 (5.1%) |
| 15 to 19 Minutes | 108 (10.0%) | 186 (17.5%) |
| 20 to 24 Minutes | 3 (0.3%) | 82 (7.7%) |
| 25 to 29 Minutes | 9 (0.8%) | 8 (0.7%) |
| 30 to 34 Minutes | 118 (10.9%) | 145 (13.6%) |
| 35 to 39 Minutes | 0 (0.0%) | 41 (3.8%) |
| 40 to 44 Minutes | 74 (6.9%) | 55 (5.2%) |
| 45 to 59 Minutes | 311 (28.8%) | 113 (10.6%) |
| 60 to 89 Minutes | 155 (14.3%) | 107 (10.1%) |
| 90 or more Minutes | 0 (0.0%) | 0 (0.0%) |
Time of Departure to Work by Sex in Piedmont
The most frequent times of departure to work in Piedmont are 12:00 AM to 4:59 AM (252, 23.3%) for males and 7:00 AM to 7:29 AM (226, 21.2%) for females.
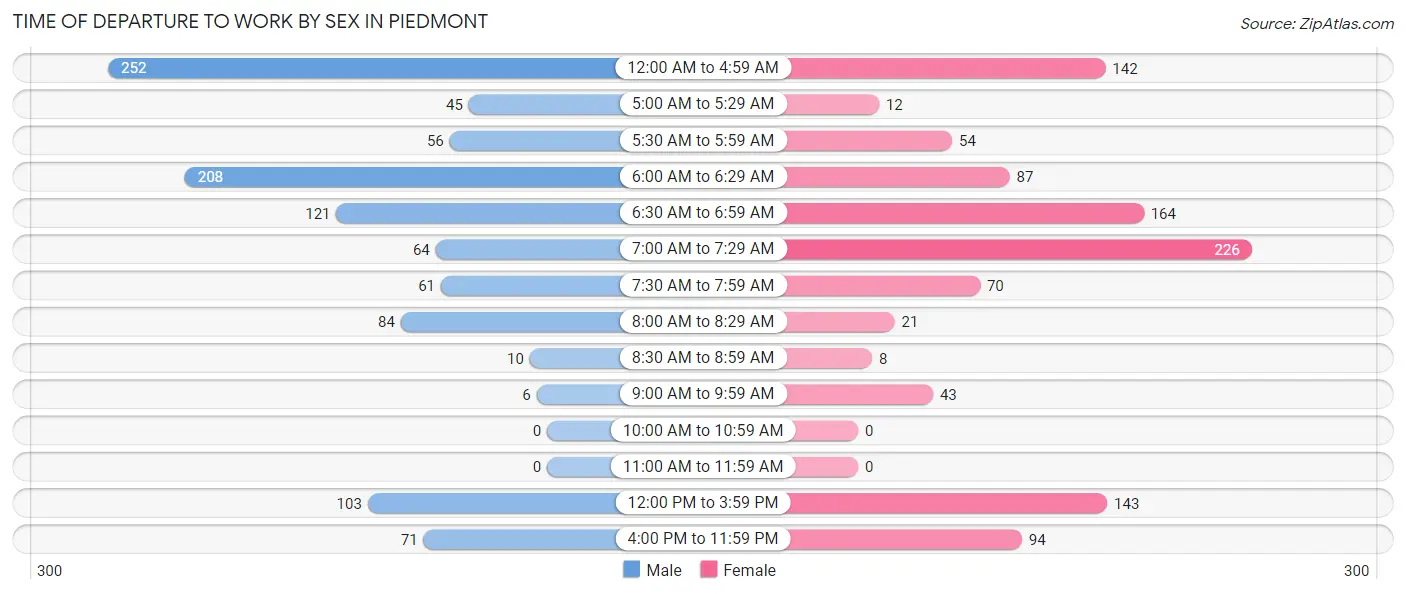
| Time of Departure | Male | Female |
| 12:00 AM to 4:59 AM | 252 (23.3%) | 142 (13.4%) |
| 5:00 AM to 5:29 AM | 45 (4.2%) | 12 (1.1%) |
| 5:30 AM to 5:59 AM | 56 (5.2%) | 54 (5.1%) |
| 6:00 AM to 6:29 AM | 208 (19.2%) | 87 (8.2%) |
| 6:30 AM to 6:59 AM | 121 (11.2%) | 164 (15.4%) |
| 7:00 AM to 7:29 AM | 64 (5.9%) | 226 (21.2%) |
| 7:30 AM to 7:59 AM | 61 (5.6%) | 70 (6.6%) |
| 8:00 AM to 8:29 AM | 84 (7.8%) | 21 (2.0%) |
| 8:30 AM to 8:59 AM | 10 (0.9%) | 8 (0.7%) |
| 9:00 AM to 9:59 AM | 6 (0.6%) | 43 (4.0%) |
| 10:00 AM to 10:59 AM | 0 (0.0%) | 0 (0.0%) |
| 11:00 AM to 11:59 AM | 0 (0.0%) | 0 (0.0%) |
| 12:00 PM to 3:59 PM | 103 (9.5%) | 143 (13.4%) |
| 4:00 PM to 11:59 PM | 71 (6.6%) | 94 (8.8%) |
| Total | 1,081 (100.0%) | 1,064 (100.0%) |
Housing Occupancy in Piedmont
Occupancy by Ownership in Piedmont
Of the total 1,728 dwellings in Piedmont, owner-occupied units account for 1,074 (62.2%), while renter-occupied units make up 654 (37.9%).
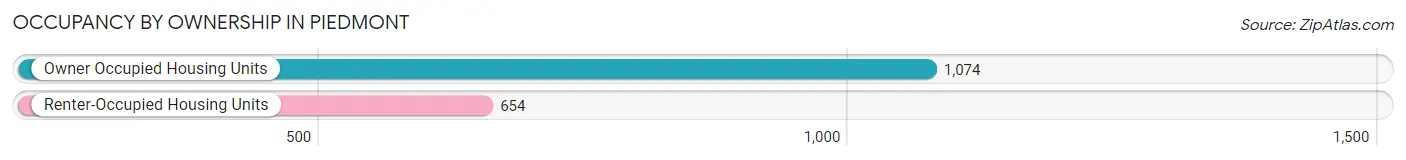
| Occupancy | # Housing Units | % Housing Units |
| Owner Occupied Housing Units | 1,074 | 62.2% |
| Renter-Occupied Housing Units | 654 | 37.9% |
| Total Occupied Housing Units | 1,728 | 100.0% |
Occupancy by Household Size in Piedmont
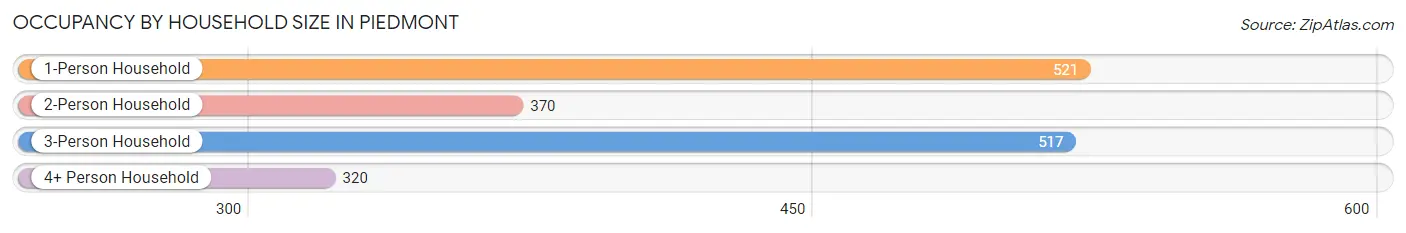
| Household Size | # Housing Units | % Housing Units |
| 1-Person Household | 521 | 30.1% |
| 2-Person Household | 370 | 21.4% |
| 3-Person Household | 517 | 29.9% |
| 4+ Person Household | 320 | 18.5% |
| Total Housing Units | 1,728 | 100.0% |
Occupancy by Ownership by Household Size in Piedmont
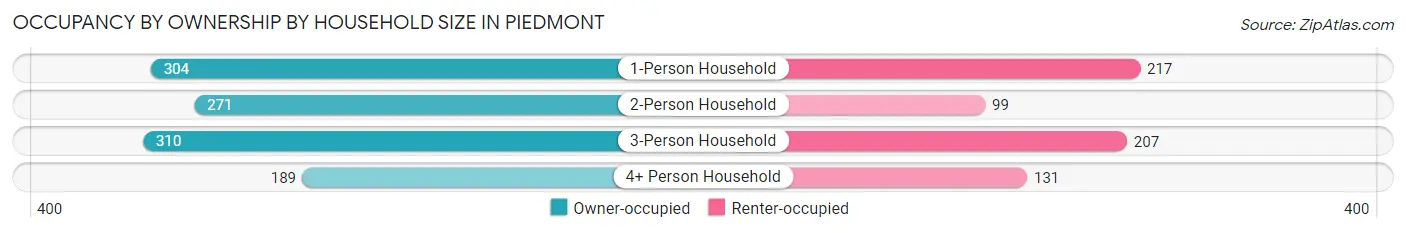
| Household Size | Owner-occupied | Renter-occupied |
| 1-Person Household | 304 (58.4%) | 217 (41.6%) |
| 2-Person Household | 271 (73.2%) | 99 (26.8%) |
| 3-Person Household | 310 (60.0%) | 207 (40.0%) |
| 4+ Person Household | 189 (59.1%) | 131 (40.9%) |
| Total Housing Units | 1,074 (62.2%) | 654 (37.9%) |
Occupancy by Educational Attainment in Piedmont
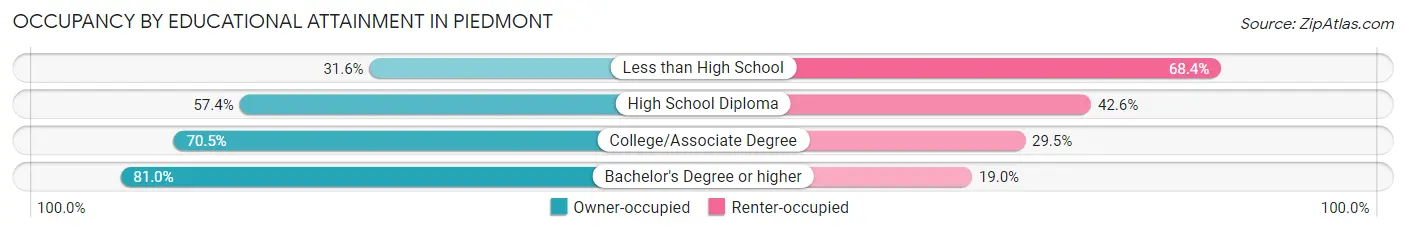
| Household Size | Owner-occupied | Renter-occupied |
| Less than High School | 68 (31.6%) | 147 (68.4%) |
| High School Diploma | 384 (57.4%) | 285 (42.6%) |
| College/Associate Degree | 413 (70.5%) | 173 (29.5%) |
| Bachelor's Degree or higher | 209 (81.0%) | 49 (19.0%) |
Occupancy by Age of Householder in Piedmont
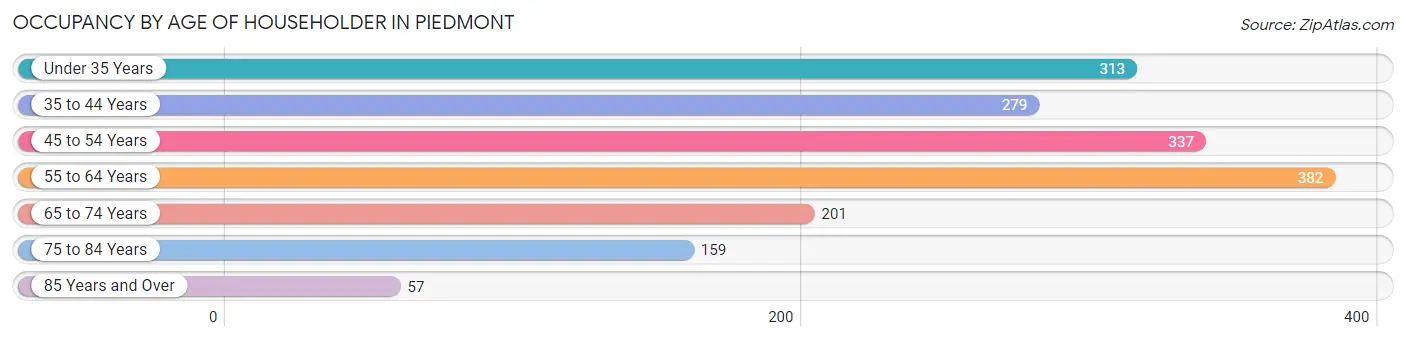
| Age Bracket | # Households | % Households |
| Under 35 Years | 313 | 18.1% |
| 35 to 44 Years | 279 | 16.2% |
| 45 to 54 Years | 337 | 19.5% |
| 55 to 64 Years | 382 | 22.1% |
| 65 to 74 Years | 201 | 11.6% |
| 75 to 84 Years | 159 | 9.2% |
| 85 Years and Over | 57 | 3.3% |
| Total | 1,728 | 100.0% |
Housing Finances in Piedmont
Median Income by Occupancy in Piedmont
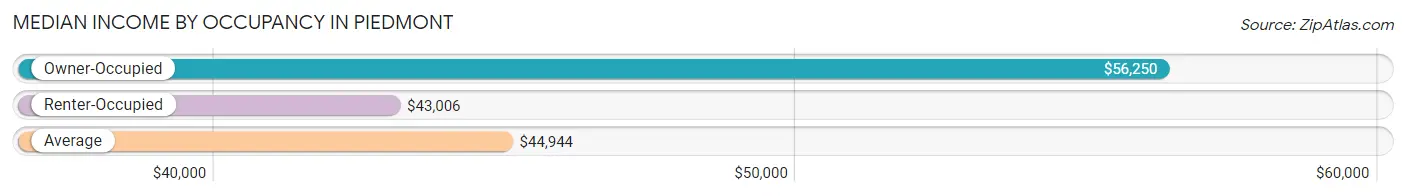
| Occupancy Type | # Households | Median Income |
| Owner-Occupied | 1,074 (62.2%) | $56,250 |
| Renter-Occupied | 654 (37.9%) | $43,006 |
| Average | 1,728 (100.0%) | $44,944 |
Occupancy by Householder Income Bracket in Piedmont
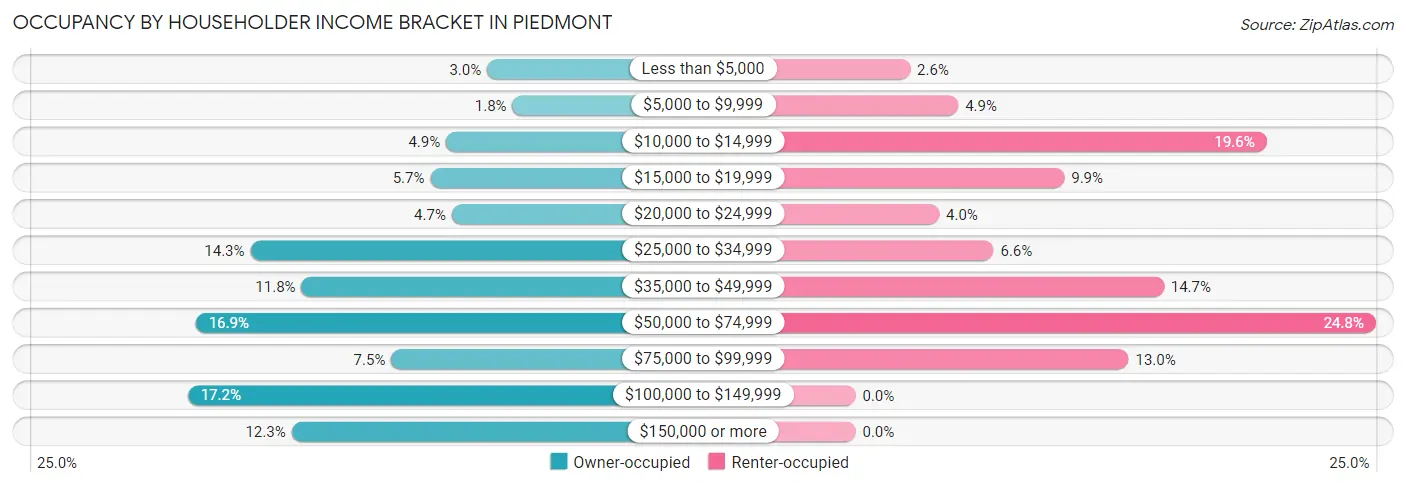
| Income Bracket | Owner-occupied | Renter-occupied |
| Less than $5,000 | 32 (3.0%) | 17 (2.6%) |
| $5,000 to $9,999 | 19 (1.8%) | 32 (4.9%) |
| $10,000 to $14,999 | 53 (4.9%) | 128 (19.6%) |
| $15,000 to $19,999 | 61 (5.7%) | 65 (9.9%) |
| $20,000 to $24,999 | 50 (4.7%) | 26 (4.0%) |
| $25,000 to $34,999 | 153 (14.2%) | 43 (6.6%) |
| $35,000 to $49,999 | 127 (11.8%) | 96 (14.7%) |
| $50,000 to $74,999 | 181 (16.9%) | 162 (24.8%) |
| $75,000 to $99,999 | 81 (7.5%) | 85 (13.0%) |
| $100,000 to $149,999 | 185 (17.2%) | 0 (0.0%) |
| $150,000 or more | 132 (12.3%) | 0 (0.0%) |
| Total | 1,074 (100.0%) | 654 (100.0%) |
Monthly Housing Cost Tiers in Piedmont
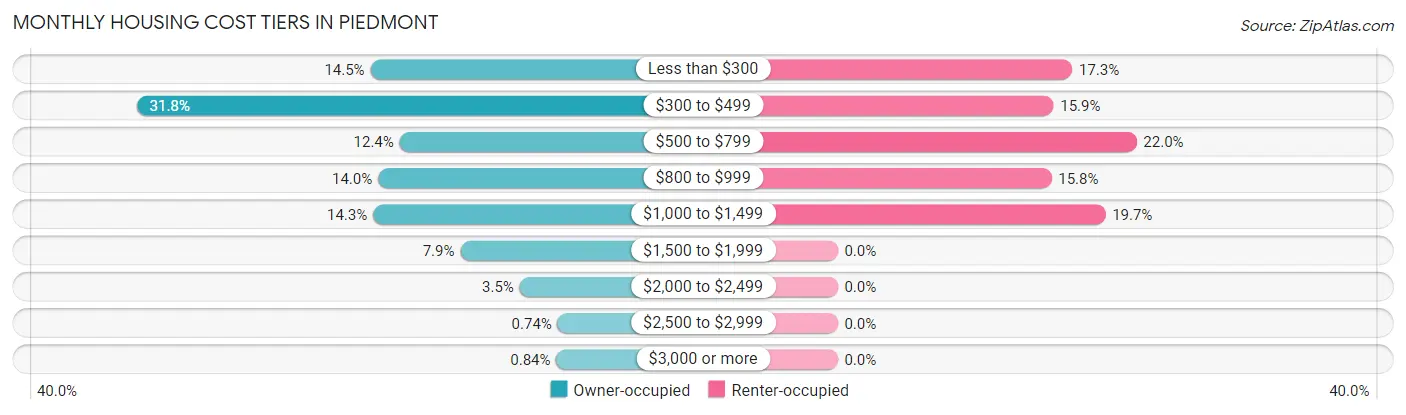
| Monthly Cost | Owner-occupied | Renter-occupied |
| Less than $300 | 156 (14.5%) | 113 (17.3%) |
| $300 to $499 | 341 (31.8%) | 104 (15.9%) |
| $500 to $799 | 133 (12.4%) | 144 (22.0%) |
| $800 to $999 | 150 (14.0%) | 103 (15.8%) |
| $1,000 to $1,499 | 154 (14.3%) | 129 (19.7%) |
| $1,500 to $1,999 | 85 (7.9%) | 0 (0.0%) |
| $2,000 to $2,499 | 38 (3.5%) | 0 (0.0%) |
| $2,500 to $2,999 | 8 (0.7%) | 0 (0.0%) |
| $3,000 or more | 9 (0.8%) | 0 (0.0%) |
| Total | 1,074 (100.0%) | 654 (100.0%) |
Physical Housing Characteristics in Piedmont
Housing Structures in Piedmont
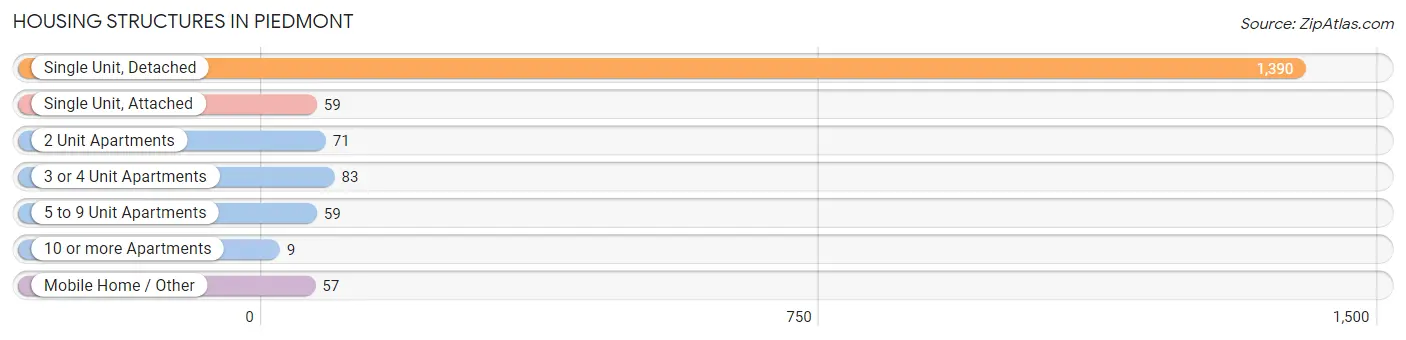
| Structure Type | # Housing Units | % Housing Units |
| Single Unit, Detached | 1,390 | 80.4% |
| Single Unit, Attached | 59 | 3.4% |
| 2 Unit Apartments | 71 | 4.1% |
| 3 or 4 Unit Apartments | 83 | 4.8% |
| 5 to 9 Unit Apartments | 59 | 3.4% |
| 10 or more Apartments | 9 | 0.5% |
| Mobile Home / Other | 57 | 3.3% |
| Total | 1,728 | 100.0% |
Housing Structures by Occupancy in Piedmont
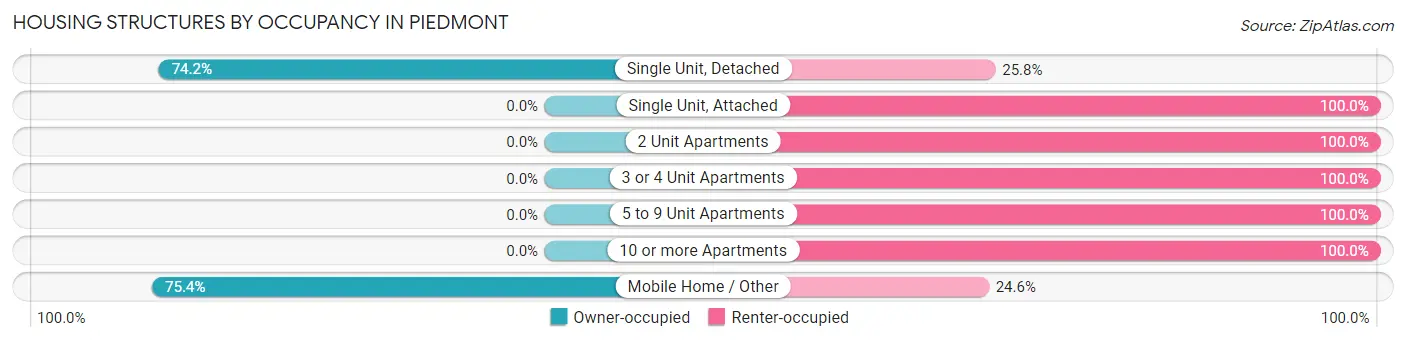
| Structure Type | Owner-occupied | Renter-occupied |
| Single Unit, Detached | 1,031 (74.2%) | 359 (25.8%) |
| Single Unit, Attached | 0 (0.0%) | 59 (100.0%) |
| 2 Unit Apartments | 0 (0.0%) | 71 (100.0%) |
| 3 or 4 Unit Apartments | 0 (0.0%) | 83 (100.0%) |
| 5 to 9 Unit Apartments | 0 (0.0%) | 59 (100.0%) |
| 10 or more Apartments | 0 (0.0%) | 9 (100.0%) |
| Mobile Home / Other | 43 (75.4%) | 14 (24.6%) |
| Total | 1,074 (62.2%) | 654 (37.9%) |
Housing Structures by Number of Rooms in Piedmont
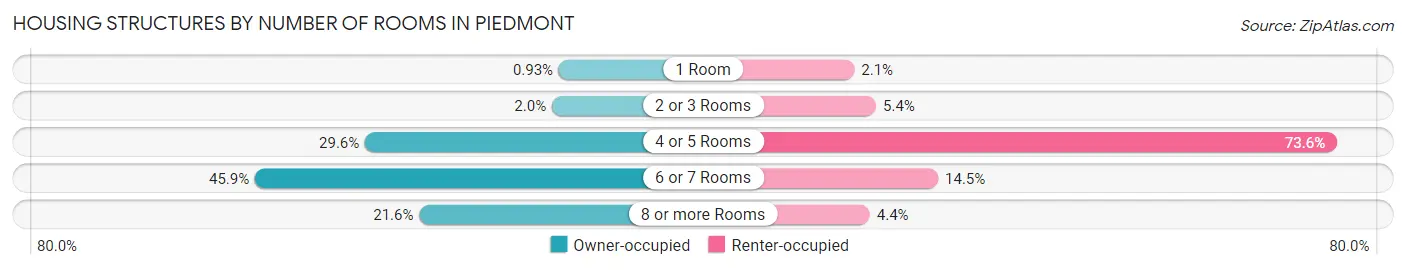
| Number of Rooms | Owner-occupied | Renter-occupied |
| 1 Room | 10 (0.9%) | 14 (2.1%) |
| 2 or 3 Rooms | 21 (2.0%) | 35 (5.3%) |
| 4 or 5 Rooms | 318 (29.6%) | 481 (73.6%) |
| 6 or 7 Rooms | 493 (45.9%) | 95 (14.5%) |
| 8 or more Rooms | 232 (21.6%) | 29 (4.4%) |
| Total | 1,074 (100.0%) | 654 (100.0%) |
Housing Structure by Heating Type in Piedmont
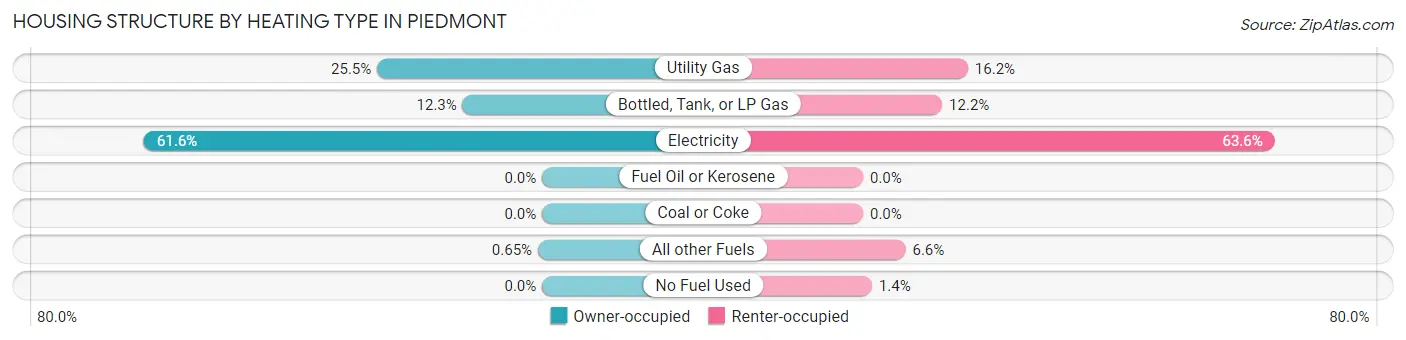
| Heating Type | Owner-occupied | Renter-occupied |
| Utility Gas | 274 (25.5%) | 106 (16.2%) |
| Bottled, Tank, or LP Gas | 132 (12.3%) | 80 (12.2%) |
| Electricity | 661 (61.6%) | 416 (63.6%) |
| Fuel Oil or Kerosene | 0 (0.0%) | 0 (0.0%) |
| Coal or Coke | 0 (0.0%) | 0 (0.0%) |
| All other Fuels | 7 (0.6%) | 43 (6.6%) |
| No Fuel Used | 0 (0.0%) | 9 (1.4%) |
| Total | 1,074 (100.0%) | 654 (100.0%) |
Household Vehicle Usage in Piedmont
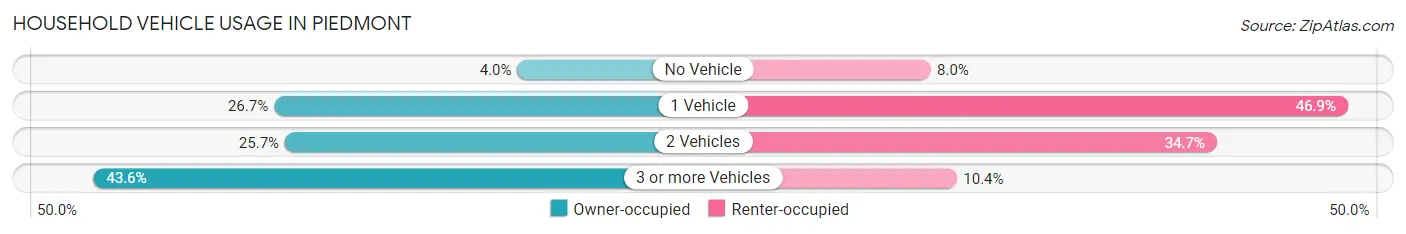
| Vehicles per Household | Owner-occupied | Renter-occupied |
| No Vehicle | 43 (4.0%) | 52 (8.0%) |
| 1 Vehicle | 287 (26.7%) | 307 (46.9%) |
| 2 Vehicles | 276 (25.7%) | 227 (34.7%) |
| 3 or more Vehicles | 468 (43.6%) | 68 (10.4%) |
| Total | 1,074 (100.0%) | 654 (100.0%) |
Real Estate & Mortgages in Piedmont
Real Estate and Mortgage Overview in Piedmont
| Characteristic | Without Mortgage | With Mortgage |
| Housing Units | 644 | 430 |
| Median Property Value | $99,100 | $118,300 |
| Median Household Income | $42,308 | $71 |
| Monthly Housing Costs | $400 | $0 |
| Real Estate Taxes | $478 | $103 |
Property Value by Mortgage Status in Piedmont
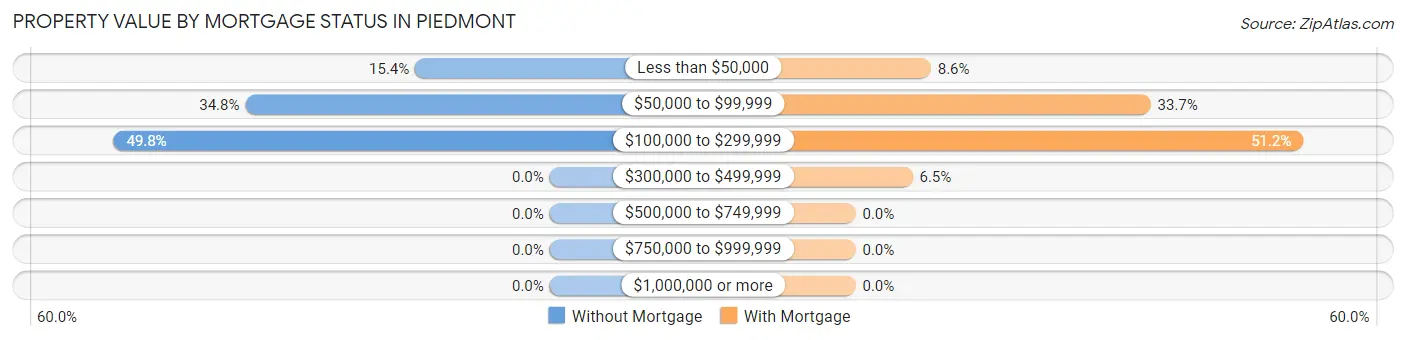
| Property Value | Without Mortgage | With Mortgage |
| Less than $50,000 | 99 (15.4%) | 37 (8.6%) |
| $50,000 to $99,999 | 224 (34.8%) | 145 (33.7%) |
| $100,000 to $299,999 | 321 (49.8%) | 220 (51.2%) |
| $300,000 to $499,999 | 0 (0.0%) | 28 (6.5%) |
| $500,000 to $749,999 | 0 (0.0%) | 0 (0.0%) |
| $750,000 to $999,999 | 0 (0.0%) | 0 (0.0%) |
| $1,000,000 or more | 0 (0.0%) | 0 (0.0%) |
| Total | 644 (100.0%) | 430 (100.0%) |
Household Income by Mortgage Status in Piedmont
| Household Income | Without Mortgage | With Mortgage |
| Less than $10,000 | 51 (7.9%) | 0 (0.0%) |
| $10,000 to $24,999 | 147 (22.8%) | 0 (0.0%) |
| $25,000 to $34,999 | 90 (14.0%) | 17 (4.0%) |
| $35,000 to $49,999 | 99 (15.4%) | 63 (14.6%) |
| $50,000 to $74,999 | 113 (17.5%) | 28 (6.5%) |
| $75,000 to $99,999 | 29 (4.5%) | 68 (15.8%) |
| $100,000 to $149,999 | 54 (8.4%) | 52 (12.1%) |
| $150,000 or more | 61 (9.5%) | 131 (30.5%) |
| Total | 644 (100.0%) | 430 (100.0%) |
Property Value to Household Income Ratio in Piedmont
| Value-to-Income Ratio | Without Mortgage | With Mortgage |
| Less than 2.0x | 317 (49.2%) | 82,000 (19,069.8%) |
| 2.0x to 2.9x | 62 (9.6%) | 300 (69.8%) |
| 3.0x to 3.9x | 84 (13.0%) | 53 (12.3%) |
| 4.0x or more | 181 (28.1%) | 25 (5.8%) |
| Total | 644 (100.0%) | 430 (100.0%) |
Real Estate Taxes by Mortgage Status in Piedmont
| Property Taxes | Without Mortgage | With Mortgage |
| Less than $800 | 302 (46.9%) | 0 (0.0%) |
| $800 to $1,499 | 77 (12.0%) | 168 (39.1%) |
| $800 to $1,499 | 19 (2.9%) | 139 (32.3%) |
| Total | 644 (100.0%) | 430 (100.0%) |
Health & Disability in Piedmont
Health Insurance Coverage by Age in Piedmont
| Age Bracket | With Coverage | Without Coverage |
| Under 6 Years | 339 (100.0%) | 0 (0.0%) |
| 6 to 18 Years | 735 (93.5%) | 51 (6.5%) |
| 19 to 25 Years | 526 (84.8%) | 94 (15.2%) |
| 26 to 34 Years | 180 (42.4%) | 244 (57.6%) |
| 35 to 44 Years | 483 (90.6%) | 50 (9.4%) |
| 45 to 54 Years | 544 (69.8%) | 235 (30.2%) |
| 55 to 64 Years | 597 (85.8%) | 99 (14.2%) |
| 65 to 74 Years | 240 (96.4%) | 9 (3.6%) |
| 75 Years and older | 294 (100.0%) | 0 (0.0%) |
| Total | 3,938 (83.4%) | 782 (16.6%) |
Health Insurance Coverage by Citizenship Status in Piedmont

| Citizenship Status | With Coverage | Without Coverage |
| Native Born | 339 (100.0%) | 0 (0.0%) |
| Foreign Born, Citizen | 735 (93.5%) | 51 (6.5%) |
| Foreign Born, not a Citizen | 526 (84.8%) | 94 (15.2%) |
Health Insurance Coverage by Household Income in Piedmont
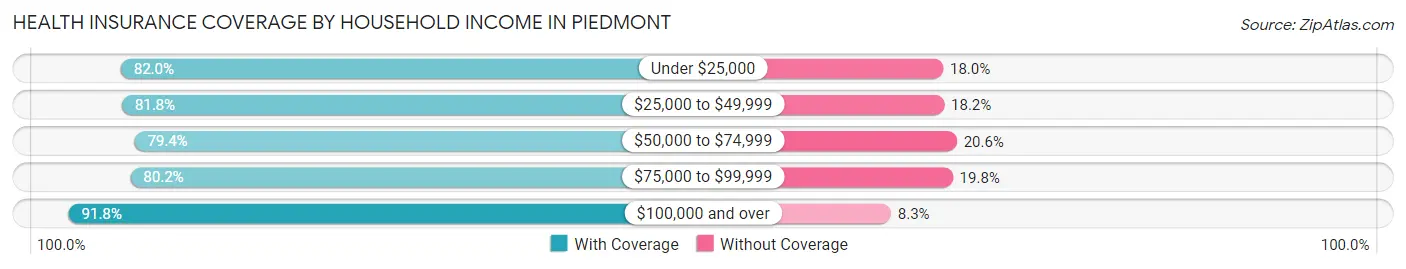
| Household Income | With Coverage | Without Coverage |
| Under $25,000 | 582 (82.0%) | 128 (18.0%) |
| $25,000 to $49,999 | 821 (81.8%) | 183 (18.2%) |
| $50,000 to $74,999 | 721 (79.4%) | 187 (20.6%) |
| $75,000 to $99,999 | 768 (80.2%) | 190 (19.8%) |
| $100,000 and over | 1,046 (91.7%) | 94 (8.3%) |
Public vs Private Health Insurance Coverage by Age in Piedmont
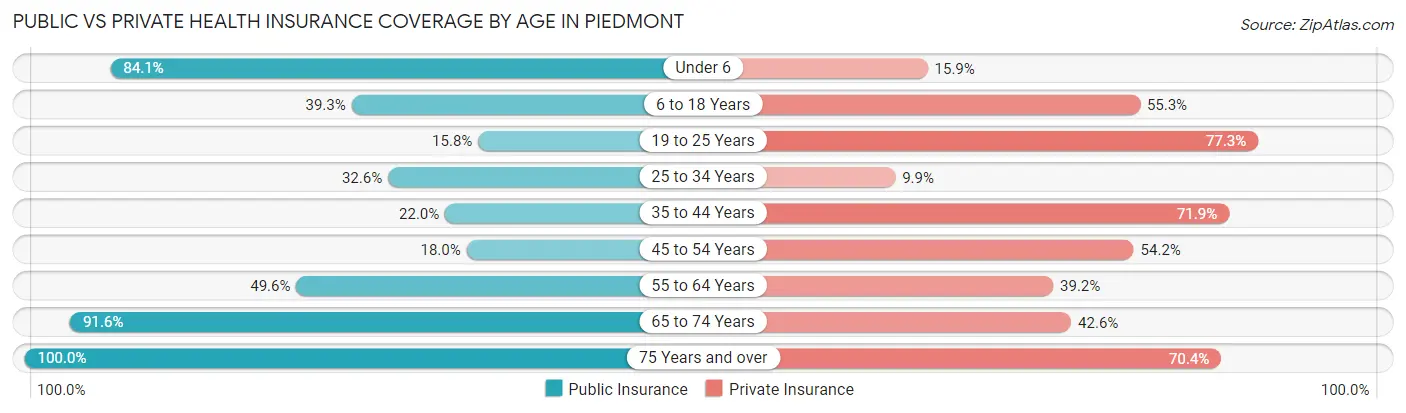
| Age Bracket | Public Insurance | Private Insurance |
| Under 6 | 285 (84.1%) | 54 (15.9%) |
| 6 to 18 Years | 309 (39.3%) | 435 (55.3%) |
| 19 to 25 Years | 98 (15.8%) | 479 (77.3%) |
| 25 to 34 Years | 138 (32.6%) | 42 (9.9%) |
| 35 to 44 Years | 117 (22.0%) | 383 (71.9%) |
| 45 to 54 Years | 140 (18.0%) | 422 (54.2%) |
| 55 to 64 Years | 345 (49.6%) | 273 (39.2%) |
| 65 to 74 Years | 228 (91.6%) | 106 (42.6%) |
| 75 Years and over | 294 (100.0%) | 207 (70.4%) |
| Total | 1,954 (41.4%) | 2,401 (50.9%) |
Disability Status by Sex by Age in Piedmont
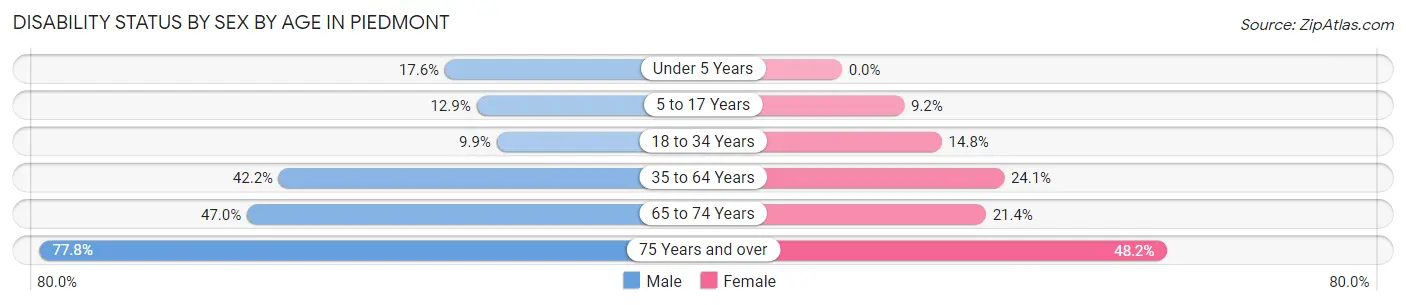
| Age Bracket | Male | Female |
| Under 5 Years | 16 (17.6%) | 0 (0.0%) |
| 5 to 17 Years | 32 (12.9%) | 42 (9.2%) |
| 18 to 34 Years | 50 (9.9%) | 98 (14.8%) |
| 35 to 64 Years | 422 (42.2%) | 243 (24.1%) |
| 65 to 74 Years | 62 (47.0%) | 25 (21.4%) |
| 75 Years and over | 35 (77.8%) | 120 (48.2%) |
Disability Class by Sex by Age in Piedmont
Disability Class: Hearing Difficulty
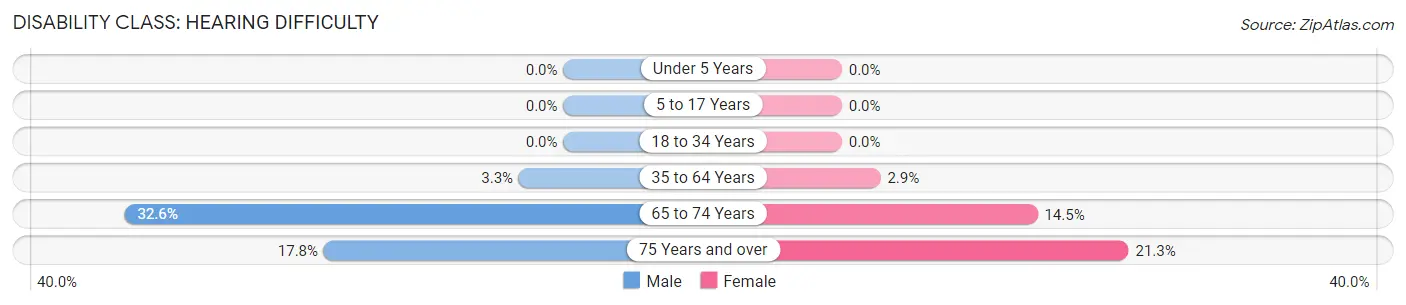
| Age Bracket | Male | Female |
| Under 5 Years | 0 (0.0%) | 0 (0.0%) |
| 5 to 17 Years | 0 (0.0%) | 0 (0.0%) |
| 18 to 34 Years | 0 (0.0%) | 0 (0.0%) |
| 35 to 64 Years | 33 (3.3%) | 29 (2.9%) |
| 65 to 74 Years | 43 (32.6%) | 17 (14.5%) |
| 75 Years and over | 8 (17.8%) | 53 (21.3%) |
Disability Class: Vision Difficulty
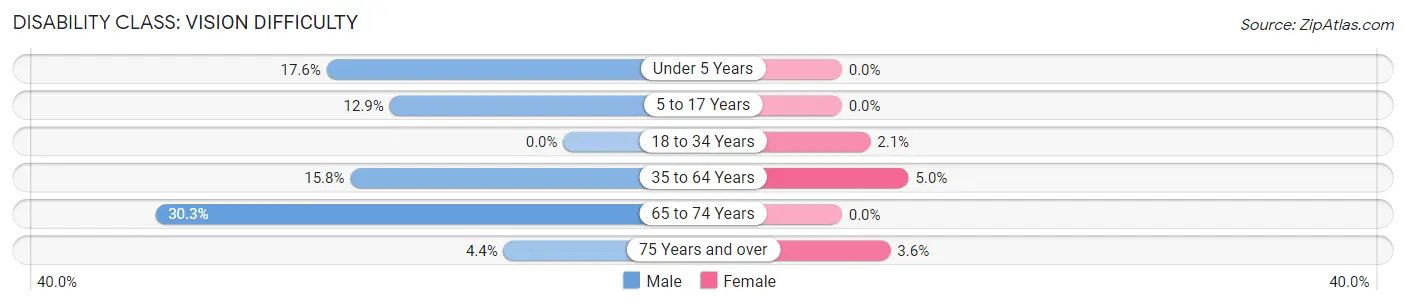
| Age Bracket | Male | Female |
| Under 5 Years | 16 (17.6%) | 0 (0.0%) |
| 5 to 17 Years | 32 (12.9%) | 0 (0.0%) |
| 18 to 34 Years | 0 (0.0%) | 14 (2.1%) |
| 35 to 64 Years | 158 (15.8%) | 50 (5.0%) |
| 65 to 74 Years | 40 (30.3%) | 0 (0.0%) |
| 75 Years and over | 2 (4.4%) | 9 (3.6%) |
Disability Class: Cognitive Difficulty
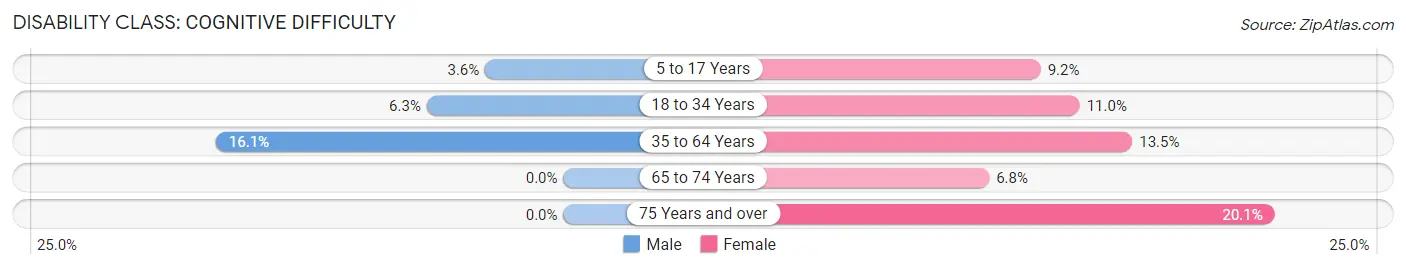
| Age Bracket | Male | Female |
| 5 to 17 Years | 9 (3.6%) | 42 (9.2%) |
| 18 to 34 Years | 32 (6.3%) | 73 (11.0%) |
| 35 to 64 Years | 161 (16.1%) | 136 (13.5%) |
| 65 to 74 Years | 0 (0.0%) | 8 (6.8%) |
| 75 Years and over | 0 (0.0%) | 50 (20.1%) |
Disability Class: Ambulatory Difficulty
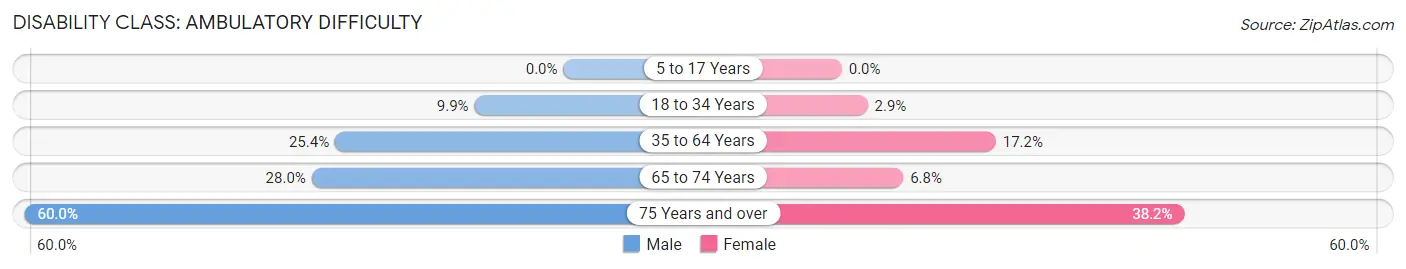
| Age Bracket | Male | Female |
| 5 to 17 Years | 0 (0.0%) | 0 (0.0%) |
| 18 to 34 Years | 50 (9.9%) | 19 (2.9%) |
| 35 to 64 Years | 254 (25.4%) | 173 (17.2%) |
| 65 to 74 Years | 37 (28.0%) | 8 (6.8%) |
| 75 Years and over | 27 (60.0%) | 95 (38.2%) |
Disability Class: Self-Care Difficulty
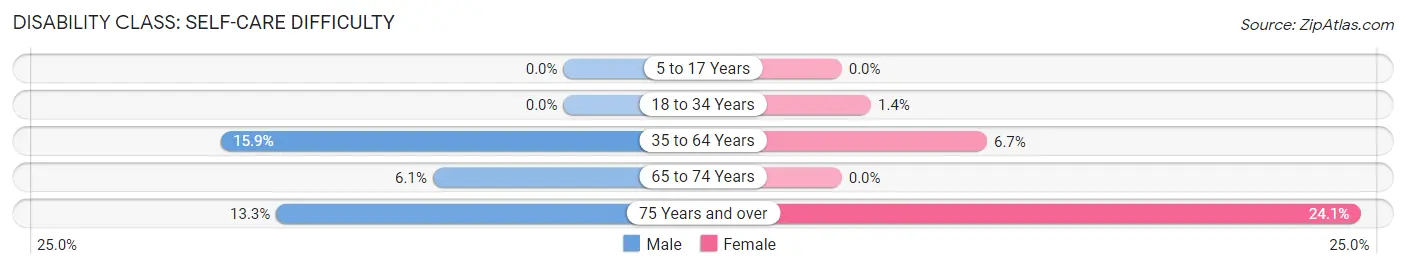
| Age Bracket | Male | Female |
| 5 to 17 Years | 0 (0.0%) | 0 (0.0%) |
| 18 to 34 Years | 0 (0.0%) | 9 (1.4%) |
| 35 to 64 Years | 159 (15.9%) | 68 (6.7%) |
| 65 to 74 Years | 8 (6.1%) | 0 (0.0%) |
| 75 Years and over | 6 (13.3%) | 60 (24.1%) |
Technology Access in Piedmont
Computing Device Access in Piedmont
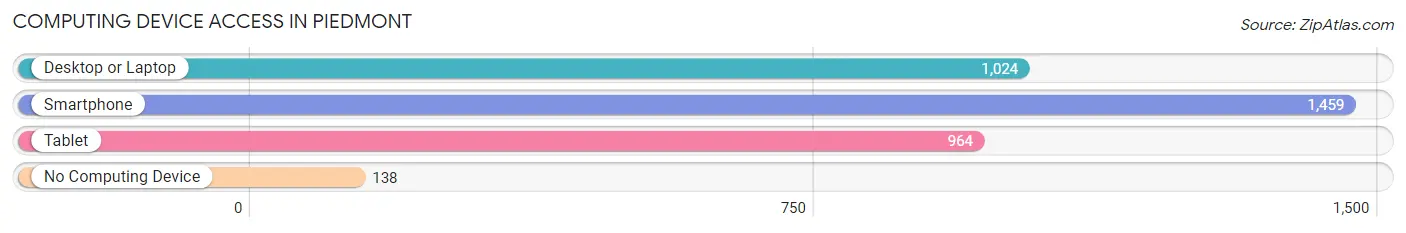
| Device Type | # Households | % Households |
| Desktop or Laptop | 1,024 | 59.3% |
| Smartphone | 1,459 | 84.4% |
| Tablet | 964 | 55.8% |
| No Computing Device | 138 | 8.0% |
| Total | 1,728 | 100.0% |
Internet Access in Piedmont
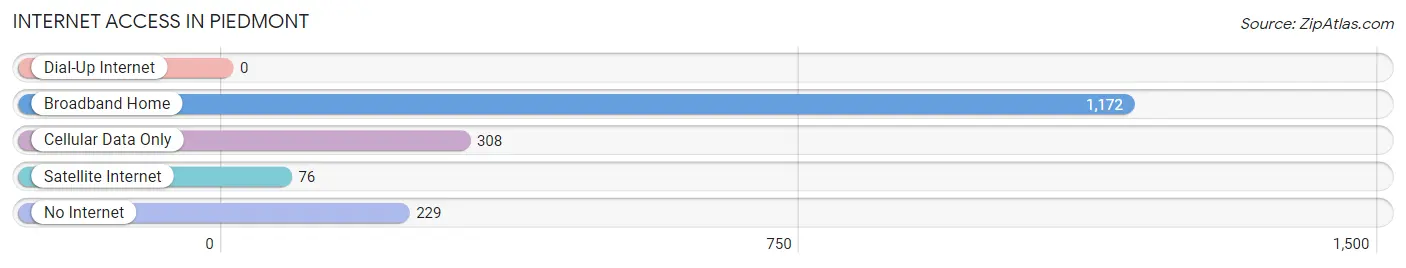
| Internet Type | # Households | % Households |
| Dial-Up Internet | 0 | 0.0% |
| Broadband Home | 1,172 | 67.8% |
| Cellular Data Only | 308 | 17.8% |
| Satellite Internet | 76 | 4.4% |
| No Internet | 229 | 13.3% |
| Total | 1,728 | 100.0% |
Piedmont Summary
Piedmont, Alabama is a small city located in Calhoun County, Alabama. It is situated in the foothills of the Appalachian Mountains and is part of the Anniston-Oxford Metropolitan Statistical Area. The city has a population of 4,878 as of the 2010 census.
History
Piedmont was founded in 1882 by the East Tennessee, Virginia, and Georgia Railroad. The city was named after the Piedmont region of Italy, which was the birthplace of the railroad's president, William H. H. Clayton. The city was incorporated in 1887 and was the first city in Calhoun County to be incorporated.
The city was a major center for the coal mining industry in the late 19th and early 20th centuries. The coal mines provided employment for many of the city's residents and helped to fuel the local economy. The city also had a thriving textile industry, which provided employment for many of the city's residents.
Geography
Piedmont is located in the foothills of the Appalachian Mountains in Calhoun County, Alabama. The city is situated at the intersection of U.S. Route 278 and Alabama State Route 21. The city is located approximately 25 miles east of Anniston and approximately 50 miles west of Atlanta, Georgia.
The city has a total area of 4.3 square miles, all of which is land. The city is located at an elevation of 845 feet above sea level.
Economy
The economy of Piedmont is largely based on the coal mining industry. The city is home to several coal mines, which provide employment for many of the city's residents. The city also has a thriving textile industry, which provides employment for many of the city's residents.
The city is also home to several small businesses, including restaurants, retail stores, and service providers. The city is also home to several manufacturing plants, which provide employment for many of the city's residents.
Demographics
As of the 2010 census, the population of Piedmont was 4,878. The racial makeup of the city was 79.3% White, 17.3% African American, 0.3% Native American, 0.3% Asian, 0.1% Pacific Islander, 0.7% from other races, and 2.0% from two or more races. Hispanic or Latino of any race were 1.7% of the population.
The median income for a household in the city was $30,938, and the median income for a family was $37,917. The per capita income for the city was $17,845. About 17.3% of families and 20.2% of the population were below the poverty line, including 28.3% of those under age 18 and 15.2% of those age 65 or over.
Common Questions
What is Per Capita Income in Piedmont?
Per Capita income in Piedmont is $23,940.
What is the Median Family Income in Piedmont?
Median Family Income in Piedmont is $59,888.
What is the Median Household income in Piedmont?
Median Household Income in Piedmont is $44,944.
What is Income or Wage Gap in Piedmont?
Income or Wage Gap in Piedmont is 12.5%.
Women in Piedmont earn 87.5 cents for every dollar earned by a man.
What is Inequality or Gini Index in Piedmont?
Inequality or Gini Index in Piedmont is 0.44.
What is the Total Population of Piedmont?
Total Population of Piedmont is 4,761.
What is the Total Male Population of Piedmont?
Total Male Population of Piedmont is 2,024.
What is the Total Female Population of Piedmont?
Total Female Population of Piedmont is 2,737.
What is the Ratio of Males per 100 Females in Piedmont?
There are 73.95 Males per 100 Females in Piedmont.
What is the Ratio of Females per 100 Males in Piedmont?
There are 135.23 Females per 100 Males in Piedmont.
What is the Median Population Age in Piedmont?
Median Population Age in Piedmont is 39.5 Years.
What is the Average Family Size in Piedmont
Average Family Size in Piedmont is 3.4 People.
What is the Average Household Size in Piedmont
Average Household Size in Piedmont is 2.7 People.
How Large is the Labor Force in Piedmont?
There are 2,297 People in the Labor Forcein in Piedmont.
What is the Percentage of People in the Labor Force in Piedmont?
59.8% of People are in the Labor Force in Piedmont.
What is the Unemployment Rate in Piedmont?
Unemployment Rate in Piedmont is 4.4%.