Childersburg, AL Map & Demographics
Childersburg Map
Childersburg Overview
$28,986
PER CAPITA INCOME
$47,739
AVG FAMILY INCOME
$45,483
AVG HOUSEHOLD INCOME
27.1%
WAGE / INCOME GAP [ % ]
72.9¢/ $1
WAGE / INCOME GAP [ $ ]
0.49
INEQUALITY / GINI INDEX
4,743
TOTAL POPULATION
2,432
MALE POPULATION
2,311
FEMALE POPULATION
105.24
MALES / 100 FEMALES
95.02
FEMALES / 100 MALES
42.0
MEDIAN AGE
2.8
AVG FAMILY SIZE
2.4
AVG HOUSEHOLD SIZE
2,125
LABOR FORCE [ PEOPLE ]
55.9%
PERCENT IN LABOR FORCE
8.2%
UNEMPLOYMENT RATE
Childersburg Zip Codes
Childersburg Area Codes
Income in Childersburg
Income Overview in Childersburg
Per Capita Income in Childersburg is $28,986, while median incomes of families and households are $47,739 and $45,483 respectively.
| Characteristic | Number | Measure |
| Per Capita Income | 4,743 | $28,986 |
| Median Family Income | 1,465 | $47,739 |
| Mean Family Income | 1,465 | $76,226 |
| Median Household Income | 2,012 | $45,483 |
| Mean Household Income | 2,012 | $68,236 |
| Income Deficit | 1,465 | $0 |
| Wage / Income Gap (%) | 4,743 | 27.11% |
| Wage / Income Gap ($) | 4,743 | 72.89¢ per $1 |
| Gini / Inequality Index | 4,743 | 0.49 |
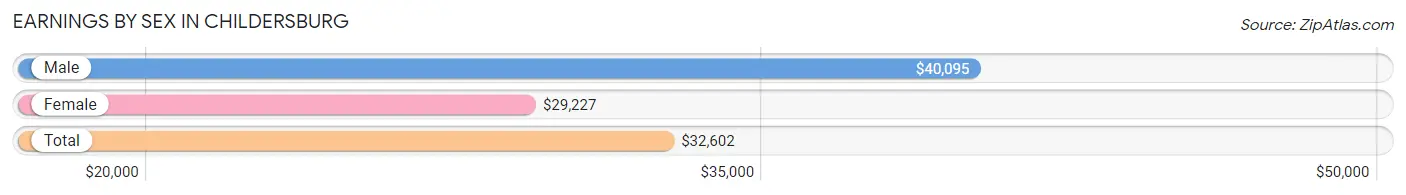
Earnings by Sex in Childersburg
Average Earnings in Childersburg are $32,602, $40,095 for men and $29,227 for women, a difference of 27.1%.
| Sex | Number | Average Earnings |
| Male | 1,092 (50.1%) | $40,095 |
| Female | 1,088 (49.9%) | $29,227 |
| Total | 2,180 (100.0%) | $32,602 |
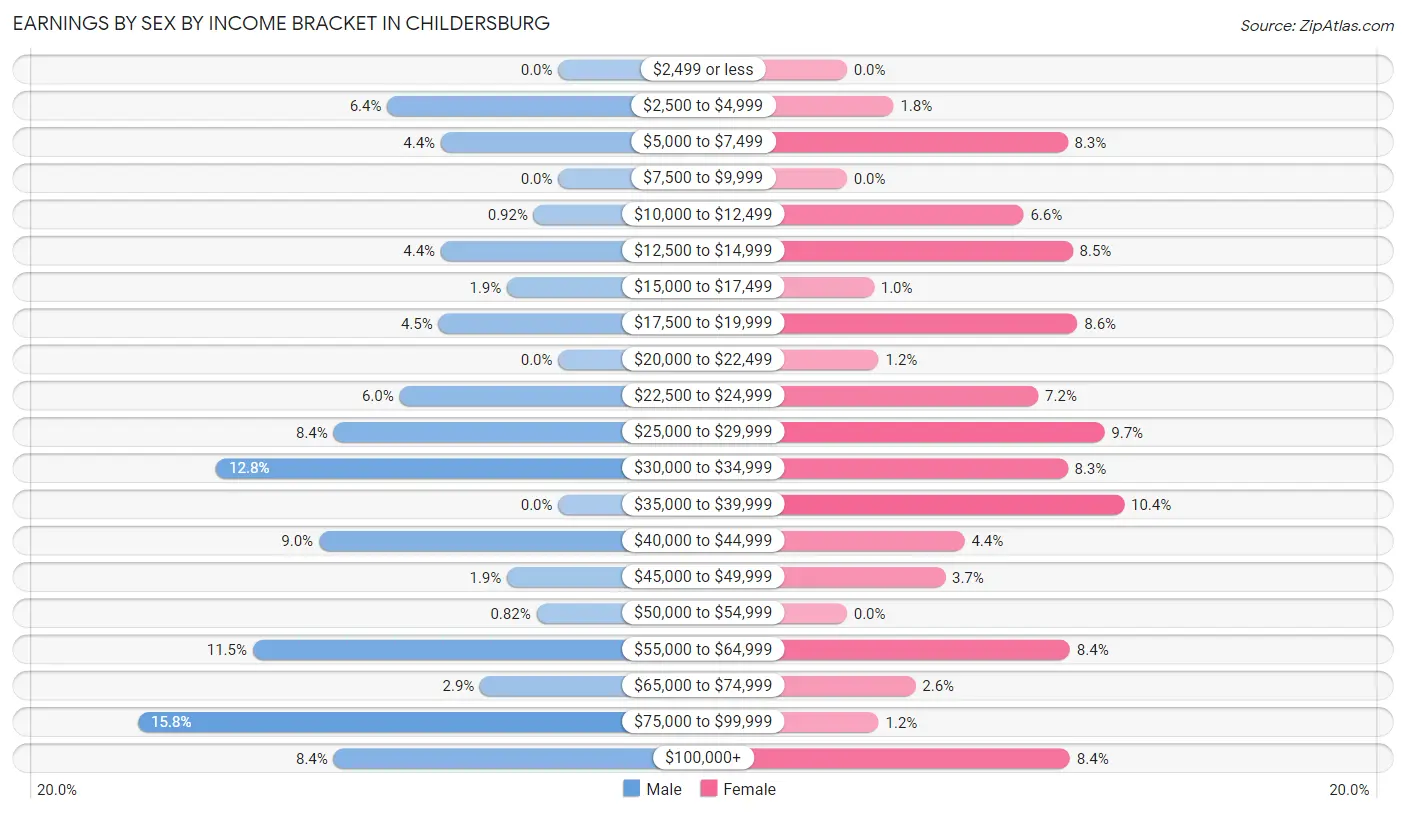
Earnings by Sex by Income Bracket in Childersburg
The most common earnings brackets in Childersburg are $75,000 to $99,999 for men (172 | 15.8%) and $35,000 to $39,999 for women (113 | 10.4%).
| Income | Male | Female |
| $2,499 or less | 0 (0.0%) | 0 (0.0%) |
| $2,500 to $4,999 | 70 (6.4%) | 19 (1.8%) |
| $5,000 to $7,499 | 48 (4.4%) | 90 (8.3%) |
| $7,500 to $9,999 | 0 (0.0%) | 0 (0.0%) |
| $10,000 to $12,499 | 10 (0.9%) | 72 (6.6%) |
| $12,500 to $14,999 | 48 (4.4%) | 92 (8.5%) |
| $15,000 to $17,499 | 21 (1.9%) | 11 (1.0%) |
| $17,500 to $19,999 | 49 (4.5%) | 94 (8.6%) |
| $20,000 to $22,499 | 0 (0.0%) | 13 (1.2%) |
| $22,500 to $24,999 | 65 (5.9%) | 78 (7.2%) |
| $25,000 to $29,999 | 92 (8.4%) | 105 (9.7%) |
| $30,000 to $34,999 | 140 (12.8%) | 90 (8.3%) |
| $35,000 to $39,999 | 0 (0.0%) | 113 (10.4%) |
| $40,000 to $44,999 | 98 (9.0%) | 48 (4.4%) |
| $45,000 to $49,999 | 21 (1.9%) | 40 (3.7%) |
| $50,000 to $54,999 | 9 (0.8%) | 0 (0.0%) |
| $55,000 to $64,999 | 125 (11.5%) | 91 (8.4%) |
| $65,000 to $74,999 | 32 (2.9%) | 28 (2.6%) |
| $75,000 to $99,999 | 172 (15.8%) | 13 (1.2%) |
| $100,000+ | 92 (8.4%) | 91 (8.4%) |
| Total | 1,092 (100.0%) | 1,088 (100.0%) |
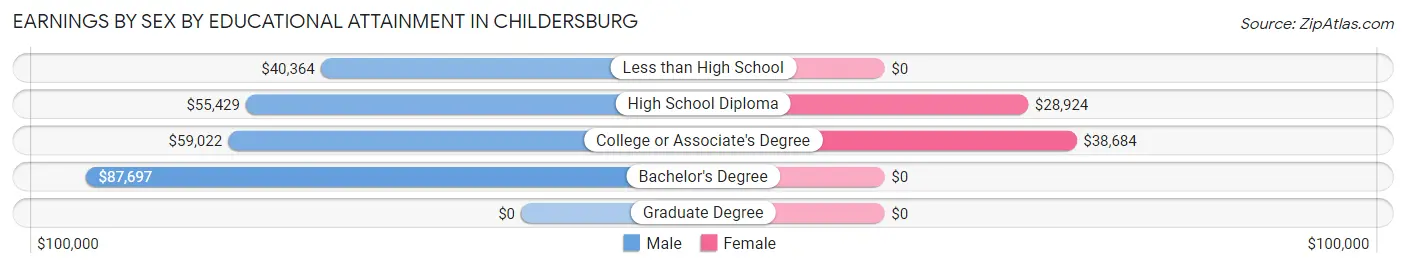
Earnings by Sex by Educational Attainment in Childersburg
Average earnings in Childersburg are $47,381 for men and $31,194 for women, a difference of 34.2%. Men with an educational attainment of bachelor's degree enjoy the highest average annual earnings of $87,697, while those with less than high school education earn the least with $40,364. Women with an educational attainment of college or associate's degree earn the most with the average annual earnings of $38,684, while those with high school diploma education have the smallest earnings of $28,924.
| Educational Attainment | Male Income | Female Income |
| Less than High School | $40,364 | $0 |
| High School Diploma | $55,429 | $28,924 |
| College or Associate's Degree | $59,022 | $38,684 |
| Bachelor's Degree | $87,697 | $0 |
| Graduate Degree | - | - |
| Total | $47,381 | $31,194 |
Family Income in Childersburg
Family Income Brackets in Childersburg
According to the Childersburg family income data, there are 308 families falling into the $100,000 to $149,999 income range, which is the most common income bracket and makes up 21.0% of all families. Conversely, the $75,000 to $99,999 income bracket is the least frequent group with only 48 families (3.3%) belonging to this category.
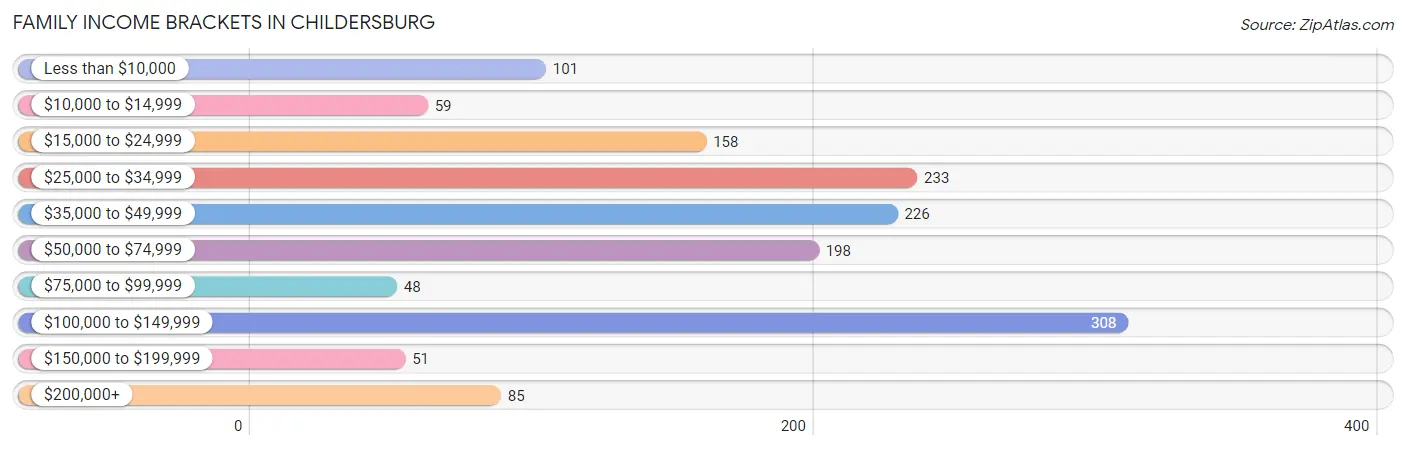
| Income Bracket | # Families | % Families |
| Less than $10,000 | 101 | 6.9% |
| $10,000 to $14,999 | 59 | 4.0% |
| $15,000 to $24,999 | 158 | 10.8% |
| $25,000 to $34,999 | 233 | 15.9% |
| $35,000 to $49,999 | 226 | 15.4% |
| $50,000 to $74,999 | 198 | 13.5% |
| $75,000 to $99,999 | 48 | 3.3% |
| $100,000 to $149,999 | 308 | 21.0% |
| $150,000 to $199,999 | 51 | 3.5% |
| $200,000+ | 85 | 5.8% |
Family Income by Famaliy Size in Childersburg
2-person families (874 | 59.7%) account for the highest median family income in Childersburg with $45,750 per family, while 2-person families (874 | 59.7%) have the highest median income of $22,875 per family member.
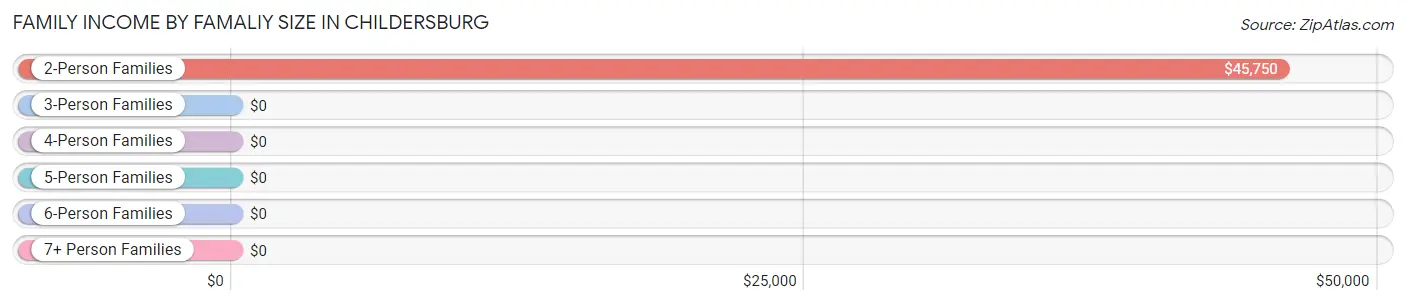
| Income Bracket | # Families | Median Income |
| 2-Person Families | 874 (59.7%) | $45,750 |
| 3-Person Families | 342 (23.3%) | $0 |
| 4-Person Families | 139 (9.5%) | $0 |
| 5-Person Families | 42 (2.9%) | $0 |
| 6-Person Families | 17 (1.2%) | $0 |
| 7+ Person Families | 51 (3.5%) | $0 |
| Total | 1,465 (100.0%) | $47,739 |
Family Income by Number of Earners in Childersburg
The median family income in Childersburg is $47,739, with families comprising 3+ earners (99) having the highest median family income of $250,001, while families with 1 earner (539) have the lowest median family income of $33,445, accounting for 6.8% and 36.8% of families, respectively.
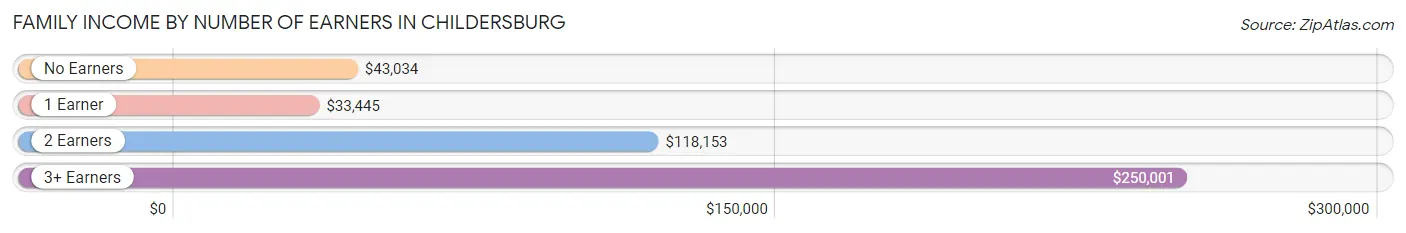
| Number of Earners | # Families | Median Income |
| No Earners | 436 (29.8%) | $43,034 |
| 1 Earner | 539 (36.8%) | $33,445 |
| 2 Earners | 391 (26.7%) | $118,153 |
| 3+ Earners | 99 (6.8%) | $250,001 |
| Total | 1,465 (100.0%) | $47,739 |
Household Income in Childersburg
Household Income Brackets in Childersburg
With 372 households falling in the category, the $35,000 to $49,999 income range is the most frequent in Childersburg, accounting for 18.5% of all households. In contrast, only 70 households (3.5%) fall into the $150,000 to $199,999 income bracket, making it the least populous group.
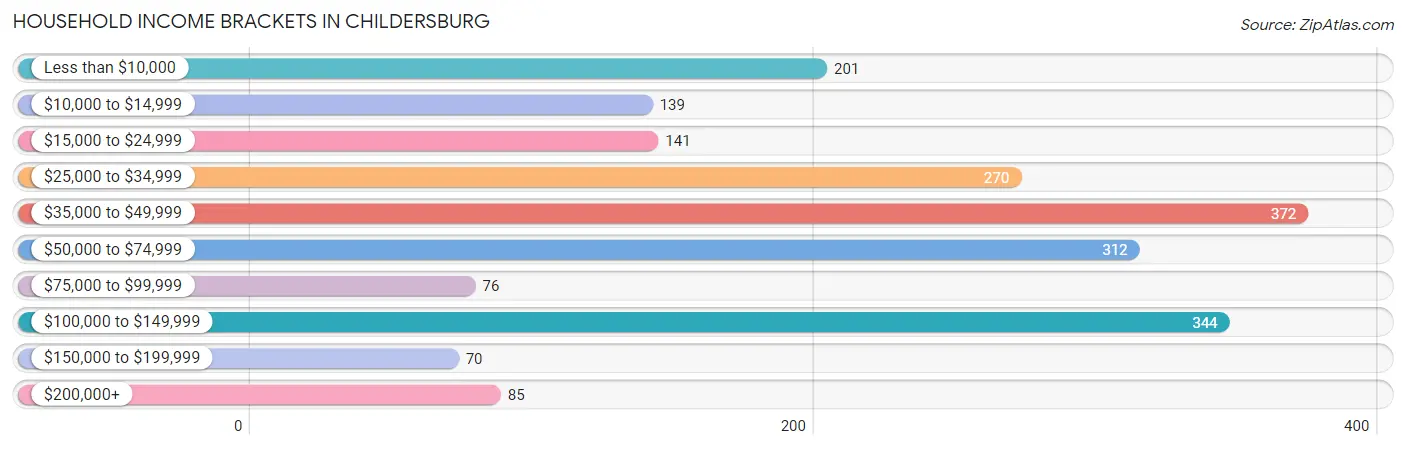
| Income Bracket | # Households | % Households |
| Less than $10,000 | 201 | 10.0% |
| $10,000 to $14,999 | 139 | 6.9% |
| $15,000 to $24,999 | 141 | 7.0% |
| $25,000 to $34,999 | 270 | 13.4% |
| $35,000 to $49,999 | 372 | 18.5% |
| $50,000 to $74,999 | 312 | 15.5% |
| $75,000 to $99,999 | 76 | 3.8% |
| $100,000 to $149,999 | 344 | 17.1% |
| $150,000 to $199,999 | 70 | 3.5% |
| $200,000+ | 85 | 4.2% |
Household Income by Householder Age in Childersburg
The median household income in Childersburg is $45,483, with the highest median household income of $54,821 found in the 45 to 64 years age bracket for the primary householder. A total of 787 households (39.1%) fall into this category. Meanwhile, the 15 to 24 years age bracket for the primary householder has the lowest median household income of $0, with 35 households (1.7%) in this group.
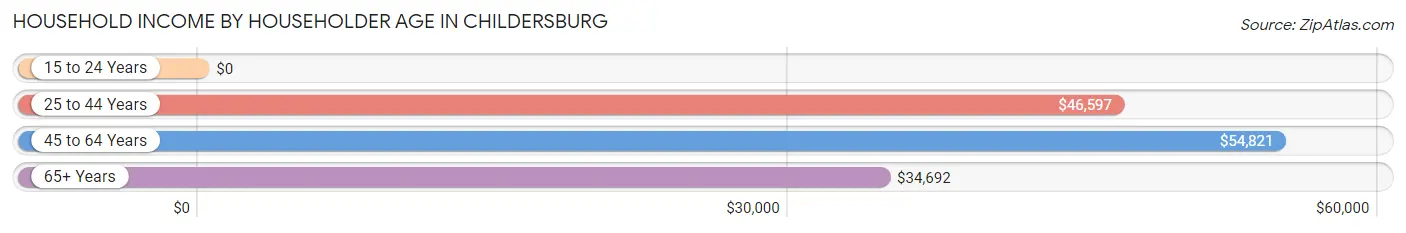
| Income Bracket | # Households | Median Income |
| 15 to 24 Years | 35 (1.7%) | $0 |
| 25 to 44 Years | 659 (32.8%) | $46,597 |
| 45 to 64 Years | 787 (39.1%) | $54,821 |
| 65+ Years | 531 (26.4%) | $34,692 |
| Total | 2,012 (100.0%) | $45,483 |
Poverty in Childersburg
Income Below Poverty by Sex and Age in Childersburg
With 18.5% poverty level for males and 15.5% for females among the residents of Childersburg, 16 and 17 year old males and 16 and 17 year old females are the most vulnerable to poverty, with 40 males (87.0%) and 34 females (66.7%) in their respective age groups living below the poverty level.
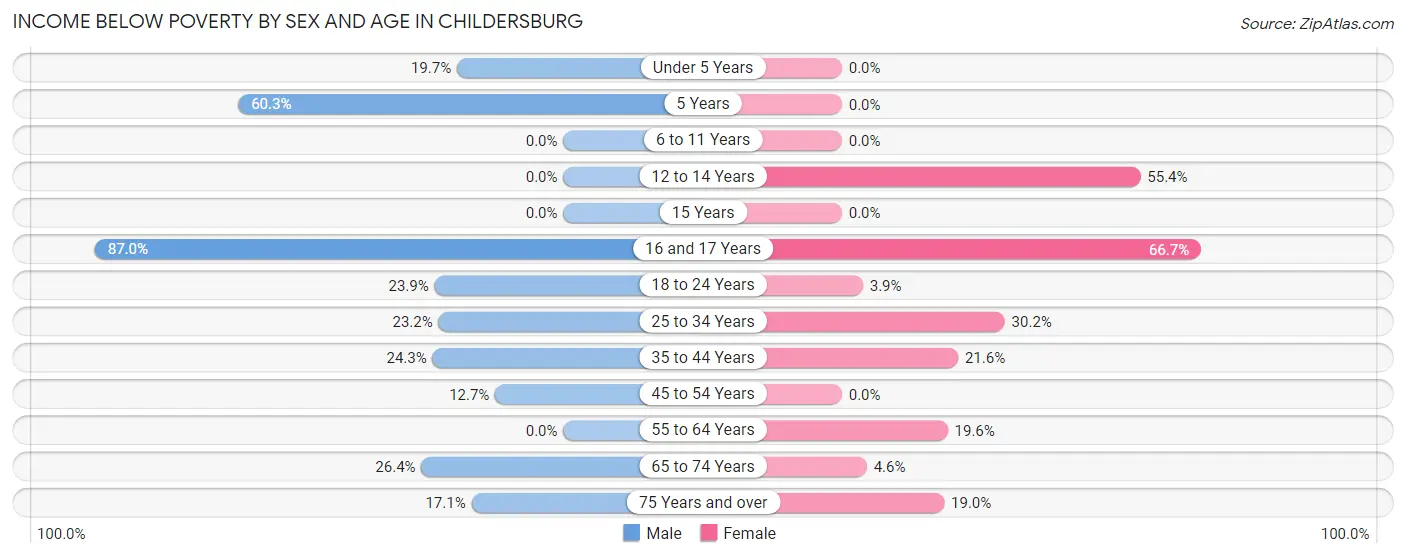
| Age Bracket | Male | Female |
| Under 5 Years | 46 (19.7%) | 0 (0.0%) |
| 5 Years | 70 (60.3%) | 0 (0.0%) |
| 6 to 11 Years | 0 (0.0%) | 0 (0.0%) |
| 12 to 14 Years | 0 (0.0%) | 46 (55.4%) |
| 15 Years | 0 (0.0%) | 0 (0.0%) |
| 16 and 17 Years | 40 (87.0%) | 34 (66.7%) |
| 18 to 24 Years | 55 (23.9%) | 10 (3.9%) |
| 25 to 34 Years | 57 (23.2%) | 78 (30.2%) |
| 35 to 44 Years | 67 (24.3%) | 88 (21.6%) |
| 45 to 54 Years | 42 (12.7%) | 0 (0.0%) |
| 55 to 64 Years | 0 (0.0%) | 54 (19.6%) |
| 65 to 74 Years | 44 (26.4%) | 19 (4.6%) |
| 75 Years and over | 30 (17.1%) | 30 (19.0%) |
| Total | 451 (18.5%) | 359 (15.5%) |
Income Above Poverty by Sex and Age in Childersburg
According to the poverty statistics in Childersburg, males aged 6 to 11 years and females aged under 5 years are the age groups that are most secure financially, with 100.0% of males and 100.0% of females in these age groups living above the poverty line.
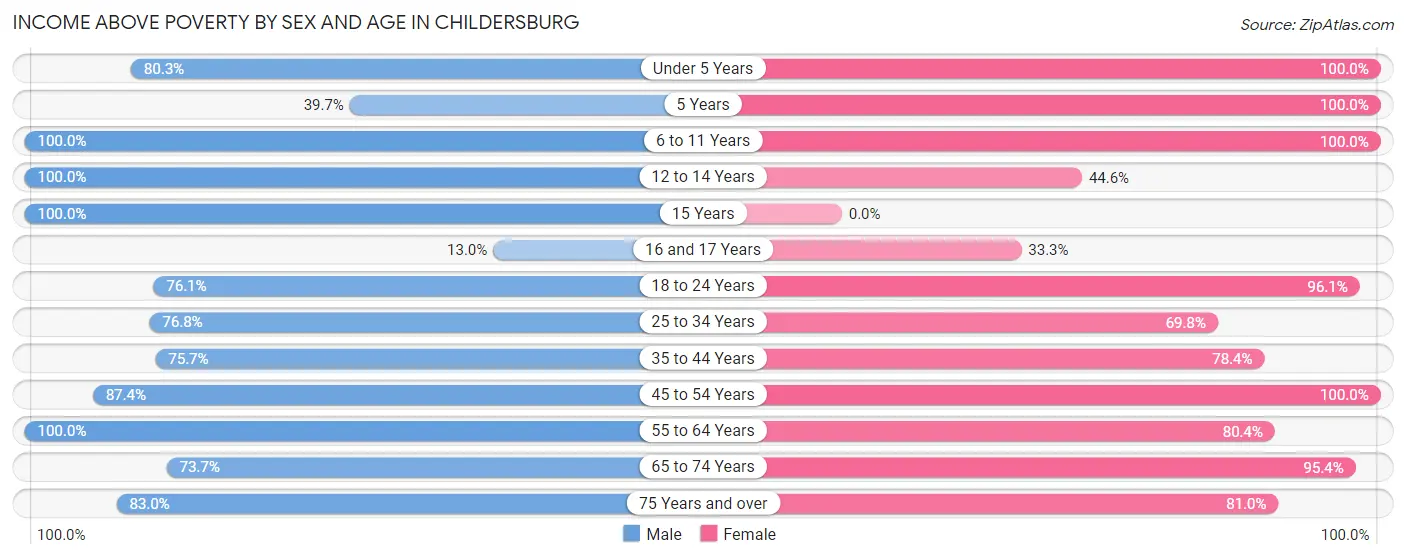
| Age Bracket | Male | Female |
| Under 5 Years | 187 (80.3%) | 100 (100.0%) |
| 5 Years | 46 (39.7%) | 67 (100.0%) |
| 6 to 11 Years | 176 (100.0%) | 75 (100.0%) |
| 12 to 14 Years | 91 (100.0%) | 37 (44.6%) |
| 15 Years | 1 (100.0%) | 0 (0.0%) |
| 16 and 17 Years | 6 (13.0%) | 17 (33.3%) |
| 18 to 24 Years | 175 (76.1%) | 247 (96.1%) |
| 25 to 34 Years | 189 (76.8%) | 180 (69.8%) |
| 35 to 44 Years | 209 (75.7%) | 320 (78.4%) |
| 45 to 54 Years | 290 (87.4%) | 169 (100.0%) |
| 55 to 64 Years | 342 (100.0%) | 221 (80.4%) |
| 65 to 74 Years | 123 (73.7%) | 391 (95.4%) |
| 75 Years and over | 146 (83.0%) | 128 (81.0%) |
| Total | 1,981 (81.5%) | 1,952 (84.5%) |
Income Below Poverty Among Married-Couple Families in Childersburg
The poverty statistics for married-couple families in Childersburg show that 2.2% or 21 of the total 945 families live below the poverty line. Families with no children have the highest poverty rate of 3.1%, comprising of 21 families. On the other hand, families with 1 or 2 children have the lowest poverty rate of 0.0%, which includes 0 families.
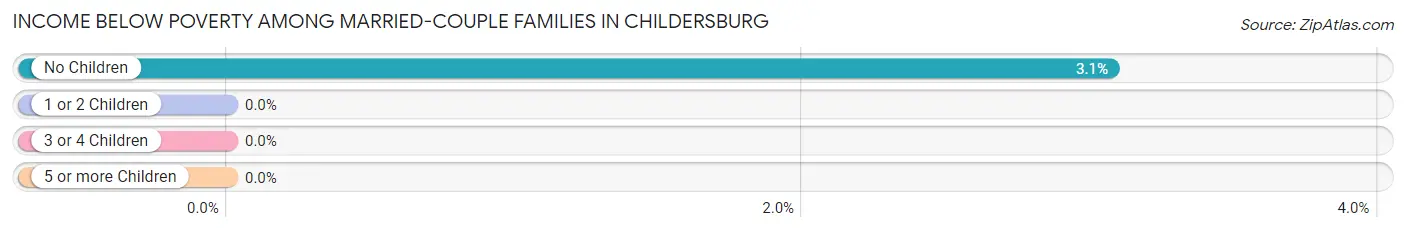
| Children | Above Poverty | Below Poverty |
| No Children | 663 (96.9%) | 21 (3.1%) |
| 1 or 2 Children | 261 (100.0%) | 0 (0.0%) |
| 3 or 4 Children | 0 (0.0%) | 0 (0.0%) |
| 5 or more Children | 0 (0.0%) | 0 (0.0%) |
| Total | 924 (97.8%) | 21 (2.2%) |
Income Below Poverty Among Single-Parent Households in Childersburg
According to the poverty data in Childersburg, 56.1% or 69 single-father households and 42.3% or 168 single-mother households are living below the poverty line. Among single-father households, those with no children have the highest poverty rate, with 69 households (56.1%) experiencing poverty. Likewise, among single-mother households, those with 1 or 2 children have the highest poverty rate, with 166 households (57.0%) falling below the poverty line.
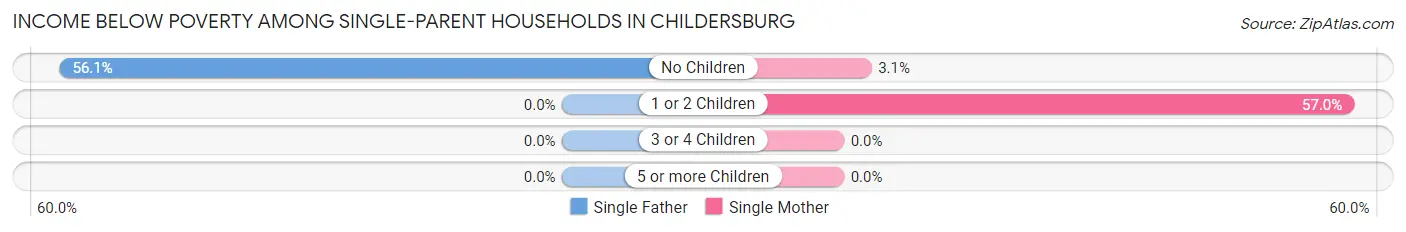
| Children | Single Father | Single Mother |
| No Children | 69 (56.1%) | 2 (3.1%) |
| 1 or 2 Children | 0 (0.0%) | 166 (57.0%) |
| 3 or 4 Children | 0 (0.0%) | 0 (0.0%) |
| 5 or more Children | 0 (0.0%) | 0 (0.0%) |
| Total | 69 (56.1%) | 168 (42.3%) |
Income Below Poverty Among Married-Couple vs Single-Parent Households in Childersburg
The poverty data for Childersburg shows that 21 of the married-couple family households (2.2%) and 237 of the single-parent households (45.6%) are living below the poverty level. Within the married-couple family households, those with no children have the highest poverty rate, with 21 households (3.1%) falling below the poverty line. Among the single-parent households, those with 1 or 2 children have the highest poverty rate, with 166 household (57.0%) living below poverty.
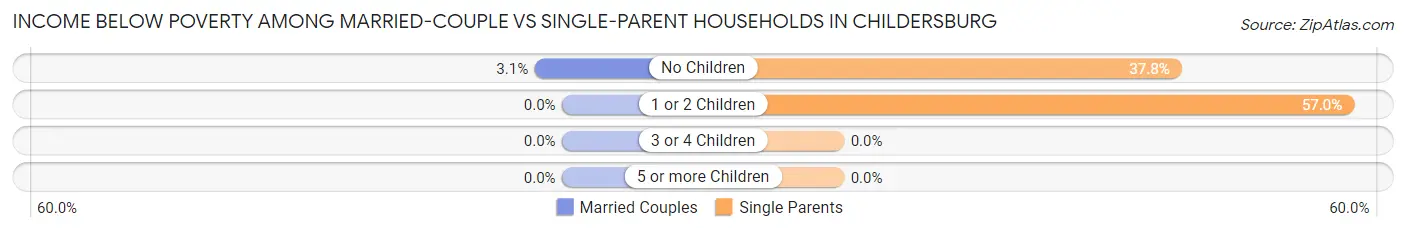
| Children | Married-Couple Families | Single-Parent Households |
| No Children | 21 (3.1%) | 71 (37.8%) |
| 1 or 2 Children | 0 (0.0%) | 166 (57.0%) |
| 3 or 4 Children | 0 (0.0%) | 0 (0.0%) |
| 5 or more Children | 0 (0.0%) | 0 (0.0%) |
| Total | 21 (2.2%) | 237 (45.6%) |
Race in Childersburg
The most populous races in Childersburg are White / Caucasian (2,721 | 57.4%), Black / African American (1,889 | 39.8%), and Asian (69 | 1.5%).
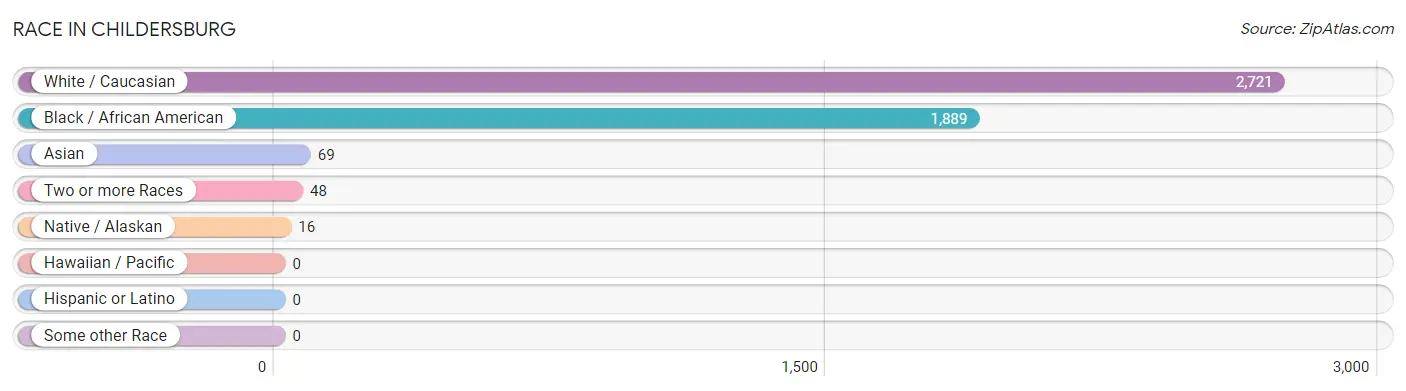
| Race | # Population | % Population |
| Asian | 69 | 1.5% |
| Black / African American | 1,889 | 39.8% |
| Hawaiian / Pacific | 0 | 0.0% |
| Hispanic or Latino | 0 | 0.0% |
| Native / Alaskan | 16 | 0.3% |
| White / Caucasian | 2,721 | 57.4% |
| Two or more Races | 48 | 1.0% |
| Some other Race | 0 | 0.0% |
| Total | 4,743 | 100.0% |
Ancestry in Childersburg
The most populous ancestries reported in Childersburg are American (492 | 10.4%), English (341 | 7.2%), Irish (267 | 5.6%), German (254 | 5.4%), and Scottish (96 | 2.0%), together accounting for 30.6% of all Childersburg residents.
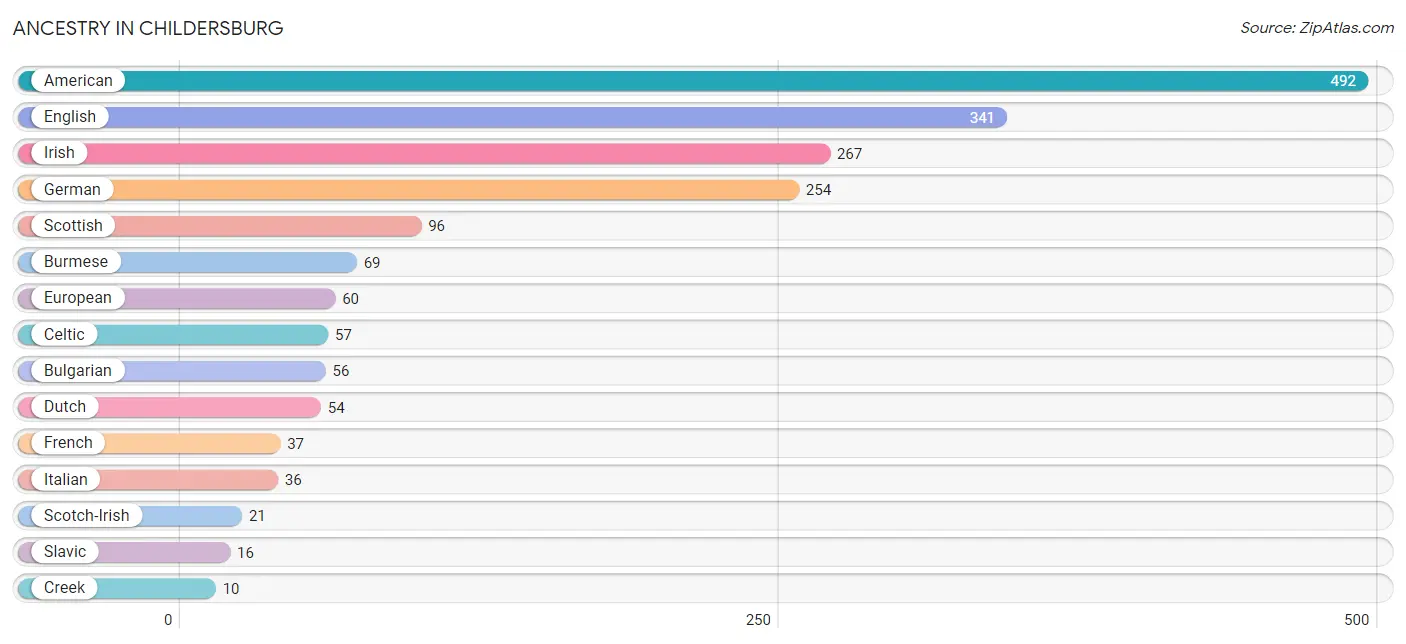
| Ancestry | # Population | % Population |
| American | 492 | 10.4% |
| Bulgarian | 56 | 1.2% |
| Burmese | 69 | 1.5% |
| Celtic | 57 | 1.2% |
| Creek | 10 | 0.2% |
| Dutch | 54 | 1.1% |
| English | 341 | 7.2% |
| European | 60 | 1.3% |
| French | 37 | 0.8% |
| German | 254 | 5.4% |
| Irish | 267 | 5.6% |
| Italian | 36 | 0.8% |
| Scotch-Irish | 21 | 0.4% |
| Scottish | 96 | 2.0% |
| Slavic | 16 | 0.3% | View All 15 Rows |
Immigrants in Childersburg
The most numerous immigrant groups reported in Childersburg came from Asia (69 | 1.5%), Eastern Asia (69 | 1.5%), and Korea (69 | 1.5%), together accounting for 4.4% of all Childersburg residents.
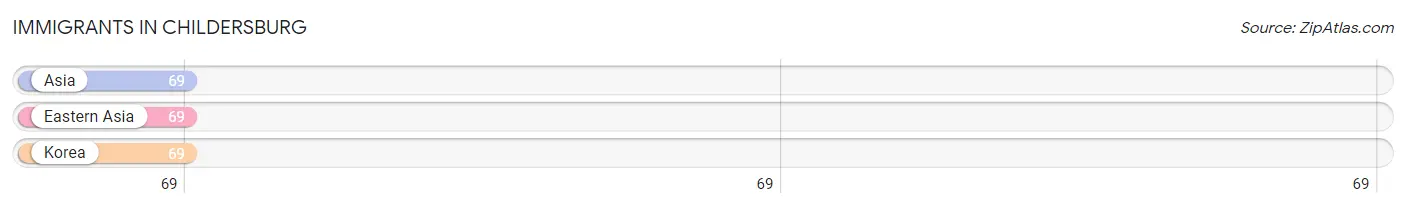
| Immigration Origin | # Population | % Population |
| Asia | 69 | 1.5% |
| Eastern Asia | 69 | 1.5% |
| Korea | 69 | 1.5% | View All 3 Rows |
Sex and Age in Childersburg
Sex and Age in Childersburg
The most populous age groups in Childersburg are 5 to 9 Years (261 | 10.7%) for men and 40 to 44 Years (301 | 13.0%) for women.
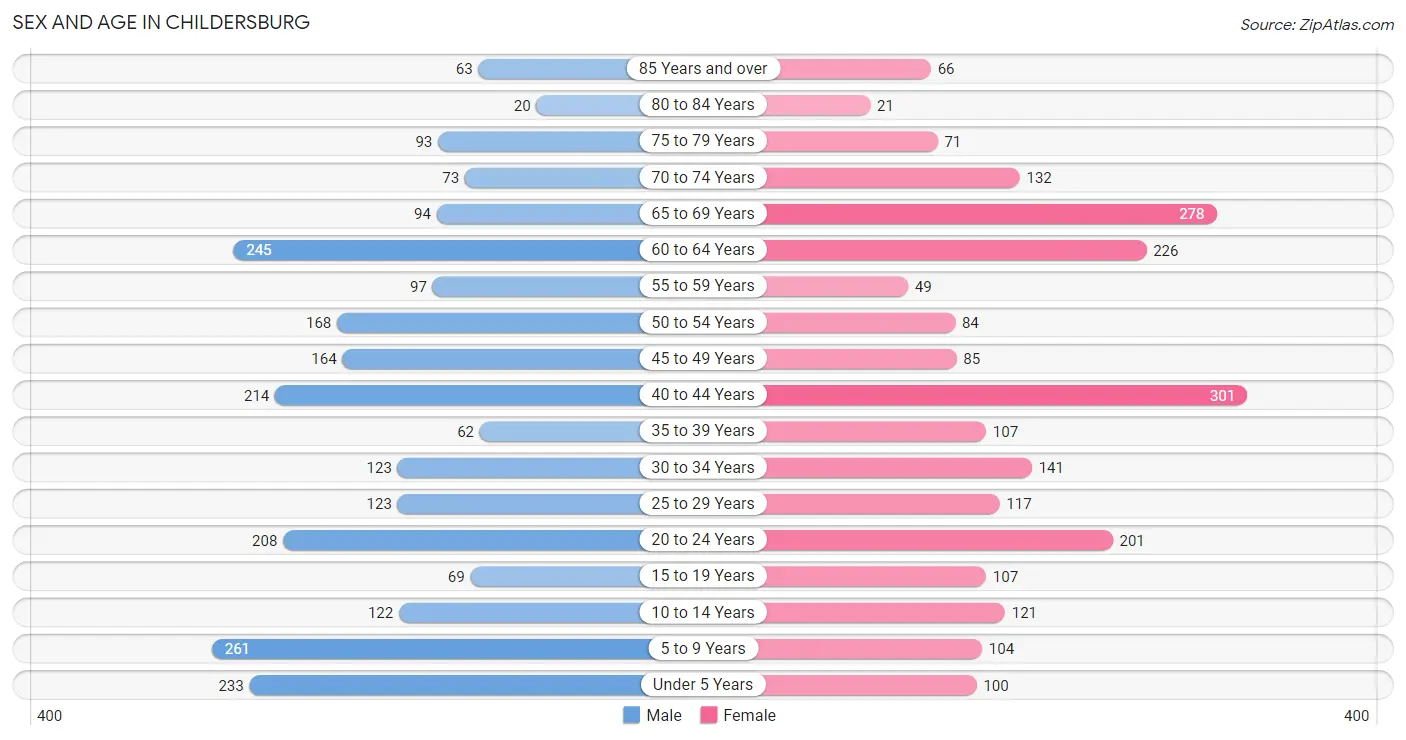
| Age Bracket | Male | Female |
| Under 5 Years | 233 (9.6%) | 100 (4.3%) |
| 5 to 9 Years | 261 (10.7%) | 104 (4.5%) |
| 10 to 14 Years | 122 (5.0%) | 121 (5.2%) |
| 15 to 19 Years | 69 (2.8%) | 107 (4.6%) |
| 20 to 24 Years | 208 (8.6%) | 201 (8.7%) |
| 25 to 29 Years | 123 (5.1%) | 117 (5.1%) |
| 30 to 34 Years | 123 (5.1%) | 141 (6.1%) |
| 35 to 39 Years | 62 (2.5%) | 107 (4.6%) |
| 40 to 44 Years | 214 (8.8%) | 301 (13.0%) |
| 45 to 49 Years | 164 (6.7%) | 85 (3.7%) |
| 50 to 54 Years | 168 (6.9%) | 84 (3.6%) |
| 55 to 59 Years | 97 (4.0%) | 49 (2.1%) |
| 60 to 64 Years | 245 (10.1%) | 226 (9.8%) |
| 65 to 69 Years | 94 (3.9%) | 278 (12.0%) |
| 70 to 74 Years | 73 (3.0%) | 132 (5.7%) |
| 75 to 79 Years | 93 (3.8%) | 71 (3.1%) |
| 80 to 84 Years | 20 (0.8%) | 21 (0.9%) |
| 85 Years and over | 63 (2.6%) | 66 (2.9%) |
| Total | 2,432 (100.0%) | 2,311 (100.0%) |
Families and Households in Childersburg
Median Family Size in Childersburg
The median family size in Childersburg is 2.81 persons per family, with married-couple families (945 | 64.5%) accounting for the largest median family size of 2.9 persons per family. On the other hand, single male/father families (123 | 8.4%) represent the smallest median family size with 2.08 persons per family.
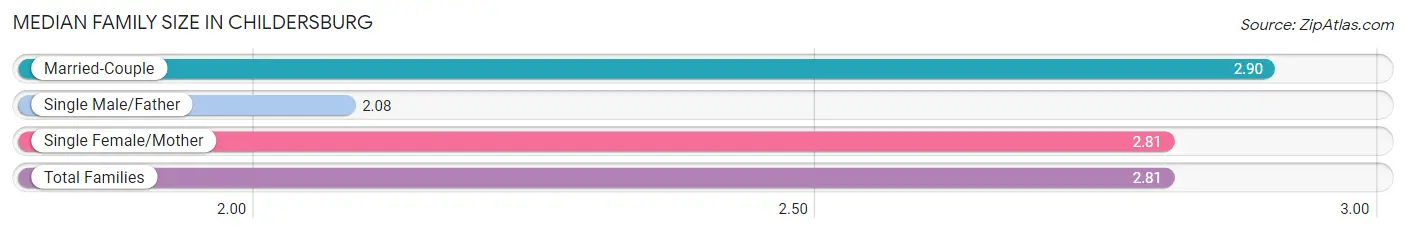
| Family Type | # Families | Family Size |
| Married-Couple | 945 (64.5%) | 2.90 |
| Single Male/Father | 123 (8.4%) | 2.08 |
| Single Female/Mother | 397 (27.1%) | 2.81 |
| Total Families | 1,465 (100.0%) | 2.81 |
Median Household Size in Childersburg
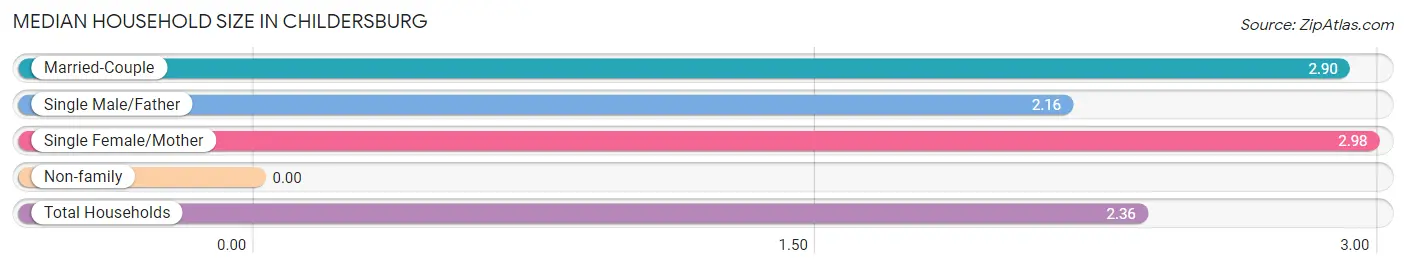
| Household Type | # Households | Household Size |
| Married-Couple | 945 (47.0%) | 2.90 |
| Single Male/Father | 123 (6.1%) | 2.16 |
| Single Female/Mother | 397 (19.7%) | 2.98 |
| Non-family | 547 (27.2%) | - |
| Total Households | 2,012 (100.0%) | 2.36 |
Household Size by Marriage Status in Childersburg
Out of a total of 2,012 households in Childersburg, 1,465 (72.8%) are family households, while 547 (27.2%) are nonfamily households. The most numerous type of family households are 2-person households, comprising 834, and the most common type of nonfamily households are 1-person households, comprising 547.
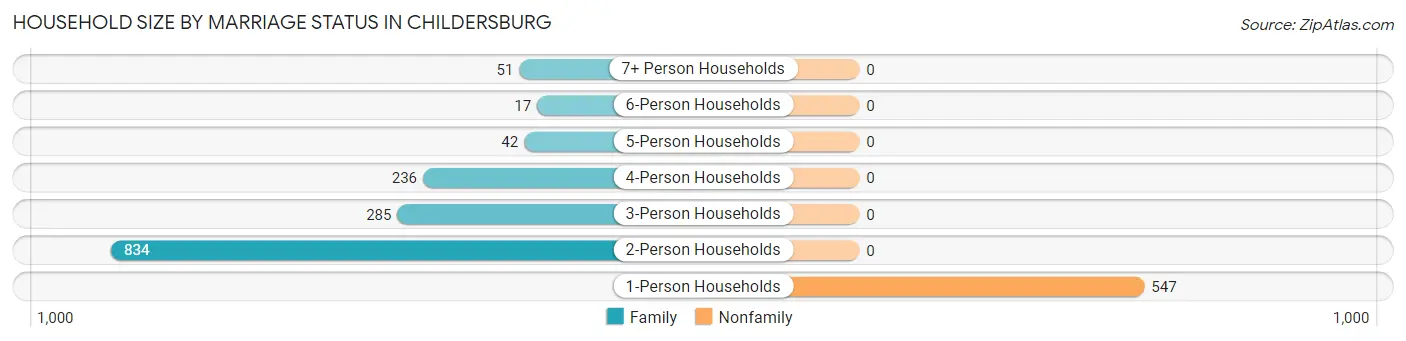
| Household Size | Family Households | Nonfamily Households |
| 1-Person Households | - | 547 (27.2%) |
| 2-Person Households | 834 (41.4%) | 0 (0.0%) |
| 3-Person Households | 285 (14.2%) | 0 (0.0%) |
| 4-Person Households | 236 (11.7%) | 0 (0.0%) |
| 5-Person Households | 42 (2.1%) | 0 (0.0%) |
| 6-Person Households | 17 (0.8%) | 0 (0.0%) |
| 7+ Person Households | 51 (2.5%) | 0 (0.0%) |
| Total | 1,465 (72.8%) | 547 (27.2%) |
Female Fertility in Childersburg
Fertility by Age in Childersburg
Average fertility rate in Childersburg is 72.0 births per 1,000 women. Women in the age bracket of 20 to 34 years have the highest fertility rate with 166.0 births per 1,000 women. Women in the age bracket of 20 to 34 years acount for 100.0% of all women with births.
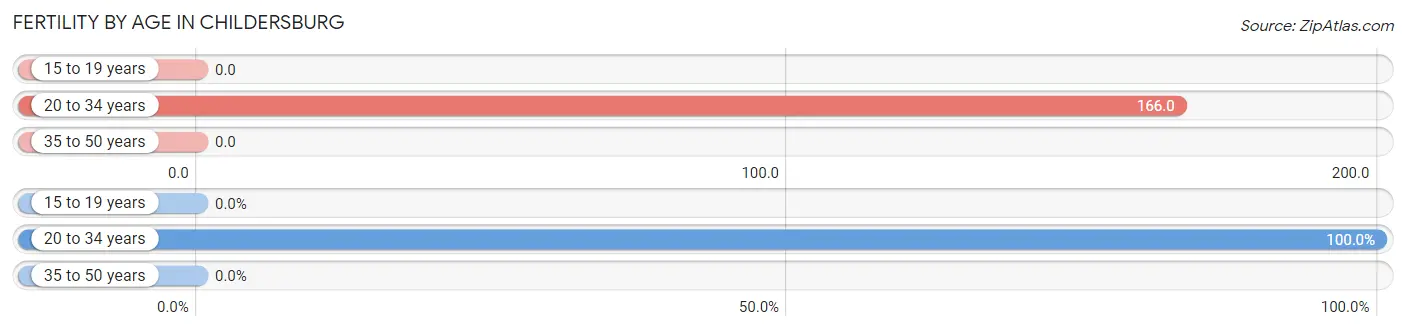
| Age Bracket | Women with Births | Births / 1,000 Women |
| 15 to 19 years | 0 (0.0%) | 0.0 |
| 20 to 34 years | 76 (100.0%) | 166.0 |
| 35 to 50 years | 0 (0.0%) | 0.0 |
| Total | 76 (100.0%) | 72.0 |
Fertility by Age by Marriage Status in Childersburg
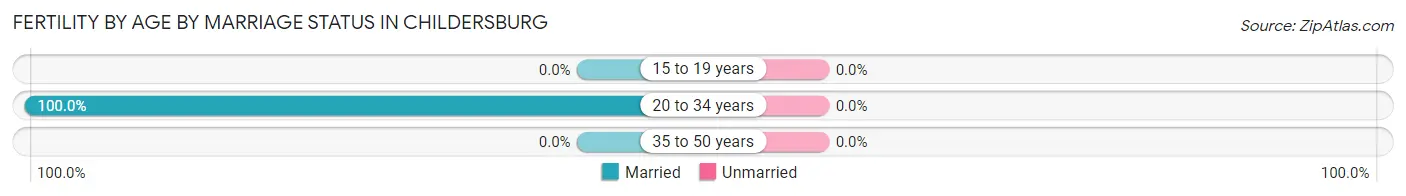
| Age Bracket | Married | Unmarried |
| 15 to 19 years | 0 (0.0%) | 0 (0.0%) |
| 20 to 34 years | 76 (100.0%) | 0 (0.0%) |
| 35 to 50 years | 0 (0.0%) | 0 (0.0%) |
| Total | 76 (100.0%) | 0 (0.0%) |
Fertility by Education in Childersburg
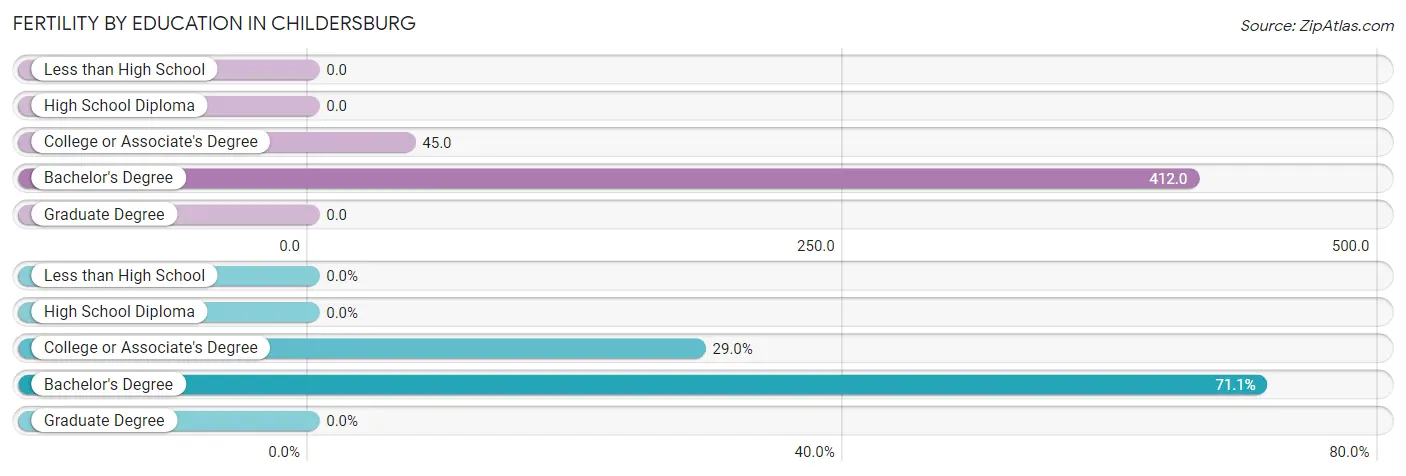
| Educational Attainment | Women with Births | Births / 1,000 Women |
| Less than High School | 0 (0.0%) | 0.0 |
| High School Diploma | 0 (0.0%) | 0.0 |
| College or Associate's Degree | 22 (28.9%) | 45.0 |
| Bachelor's Degree | 54 (71.1%) | 412.0 |
| Graduate Degree | 0 (0.0%) | 0.0 |
| Total | 76 (100.0%) | 72.0 |
Fertility by Education by Marriage Status in Childersburg
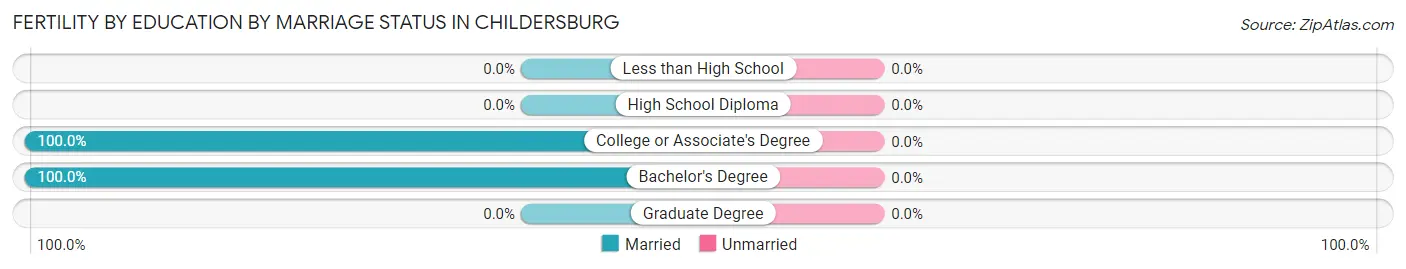
| Educational Attainment | Married | Unmarried |
| Less than High School | 0 (0.0%) | 0 (0.0%) |
| High School Diploma | 0 (0.0%) | 0 (0.0%) |
| College or Associate's Degree | 22 (100.0%) | 0 (0.0%) |
| Bachelor's Degree | 54 (100.0%) | 0 (0.0%) |
| Graduate Degree | 0 (0.0%) | 0 (0.0%) |
| Total | 76 (100.0%) | 0 (0.0%) |
Employment Characteristics in Childersburg
Employment by Class of Employer in Childersburg
Among the 1,916 employed individuals in Childersburg, private company employees (1,574 | 82.2%), local government employees (117 | 6.1%), and federal government employees (82 | 4.3%) make up the most common classes of employment.
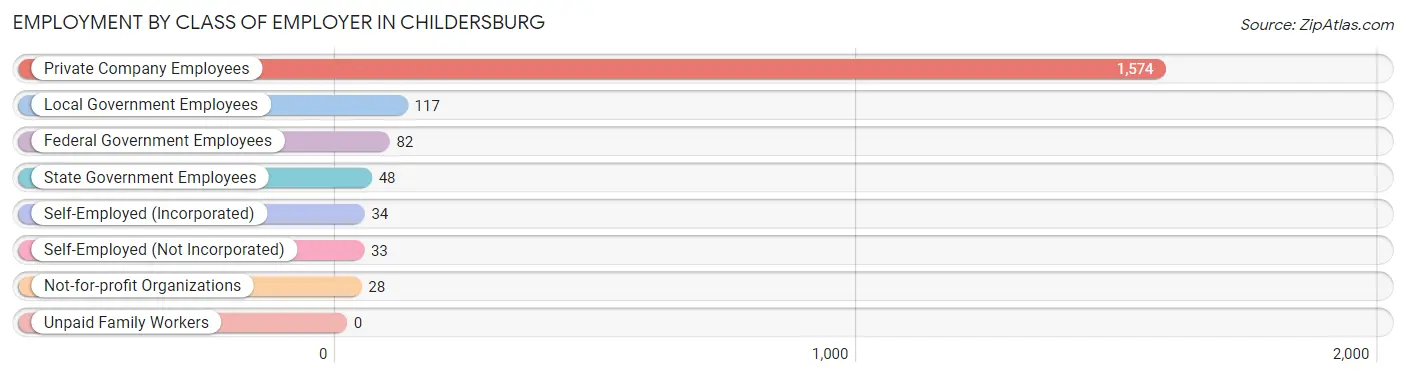
| Employer Class | # Employees | % Employees |
| Private Company Employees | 1,574 | 82.2% |
| Self-Employed (Incorporated) | 34 | 1.8% |
| Self-Employed (Not Incorporated) | 33 | 1.7% |
| Not-for-profit Organizations | 28 | 1.5% |
| Local Government Employees | 117 | 6.1% |
| State Government Employees | 48 | 2.5% |
| Federal Government Employees | 82 | 4.3% |
| Unpaid Family Workers | 0 | 0.0% |
| Total | 1,916 | 100.0% |
Employment Status by Age in Childersburg
According to the labor force statistics for Childersburg, out of the total population over 16 years of age (3,801), 55.9% or 2,125 individuals are in the labor force, with 8.2% or 174 of them unemployed. The age group with the highest labor force participation rate is 25 to 29 years, with 100.0% or 240 individuals in the labor force. Within the labor force, the 16 to 19 years age range has the highest percentage of unemployed individuals, with 28.4% or 23 of them being unemployed.
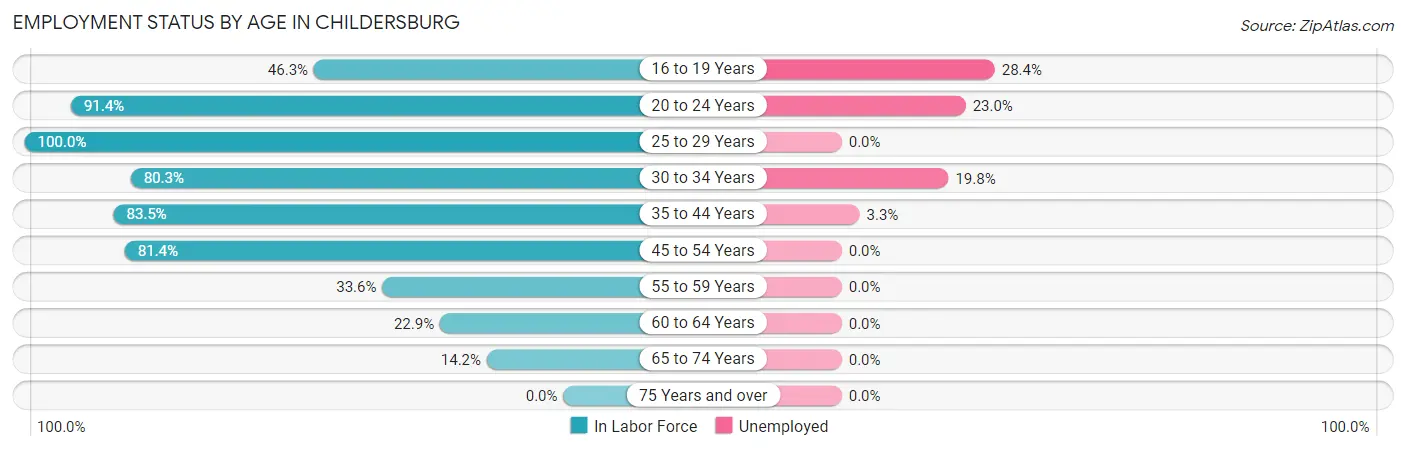
| Age Bracket | In Labor Force | Unemployed |
| 16 to 19 Years | 81 (46.3%) | 23 (28.4%) |
| 20 to 24 Years | 374 (91.4%) | 86 (23.0%) |
| 25 to 29 Years | 240 (100.0%) | 0 (0.0%) |
| 30 to 34 Years | 212 (80.3%) | 42 (19.8%) |
| 35 to 44 Years | 571 (83.5%) | 19 (3.3%) |
| 45 to 54 Years | 408 (81.4%) | 0 (0.0%) |
| 55 to 59 Years | 49 (33.6%) | 0 (0.0%) |
| 60 to 64 Years | 108 (22.9%) | 0 (0.0%) |
| 65 to 74 Years | 82 (14.2%) | 0 (0.0%) |
| 75 Years and over | 0 (0.0%) | 0 (0.0%) |
| Total | 2,125 (55.9%) | 174 (8.2%) |
Employment Status by Educational Attainment in Childersburg
According to labor force statistics for Childersburg, 68.9% of individuals (1,589) out of the total population between 25 and 64 years of age (2,306) are in the labor force, with 4.0% or 64 of them being unemployed. The group with the highest labor force participation rate are those with the educational attainment of bachelor's degree or higher, with 94.0% or 268 individuals in the labor force. Within the labor force, individuals with bachelor's degree or higher education have the highest percentage of unemployment, with 7.1% or 19 of them being unemployed.
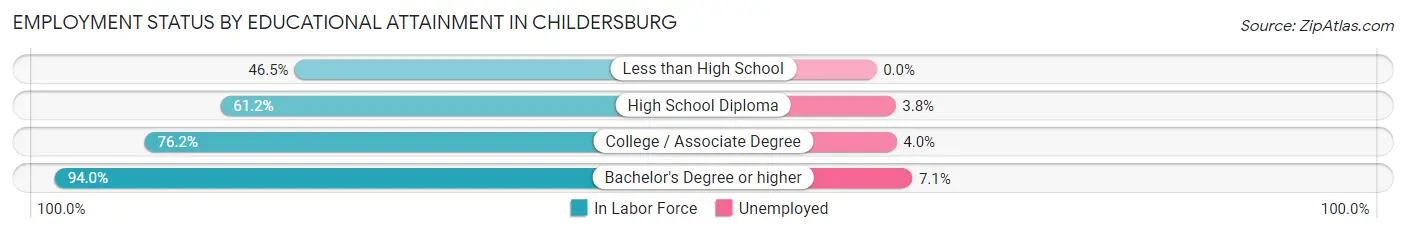
| Educational Attainment | In Labor Force | Unemployed |
| Less than High School | 192 (46.5%) | 0 (0.0%) |
| High School Diploma | 396 (61.2%) | 25 (3.8%) |
| College / Associate Degree | 732 (76.2%) | 38 (4.0%) |
| Bachelor's Degree or higher | 268 (94.0%) | 20 (7.1%) |
| Total | 1,589 (68.9%) | 92 (4.0%) |
Employment Occupations by Sex in Childersburg
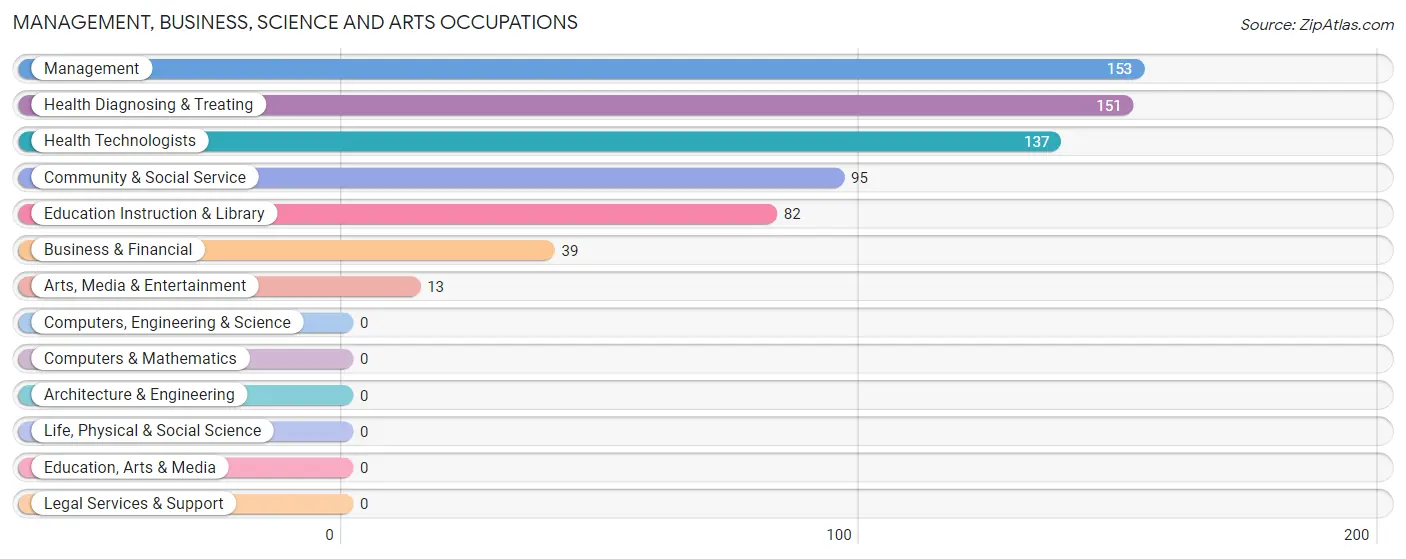
Management, Business, Science and Arts Occupations
The most common Management, Business, Science and Arts occupations in Childersburg are Management (153 | 8.1%), Health Diagnosing & Treating (151 | 8.0%), Health Technologists (137 | 7.2%), Community & Social Service (95 | 5.0%), and Education Instruction & Library (82 | 4.3%).
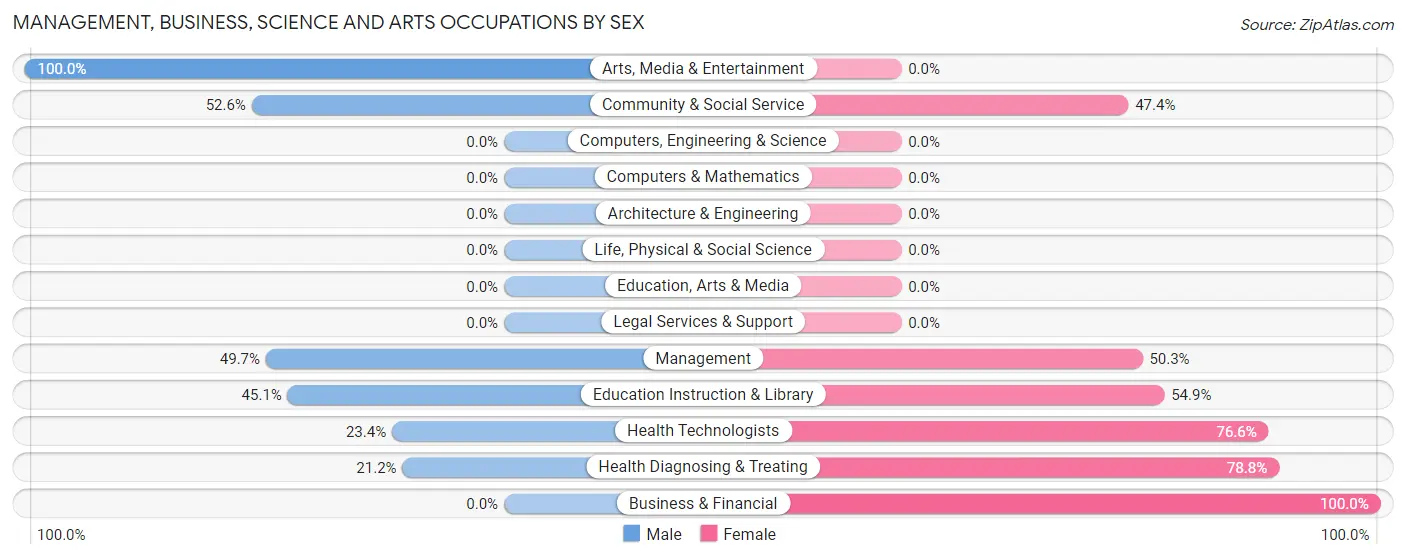
Management, Business, Science and Arts Occupations by Sex
Within the Management, Business, Science and Arts occupations in Childersburg, the most male-oriented occupations are Arts, Media & Entertainment (100.0%), Community & Social Service (52.6%), and Management (49.7%), while the most female-oriented occupations are Business & Financial (100.0%), Health Diagnosing & Treating (78.8%), and Health Technologists (76.6%).
| Occupation | Male | Female |
| Management | 76 (49.7%) | 77 (50.3%) |
| Business & Financial | 0 (0.0%) | 39 (100.0%) |
| Computers, Engineering & Science | 0 (0.0%) | 0 (0.0%) |
| Computers & Mathematics | 0 (0.0%) | 0 (0.0%) |
| Architecture & Engineering | 0 (0.0%) | 0 (0.0%) |
| Life, Physical & Social Science | 0 (0.0%) | 0 (0.0%) |
| Community & Social Service | 50 (52.6%) | 45 (47.4%) |
| Education, Arts & Media | 0 (0.0%) | 0 (0.0%) |
| Legal Services & Support | 0 (0.0%) | 0 (0.0%) |
| Education Instruction & Library | 37 (45.1%) | 45 (54.9%) |
| Arts, Media & Entertainment | 13 (100.0%) | 0 (0.0%) |
| Health Diagnosing & Treating | 32 (21.2%) | 119 (78.8%) |
| Health Technologists | 32 (23.4%) | 105 (76.6%) |
| Total (Category) | 158 (36.1%) | 280 (63.9%) |
| Total (Overall) | 916 (48.2%) | 983 (51.8%) |
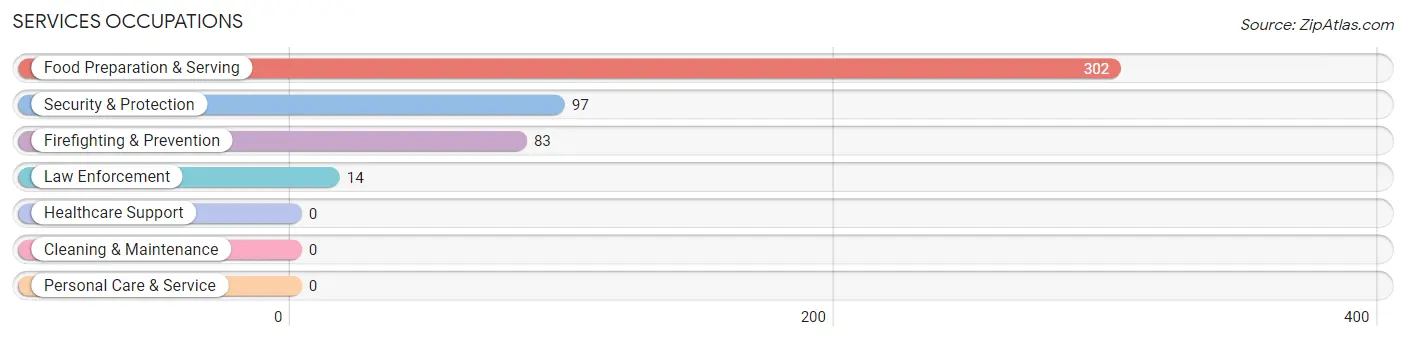
Services Occupations
The most common Services occupations in Childersburg are Food Preparation & Serving (302 | 15.9%), Security & Protection (97 | 5.1%), Firefighting & Prevention (83 | 4.4%), and Law Enforcement (14 | 0.7%).
Services Occupations by Sex
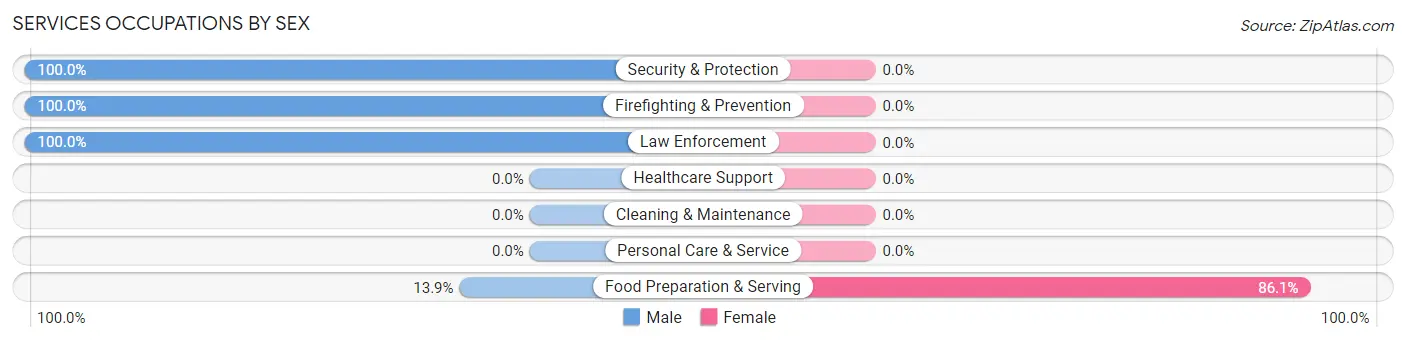
| Occupation | Male | Female |
| Healthcare Support | 0 (0.0%) | 0 (0.0%) |
| Security & Protection | 97 (100.0%) | 0 (0.0%) |
| Firefighting & Prevention | 83 (100.0%) | 0 (0.0%) |
| Law Enforcement | 14 (100.0%) | 0 (0.0%) |
| Food Preparation & Serving | 42 (13.9%) | 260 (86.1%) |
| Cleaning & Maintenance | 0 (0.0%) | 0 (0.0%) |
| Personal Care & Service | 0 (0.0%) | 0 (0.0%) |
| Total (Category) | 139 (34.8%) | 260 (65.2%) |
| Total (Overall) | 916 (48.2%) | 983 (51.8%) |
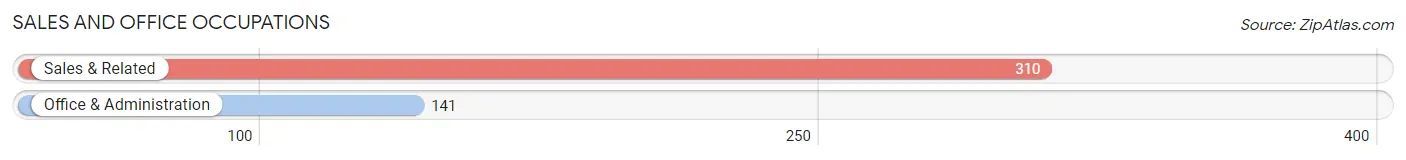
Sales and Office Occupations
The most common Sales and Office occupations in Childersburg are Sales & Related (310 | 16.3%), and Office & Administration (141 | 7.4%).
Sales and Office Occupations by Sex
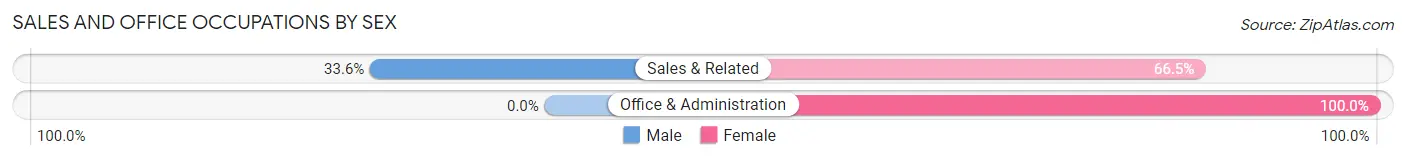
| Occupation | Male | Female |
| Sales & Related | 104 (33.6%) | 206 (66.4%) |
| Office & Administration | 0 (0.0%) | 141 (100.0%) |
| Total (Category) | 104 (23.1%) | 347 (76.9%) |
| Total (Overall) | 916 (48.2%) | 983 (51.8%) |
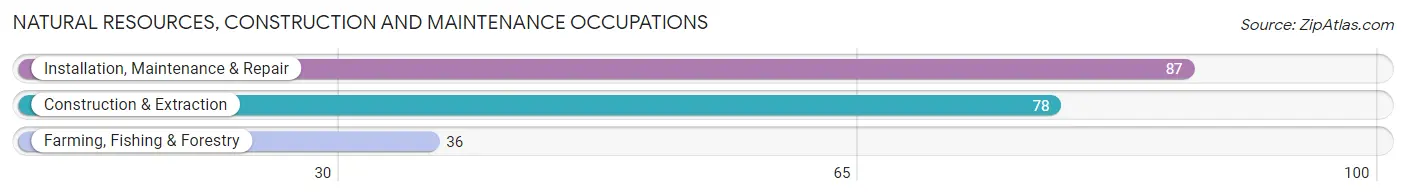
Natural Resources, Construction and Maintenance Occupations
The most common Natural Resources, Construction and Maintenance occupations in Childersburg are Installation, Maintenance & Repair (87 | 4.6%), Construction & Extraction (78 | 4.1%), and Farming, Fishing & Forestry (36 | 1.9%).
Natural Resources, Construction and Maintenance Occupations by Sex
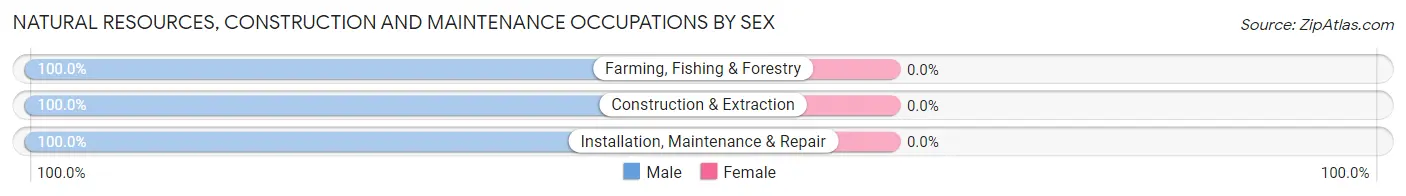
| Occupation | Male | Female |
| Farming, Fishing & Forestry | 36 (100.0%) | 0 (0.0%) |
| Construction & Extraction | 78 (100.0%) | 0 (0.0%) |
| Installation, Maintenance & Repair | 87 (100.0%) | 0 (0.0%) |
| Total (Category) | 201 (100.0%) | 0 (0.0%) |
| Total (Overall) | 916 (48.2%) | 983 (51.8%) |
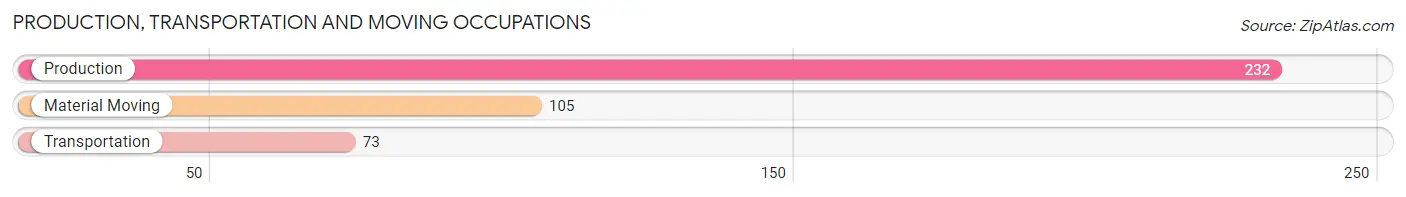
Production, Transportation and Moving Occupations
The most common Production, Transportation and Moving occupations in Childersburg are Production (232 | 12.2%), Material Moving (105 | 5.5%), and Transportation (73 | 3.8%).
Production, Transportation and Moving Occupations by Sex
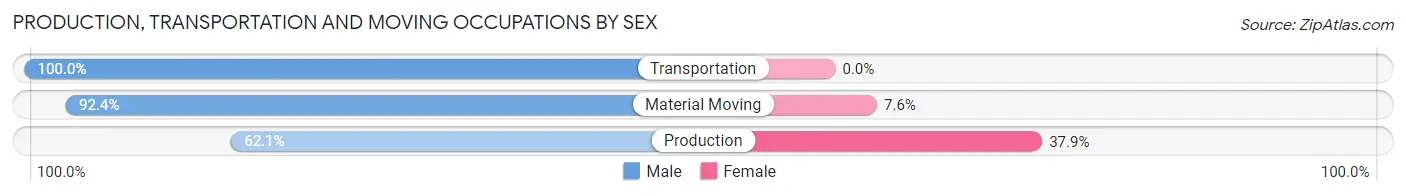
| Occupation | Male | Female |
| Production | 144 (62.1%) | 88 (37.9%) |
| Transportation | 73 (100.0%) | 0 (0.0%) |
| Material Moving | 97 (92.4%) | 8 (7.6%) |
| Total (Category) | 314 (76.6%) | 96 (23.4%) |
| Total (Overall) | 916 (48.2%) | 983 (51.8%) |
Employment Industries by Sex in Childersburg
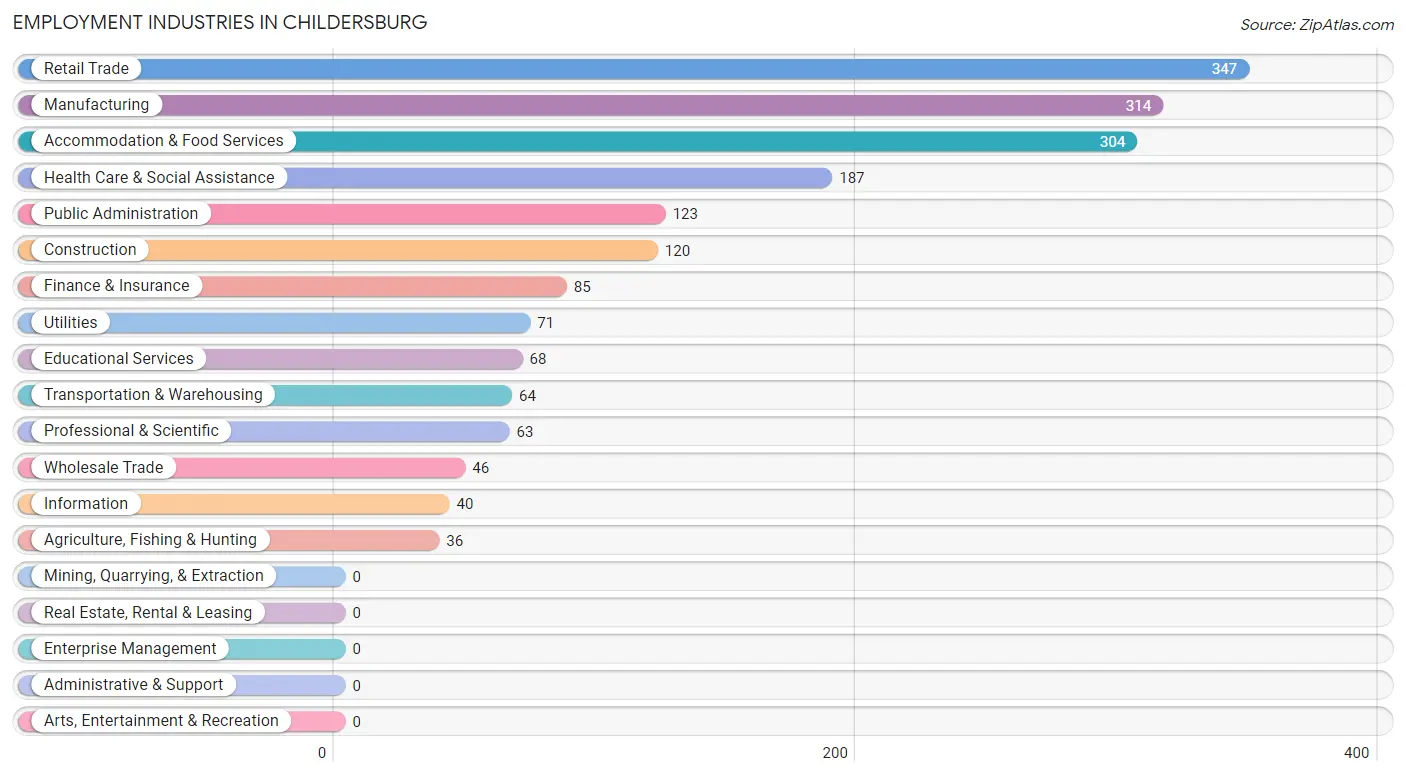
Employment Industries in Childersburg
The major employment industries in Childersburg include Retail Trade (347 | 18.3%), Manufacturing (314 | 16.5%), Accommodation & Food Services (304 | 16.0%), Health Care & Social Assistance (187 | 9.9%), and Public Administration (123 | 6.5%).
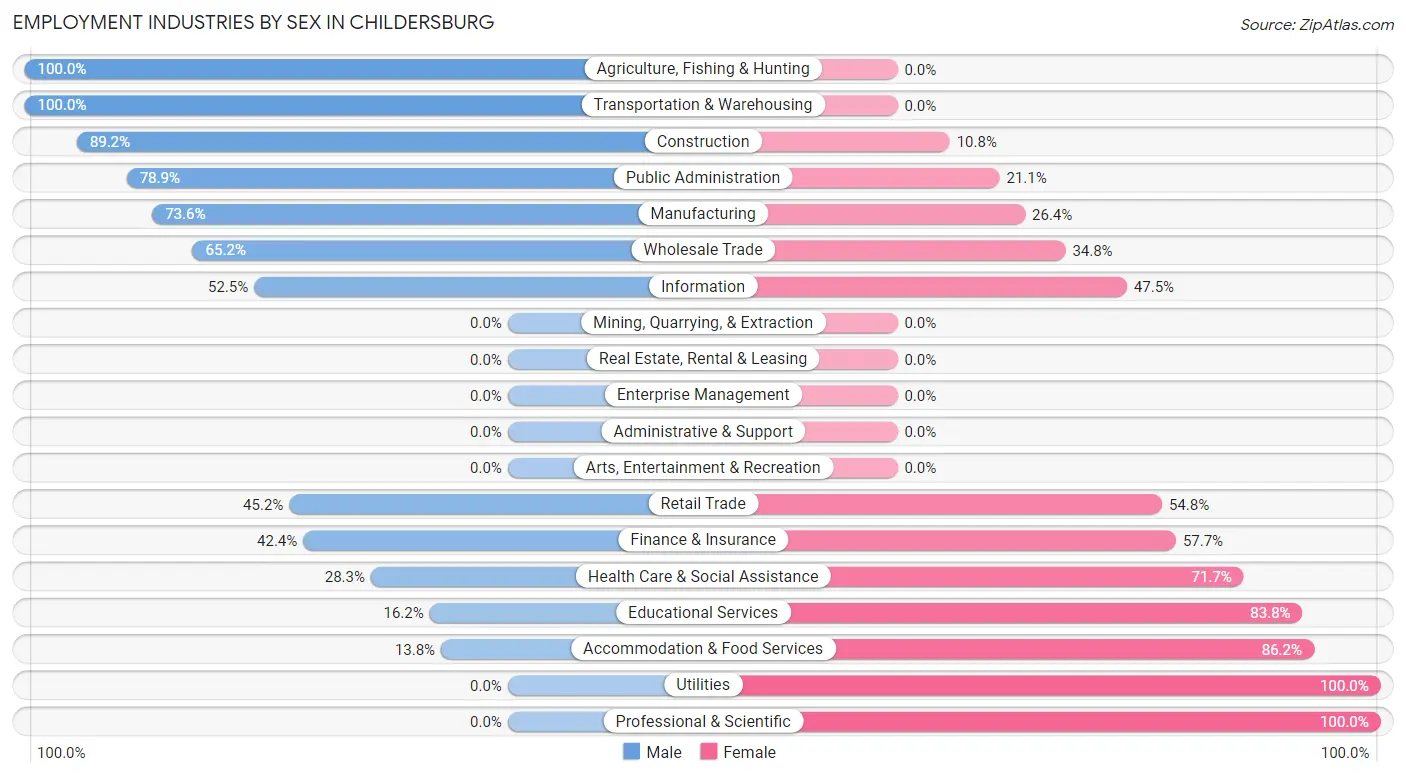
Employment Industries by Sex in Childersburg
The Childersburg industries that see more men than women are Agriculture, Fishing & Hunting (100.0%), Transportation & Warehousing (100.0%), and Construction (89.2%), whereas the industries that tend to have a higher number of women are Utilities (100.0%), Professional & Scientific (100.0%), and Accommodation & Food Services (86.2%).
| Industry | Male | Female |
| Agriculture, Fishing & Hunting | 36 (100.0%) | 0 (0.0%) |
| Mining, Quarrying, & Extraction | 0 (0.0%) | 0 (0.0%) |
| Construction | 107 (89.2%) | 13 (10.8%) |
| Manufacturing | 231 (73.6%) | 83 (26.4%) |
| Wholesale Trade | 30 (65.2%) | 16 (34.8%) |
| Retail Trade | 157 (45.2%) | 190 (54.8%) |
| Transportation & Warehousing | 64 (100.0%) | 0 (0.0%) |
| Utilities | 0 (0.0%) | 71 (100.0%) |
| Information | 21 (52.5%) | 19 (47.5%) |
| Finance & Insurance | 36 (42.3%) | 49 (57.7%) |
| Real Estate, Rental & Leasing | 0 (0.0%) | 0 (0.0%) |
| Professional & Scientific | 0 (0.0%) | 63 (100.0%) |
| Enterprise Management | 0 (0.0%) | 0 (0.0%) |
| Administrative & Support | 0 (0.0%) | 0 (0.0%) |
| Educational Services | 11 (16.2%) | 57 (83.8%) |
| Health Care & Social Assistance | 53 (28.3%) | 134 (71.7%) |
| Arts, Entertainment & Recreation | 0 (0.0%) | 0 (0.0%) |
| Accommodation & Food Services | 42 (13.8%) | 262 (86.2%) |
| Public Administration | 97 (78.9%) | 26 (21.1%) |
| Total | 916 (48.2%) | 983 (51.8%) |
Education in Childersburg
School Enrollment in Childersburg
The most common levels of schooling among the 874 students in Childersburg are elementary school (220 | 25.2%), middle school (205 | 23.5%), and kindergarten (127 | 14.5%).
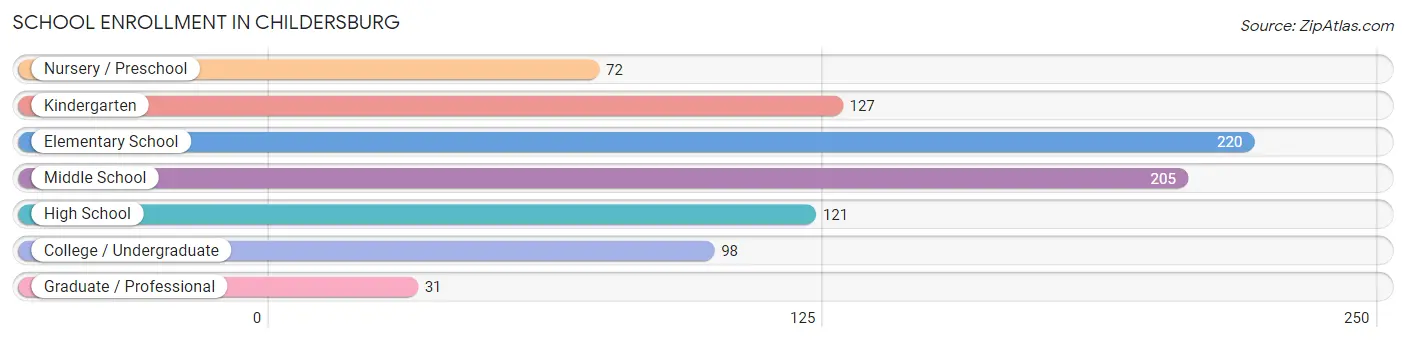
| School Level | # Students | % Students |
| Nursery / Preschool | 72 | 8.2% |
| Kindergarten | 127 | 14.5% |
| Elementary School | 220 | 25.2% |
| Middle School | 205 | 23.5% |
| High School | 121 | 13.8% |
| College / Undergraduate | 98 | 11.2% |
| Graduate / Professional | 31 | 3.5% |
| Total | 874 | 100.0% |
School Enrollment by Age by Funding Source in Childersburg
Out of a total of 874 students who are enrolled in schools in Childersburg, 17 (1.9%) attend a private institution, while the remaining 857 (98.1%) are enrolled in public schools. The age group of 15 to 17 year olds has the highest likelihood of being enrolled in private schools, with 17 (26.6% in the age bracket) enrolled. Conversely, the age group of 3 to 4 year olds has the lowest likelihood of being enrolled in a private school, with 26 (100.0% in the age bracket) attending a public institution.
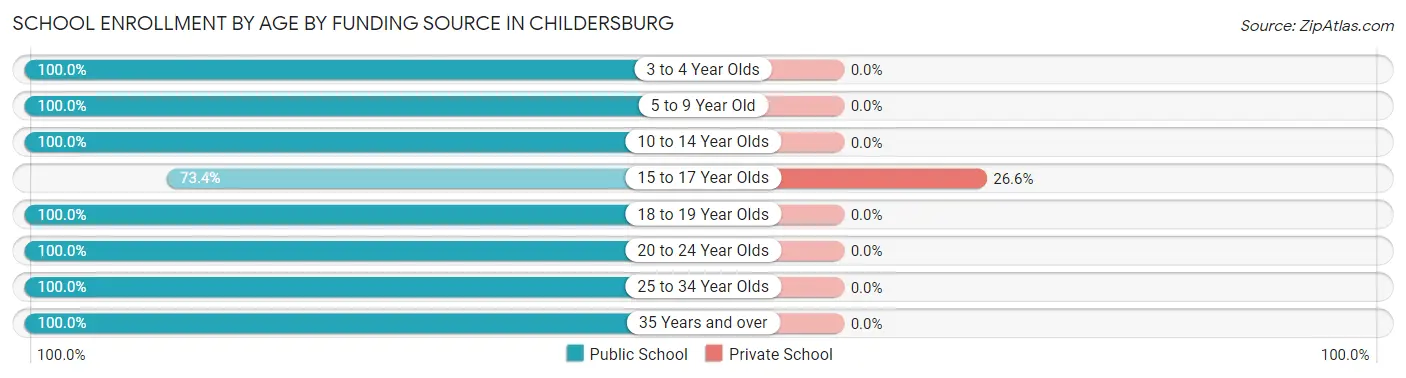
| Age Bracket | Public School | Private School |
| 3 to 4 Year Olds | 26 (100.0%) | 0 (0.0%) |
| 5 to 9 Year Old | 355 (100.0%) | 0 (0.0%) |
| 10 to 14 Year Olds | 243 (100.0%) | 0 (0.0%) |
| 15 to 17 Year Olds | 47 (73.4%) | 17 (26.6%) |
| 18 to 19 Year Olds | 11 (100.0%) | 0 (0.0%) |
| 20 to 24 Year Olds | 56 (100.0%) | 0 (0.0%) |
| 25 to 34 Year Olds | 32 (100.0%) | 0 (0.0%) |
| 35 Years and over | 87 (100.0%) | 0 (0.0%) |
| Total | 857 (98.1%) | 17 (1.9%) |
Educational Attainment by Field of Study in Childersburg
Business (96 | 22.6%), bio, nature & agricultural (77 | 18.2%), arts & humanities (70 | 16.5%), science & technology (38 | 9.0%), and psychology (36 | 8.5%) are the most common fields of study among 424 individuals in Childersburg who have obtained a bachelor's degree or higher.
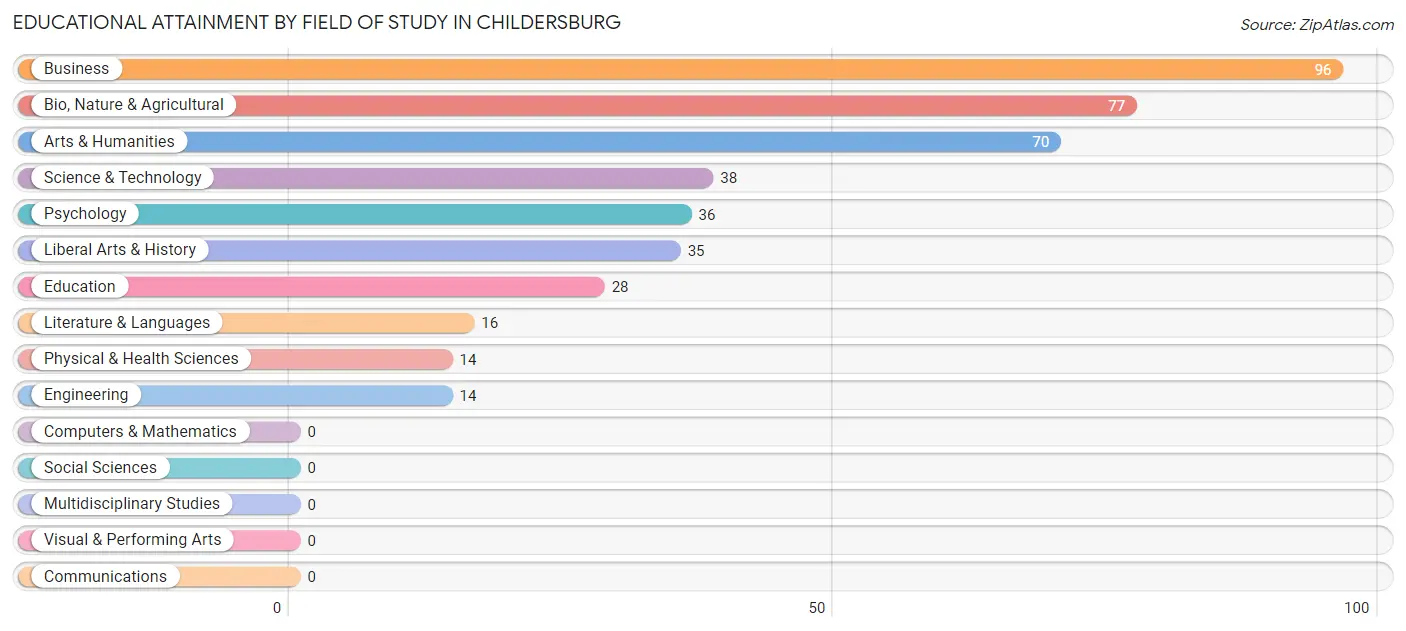
| Field of Study | # Graduates | % Graduates |
| Computers & Mathematics | 0 | 0.0% |
| Bio, Nature & Agricultural | 77 | 18.2% |
| Physical & Health Sciences | 14 | 3.3% |
| Psychology | 36 | 8.5% |
| Social Sciences | 0 | 0.0% |
| Engineering | 14 | 3.3% |
| Multidisciplinary Studies | 0 | 0.0% |
| Science & Technology | 38 | 9.0% |
| Business | 96 | 22.6% |
| Education | 28 | 6.6% |
| Literature & Languages | 16 | 3.8% |
| Liberal Arts & History | 35 | 8.3% |
| Visual & Performing Arts | 0 | 0.0% |
| Communications | 0 | 0.0% |
| Arts & Humanities | 70 | 16.5% |
| Total | 424 | 100.0% |
Transportation & Commute in Childersburg
Vehicle Availability by Sex in Childersburg
The most prevalent vehicle ownership categories in Childersburg are males with 2 vehicles (298, accounting for 30.7%) and females with 2 vehicles (417, making up 31.6%).
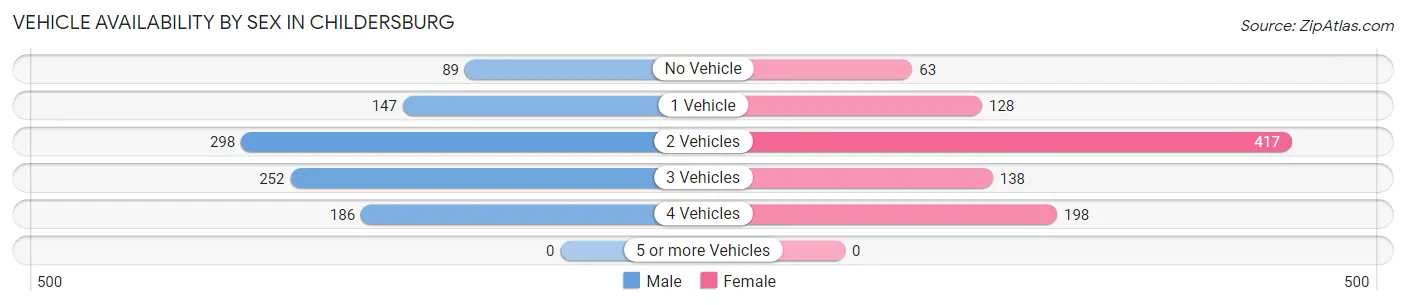
| Vehicles Available | Male | Female |
| No Vehicle | 89 (9.2%) | 63 (6.7%) |
| 1 Vehicle | 147 (15.1%) | 128 (13.6%) |
| 2 Vehicles | 298 (30.7%) | 417 (44.2%) |
| 3 Vehicles | 252 (25.9%) | 138 (14.6%) |
| 4 Vehicles | 186 (19.1%) | 198 (21.0%) |
| 5 or more Vehicles | 0 (0.0%) | 0 (0.0%) |
| Total | 972 (100.0%) | 944 (100.0%) |
Commute Time in Childersburg
The most frequently occuring commute durations in Childersburg are 15 to 19 minutes (659 commuters, 34.4%), 5 to 9 minutes (396 commuters, 20.7%), and 30 to 34 minutes (203 commuters, 10.6%).
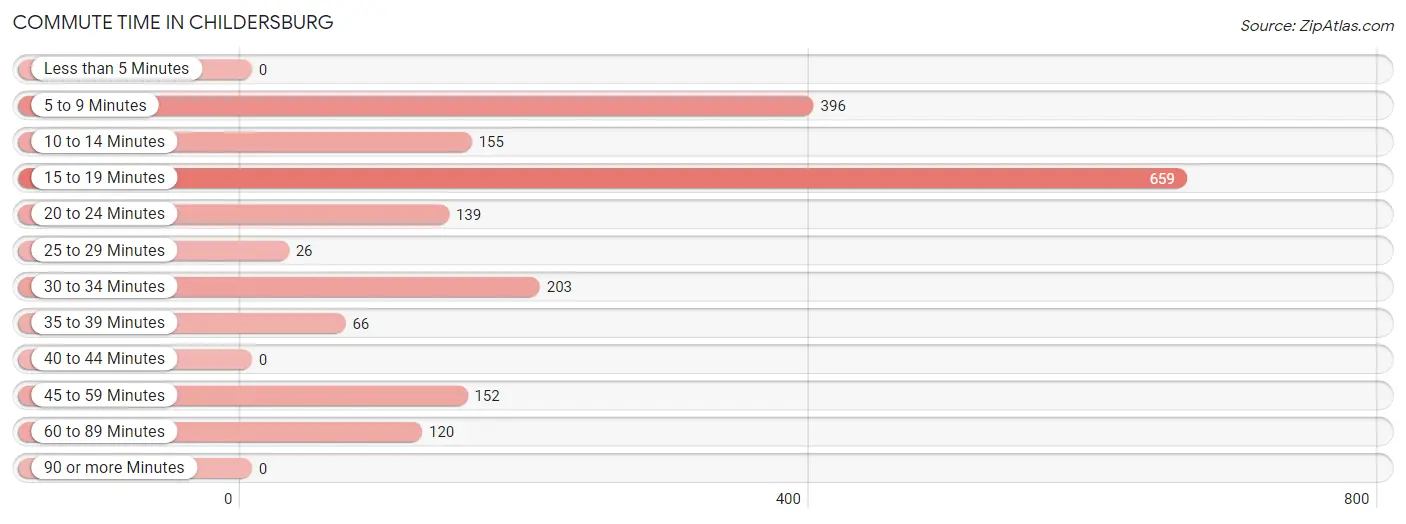
| Commute Time | # Commuters | % Commuters |
| Less than 5 Minutes | 0 | 0.0% |
| 5 to 9 Minutes | 396 | 20.7% |
| 10 to 14 Minutes | 155 | 8.1% |
| 15 to 19 Minutes | 659 | 34.4% |
| 20 to 24 Minutes | 139 | 7.2% |
| 25 to 29 Minutes | 26 | 1.4% |
| 30 to 34 Minutes | 203 | 10.6% |
| 35 to 39 Minutes | 66 | 3.4% |
| 40 to 44 Minutes | 0 | 0.0% |
| 45 to 59 Minutes | 152 | 7.9% |
| 60 to 89 Minutes | 120 | 6.3% |
| 90 or more Minutes | 0 | 0.0% |
Commute Time by Sex in Childersburg
The most common commute times in Childersburg are 15 to 19 minutes (445 commuters, 45.8%) for males and 5 to 9 minutes (274 commuters, 29.0%) for females.
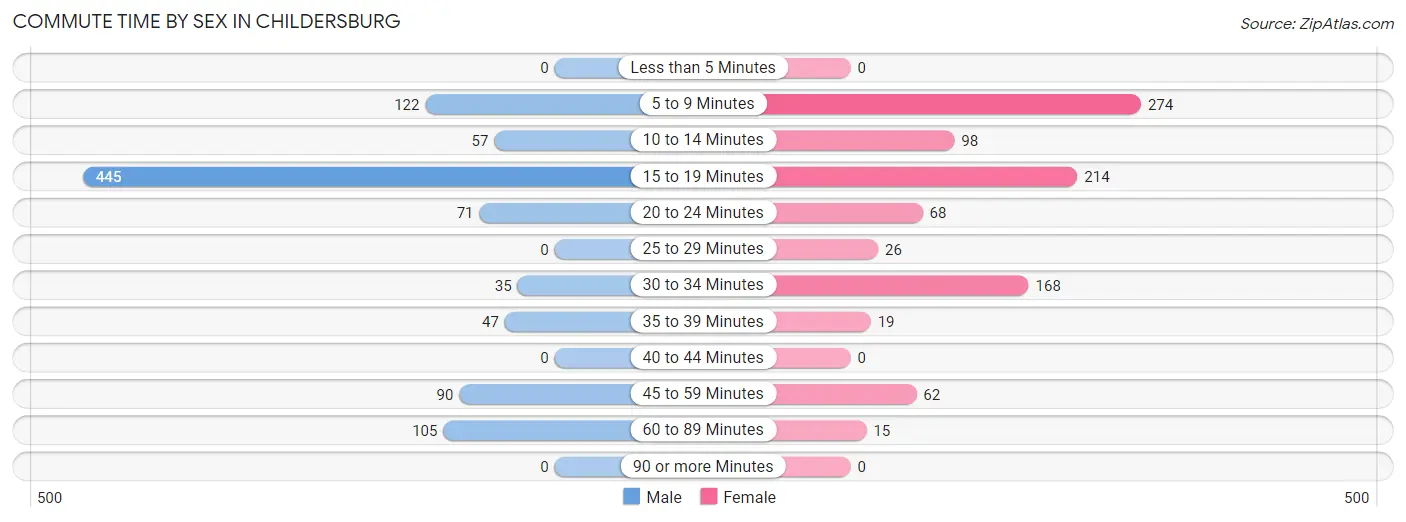
| Commute Time | Male | Female |
| Less than 5 Minutes | 0 (0.0%) | 0 (0.0%) |
| 5 to 9 Minutes | 122 (12.6%) | 274 (29.0%) |
| 10 to 14 Minutes | 57 (5.9%) | 98 (10.4%) |
| 15 to 19 Minutes | 445 (45.8%) | 214 (22.7%) |
| 20 to 24 Minutes | 71 (7.3%) | 68 (7.2%) |
| 25 to 29 Minutes | 0 (0.0%) | 26 (2.8%) |
| 30 to 34 Minutes | 35 (3.6%) | 168 (17.8%) |
| 35 to 39 Minutes | 47 (4.8%) | 19 (2.0%) |
| 40 to 44 Minutes | 0 (0.0%) | 0 (0.0%) |
| 45 to 59 Minutes | 90 (9.3%) | 62 (6.6%) |
| 60 to 89 Minutes | 105 (10.8%) | 15 (1.6%) |
| 90 or more Minutes | 0 (0.0%) | 0 (0.0%) |
Time of Departure to Work by Sex in Childersburg
The most frequent times of departure to work in Childersburg are 12:00 PM to 3:59 PM (197, 20.3%) for males and 7:00 AM to 7:29 AM (259, 27.4%) for females.
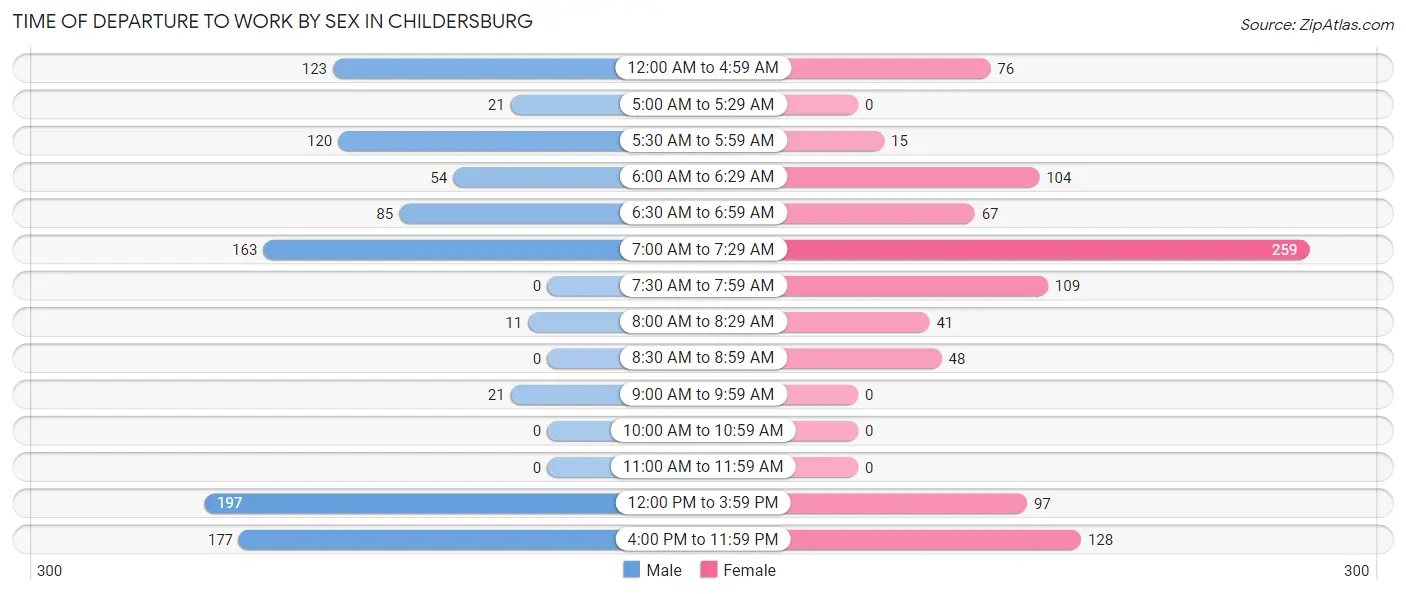
| Time of Departure | Male | Female |
| 12:00 AM to 4:59 AM | 123 (12.7%) | 76 (8.1%) |
| 5:00 AM to 5:29 AM | 21 (2.2%) | 0 (0.0%) |
| 5:30 AM to 5:59 AM | 120 (12.3%) | 15 (1.6%) |
| 6:00 AM to 6:29 AM | 54 (5.6%) | 104 (11.0%) |
| 6:30 AM to 6:59 AM | 85 (8.7%) | 67 (7.1%) |
| 7:00 AM to 7:29 AM | 163 (16.8%) | 259 (27.4%) |
| 7:30 AM to 7:59 AM | 0 (0.0%) | 109 (11.6%) |
| 8:00 AM to 8:29 AM | 11 (1.1%) | 41 (4.3%) |
| 8:30 AM to 8:59 AM | 0 (0.0%) | 48 (5.1%) |
| 9:00 AM to 9:59 AM | 21 (2.2%) | 0 (0.0%) |
| 10:00 AM to 10:59 AM | 0 (0.0%) | 0 (0.0%) |
| 11:00 AM to 11:59 AM | 0 (0.0%) | 0 (0.0%) |
| 12:00 PM to 3:59 PM | 197 (20.3%) | 97 (10.3%) |
| 4:00 PM to 11:59 PM | 177 (18.2%) | 128 (13.6%) |
| Total | 972 (100.0%) | 944 (100.0%) |
Housing Occupancy in Childersburg
Occupancy by Ownership in Childersburg
Of the total 2,012 dwellings in Childersburg, owner-occupied units account for 1,348 (67.0%), while renter-occupied units make up 664 (33.0%).
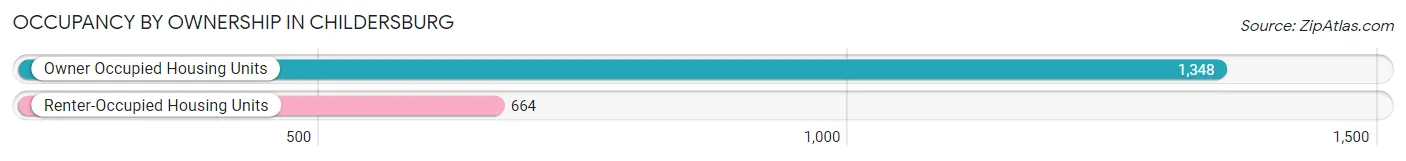
| Occupancy | # Housing Units | % Housing Units |
| Owner Occupied Housing Units | 1,348 | 67.0% |
| Renter-Occupied Housing Units | 664 | 33.0% |
| Total Occupied Housing Units | 2,012 | 100.0% |
Occupancy by Household Size in Childersburg
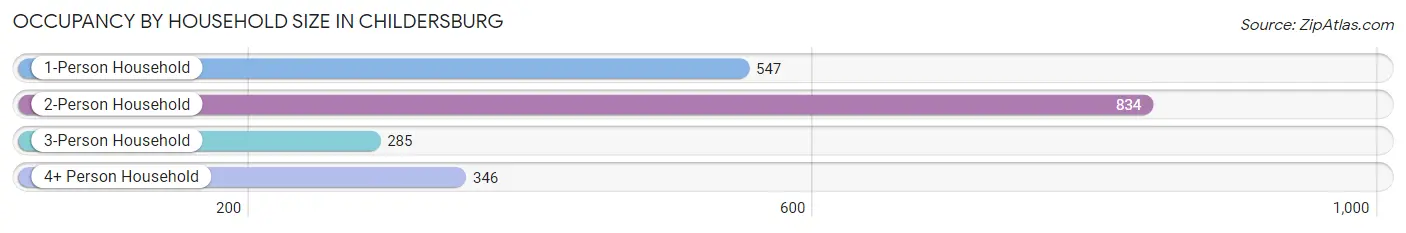
| Household Size | # Housing Units | % Housing Units |
| 1-Person Household | 547 | 27.2% |
| 2-Person Household | 834 | 41.4% |
| 3-Person Household | 285 | 14.2% |
| 4+ Person Household | 346 | 17.2% |
| Total Housing Units | 2,012 | 100.0% |
Occupancy by Ownership by Household Size in Childersburg
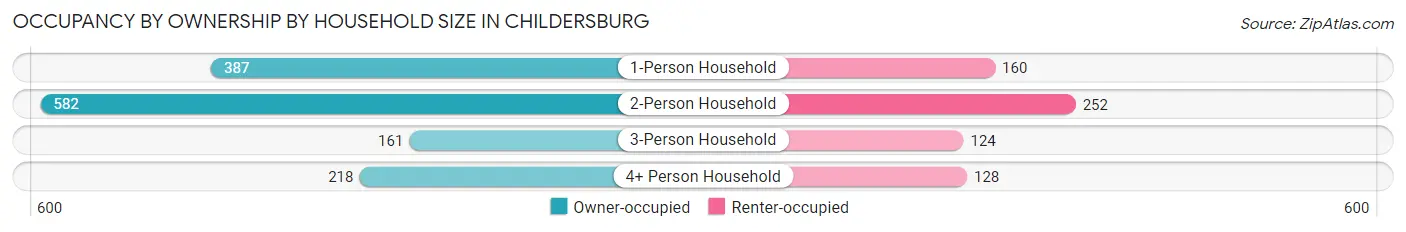
| Household Size | Owner-occupied | Renter-occupied |
| 1-Person Household | 387 (70.8%) | 160 (29.2%) |
| 2-Person Household | 582 (69.8%) | 252 (30.2%) |
| 3-Person Household | 161 (56.5%) | 124 (43.5%) |
| 4+ Person Household | 218 (63.0%) | 128 (37.0%) |
| Total Housing Units | 1,348 (67.0%) | 664 (33.0%) |
Occupancy by Educational Attainment in Childersburg
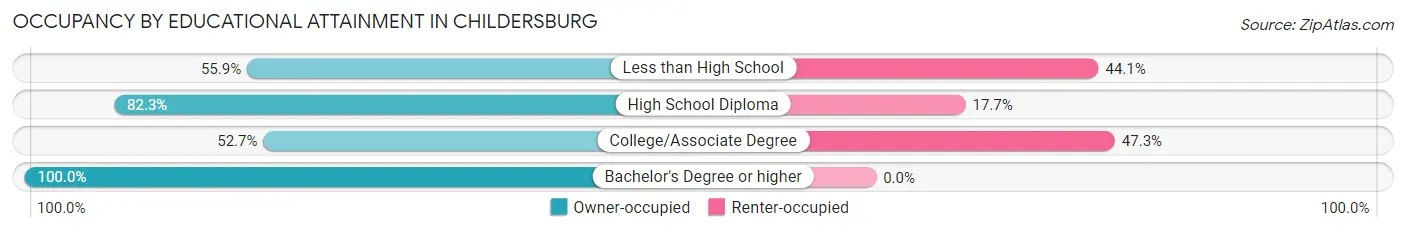
| Household Size | Owner-occupied | Renter-occupied |
| Less than High School | 208 (55.9%) | 164 (44.1%) |
| High School Diploma | 469 (82.3%) | 101 (17.7%) |
| College/Associate Degree | 444 (52.7%) | 399 (47.3%) |
| Bachelor's Degree or higher | 227 (100.0%) | 0 (0.0%) |
Occupancy by Age of Householder in Childersburg
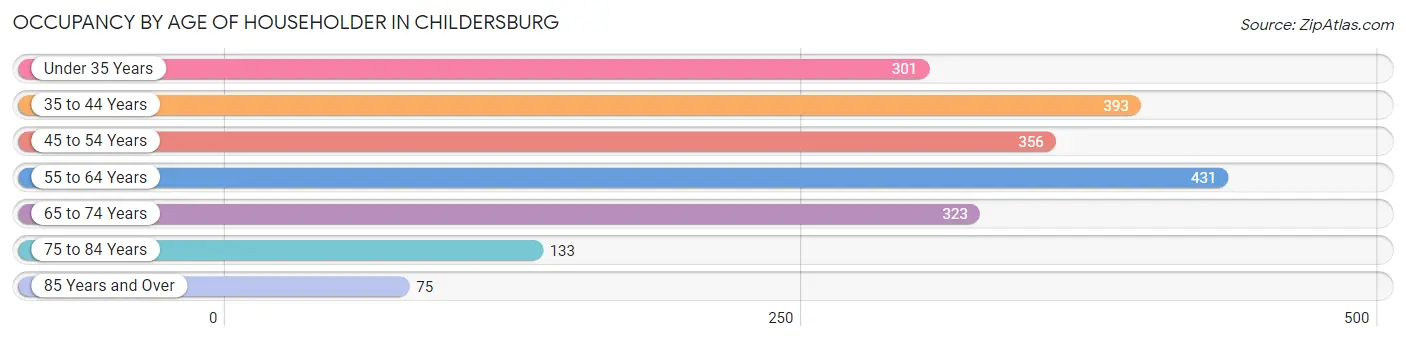
| Age Bracket | # Households | % Households |
| Under 35 Years | 301 | 15.0% |
| 35 to 44 Years | 393 | 19.5% |
| 45 to 54 Years | 356 | 17.7% |
| 55 to 64 Years | 431 | 21.4% |
| 65 to 74 Years | 323 | 16.1% |
| 75 to 84 Years | 133 | 6.6% |
| 85 Years and Over | 75 | 3.7% |
| Total | 2,012 | 100.0% |
Housing Finances in Childersburg
Median Income by Occupancy in Childersburg
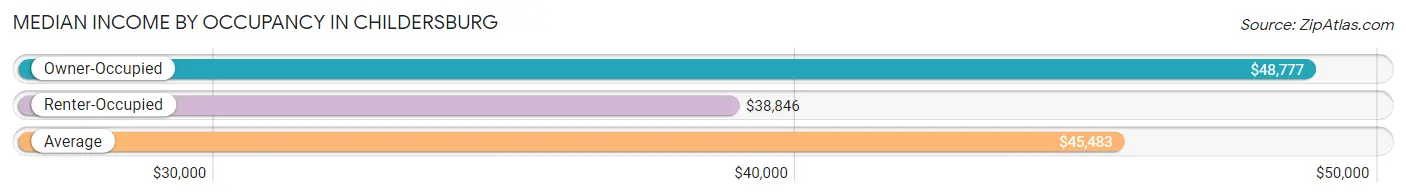
| Occupancy Type | # Households | Median Income |
| Owner-Occupied | 1,348 (67.0%) | $48,777 |
| Renter-Occupied | 664 (33.0%) | $38,846 |
| Average | 2,012 (100.0%) | $45,483 |
Occupancy by Householder Income Bracket in Childersburg
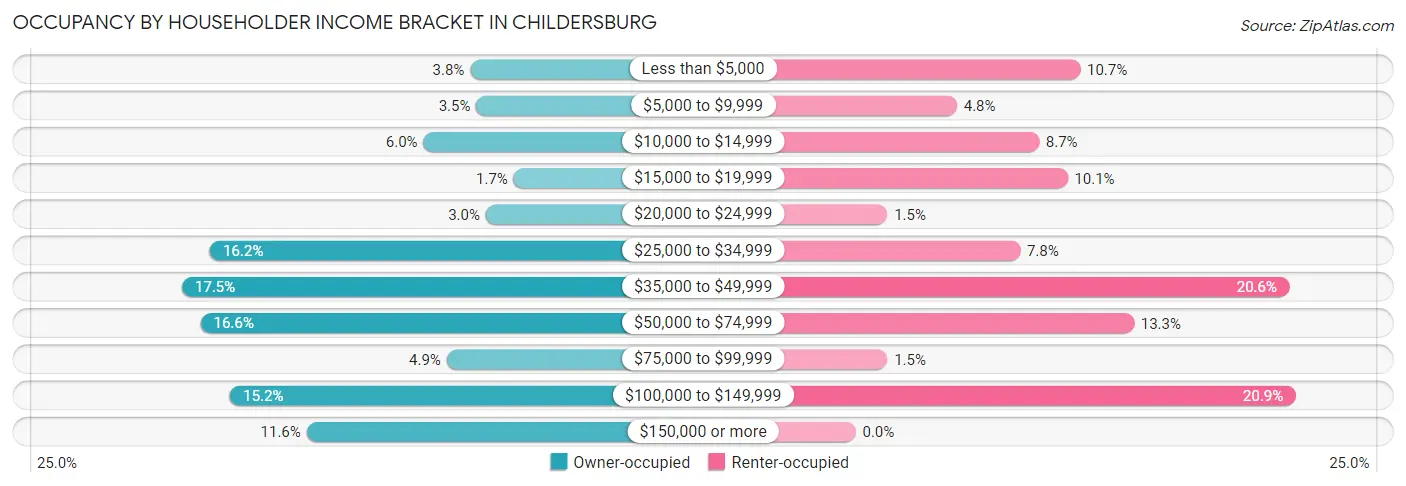
| Income Bracket | Owner-occupied | Renter-occupied |
| Less than $5,000 | 51 (3.8%) | 71 (10.7%) |
| $5,000 to $9,999 | 47 (3.5%) | 32 (4.8%) |
| $10,000 to $14,999 | 81 (6.0%) | 58 (8.7%) |
| $15,000 to $19,999 | 23 (1.7%) | 67 (10.1%) |
| $20,000 to $24,999 | 41 (3.0%) | 10 (1.5%) |
| $25,000 to $34,999 | 218 (16.2%) | 52 (7.8%) |
| $35,000 to $49,999 | 236 (17.5%) | 137 (20.6%) |
| $50,000 to $74,999 | 224 (16.6%) | 88 (13.3%) |
| $75,000 to $99,999 | 66 (4.9%) | 10 (1.5%) |
| $100,000 to $149,999 | 205 (15.2%) | 139 (20.9%) |
| $150,000 or more | 156 (11.6%) | 0 (0.0%) |
| Total | 1,348 (100.0%) | 664 (100.0%) |
Monthly Housing Cost Tiers in Childersburg
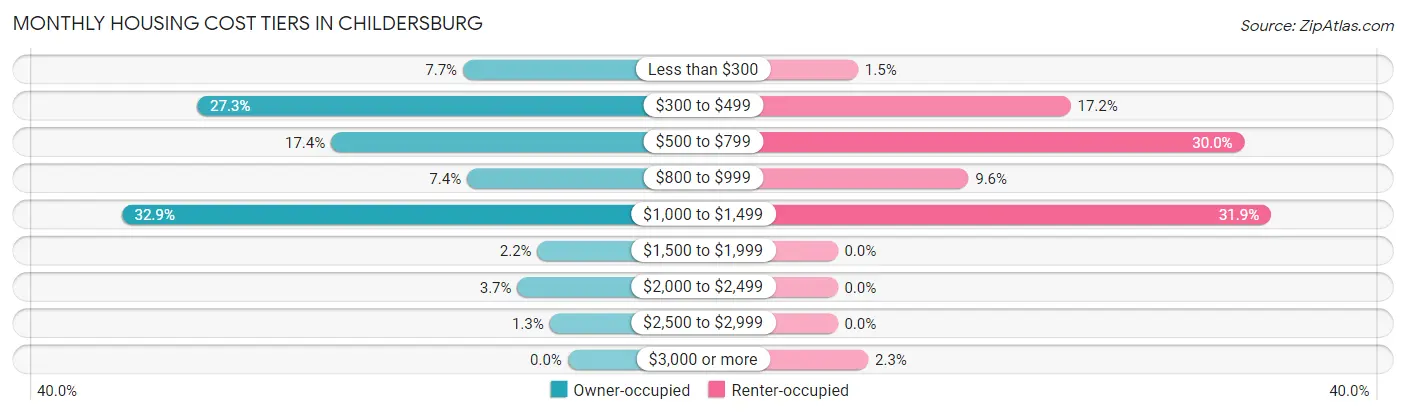
| Monthly Cost | Owner-occupied | Renter-occupied |
| Less than $300 | 104 (7.7%) | 10 (1.5%) |
| $300 to $499 | 368 (27.3%) | 114 (17.2%) |
| $500 to $799 | 235 (17.4%) | 199 (30.0%) |
| $800 to $999 | 100 (7.4%) | 64 (9.6%) |
| $1,000 to $1,499 | 443 (32.9%) | 212 (31.9%) |
| $1,500 to $1,999 | 30 (2.2%) | 0 (0.0%) |
| $2,000 to $2,499 | 50 (3.7%) | 0 (0.0%) |
| $2,500 to $2,999 | 18 (1.3%) | 0 (0.0%) |
| $3,000 or more | 0 (0.0%) | 15 (2.3%) |
| Total | 1,348 (100.0%) | 664 (100.0%) |
Physical Housing Characteristics in Childersburg
Housing Structures in Childersburg
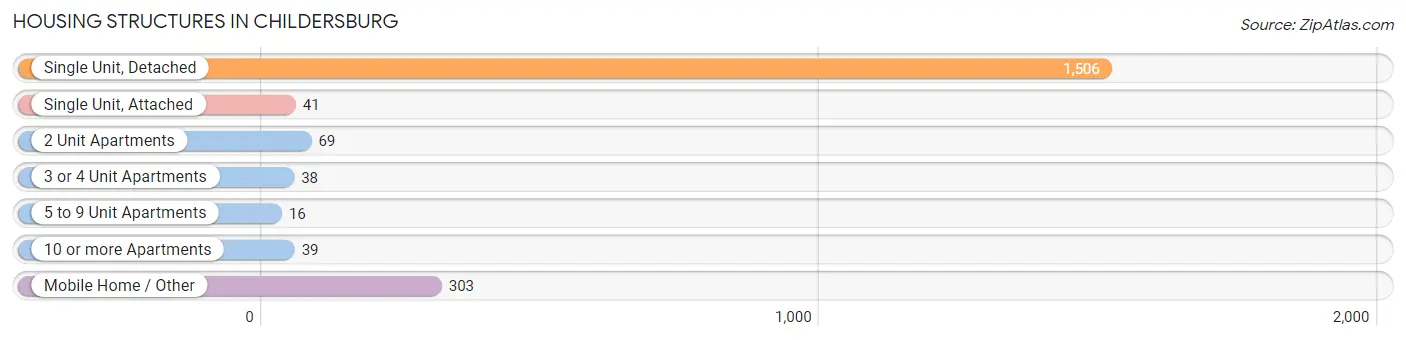
| Structure Type | # Housing Units | % Housing Units |
| Single Unit, Detached | 1,506 | 74.9% |
| Single Unit, Attached | 41 | 2.0% |
| 2 Unit Apartments | 69 | 3.4% |
| 3 or 4 Unit Apartments | 38 | 1.9% |
| 5 to 9 Unit Apartments | 16 | 0.8% |
| 10 or more Apartments | 39 | 1.9% |
| Mobile Home / Other | 303 | 15.1% |
| Total | 2,012 | 100.0% |
Housing Structures by Occupancy in Childersburg
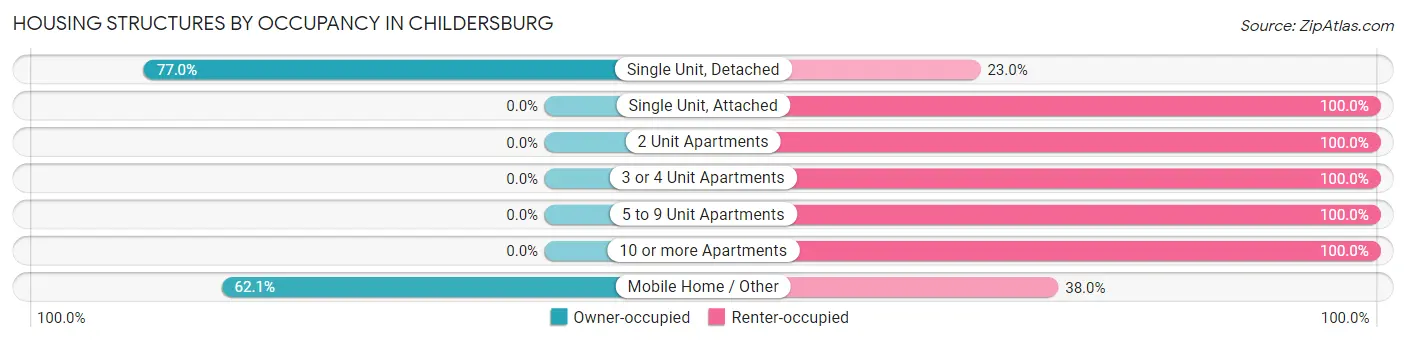
| Structure Type | Owner-occupied | Renter-occupied |
| Single Unit, Detached | 1,160 (77.0%) | 346 (23.0%) |
| Single Unit, Attached | 0 (0.0%) | 41 (100.0%) |
| 2 Unit Apartments | 0 (0.0%) | 69 (100.0%) |
| 3 or 4 Unit Apartments | 0 (0.0%) | 38 (100.0%) |
| 5 to 9 Unit Apartments | 0 (0.0%) | 16 (100.0%) |
| 10 or more Apartments | 0 (0.0%) | 39 (100.0%) |
| Mobile Home / Other | 188 (62.1%) | 115 (38.0%) |
| Total | 1,348 (67.0%) | 664 (33.0%) |
Housing Structures by Number of Rooms in Childersburg
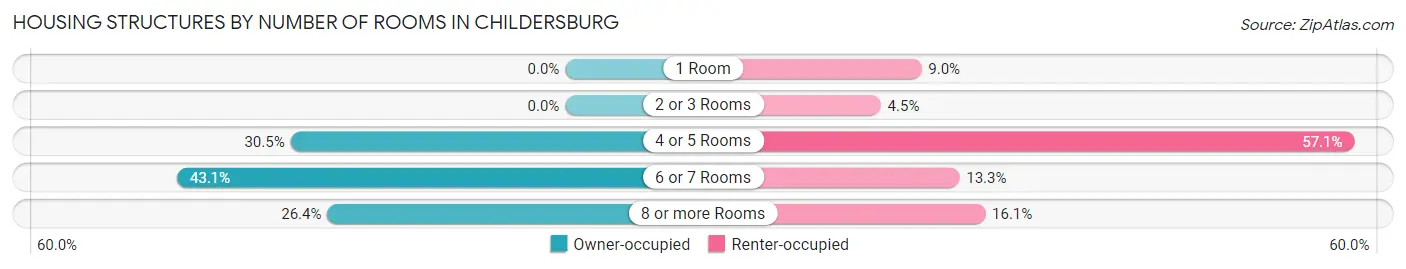
| Number of Rooms | Owner-occupied | Renter-occupied |
| 1 Room | 0 (0.0%) | 60 (9.0%) |
| 2 or 3 Rooms | 0 (0.0%) | 30 (4.5%) |
| 4 or 5 Rooms | 411 (30.5%) | 379 (57.1%) |
| 6 or 7 Rooms | 581 (43.1%) | 88 (13.3%) |
| 8 or more Rooms | 356 (26.4%) | 107 (16.1%) |
| Total | 1,348 (100.0%) | 664 (100.0%) |
Housing Structure by Heating Type in Childersburg
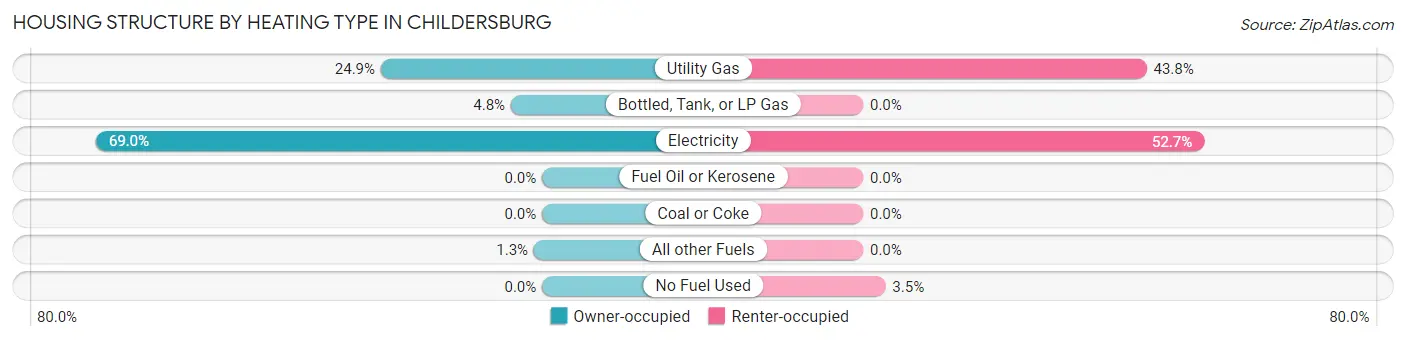
| Heating Type | Owner-occupied | Renter-occupied |
| Utility Gas | 336 (24.9%) | 291 (43.8%) |
| Bottled, Tank, or LP Gas | 65 (4.8%) | 0 (0.0%) |
| Electricity | 930 (69.0%) | 350 (52.7%) |
| Fuel Oil or Kerosene | 0 (0.0%) | 0 (0.0%) |
| Coal or Coke | 0 (0.0%) | 0 (0.0%) |
| All other Fuels | 17 (1.3%) | 0 (0.0%) |
| No Fuel Used | 0 (0.0%) | 23 (3.5%) |
| Total | 1,348 (100.0%) | 664 (100.0%) |
Household Vehicle Usage in Childersburg
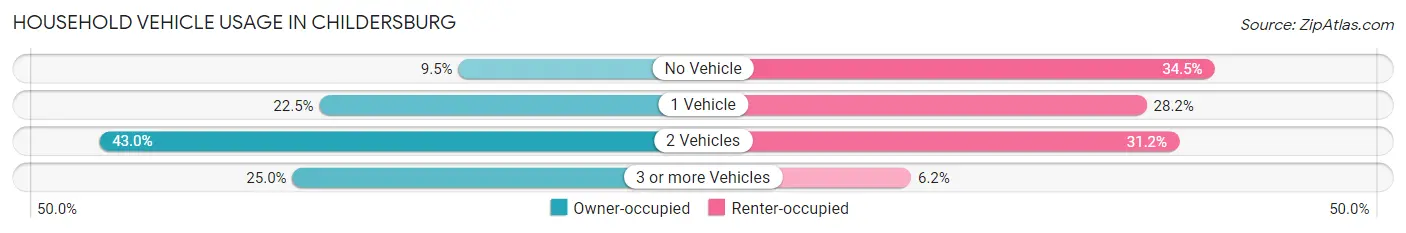
| Vehicles per Household | Owner-occupied | Renter-occupied |
| No Vehicle | 128 (9.5%) | 229 (34.5%) |
| 1 Vehicle | 303 (22.5%) | 187 (28.2%) |
| 2 Vehicles | 580 (43.0%) | 207 (31.2%) |
| 3 or more Vehicles | 337 (25.0%) | 41 (6.2%) |
| Total | 1,348 (100.0%) | 664 (100.0%) |
Real Estate & Mortgages in Childersburg
Real Estate and Mortgage Overview in Childersburg
| Characteristic | Without Mortgage | With Mortgage |
| Housing Units | 671 | 677 |
| Median Property Value | $115,800 | $124,000 |
| Median Household Income | $45,804 | $53 |
| Monthly Housing Costs | $430 | $0 |
| Real Estate Taxes | $540 | $168 |
Property Value by Mortgage Status in Childersburg
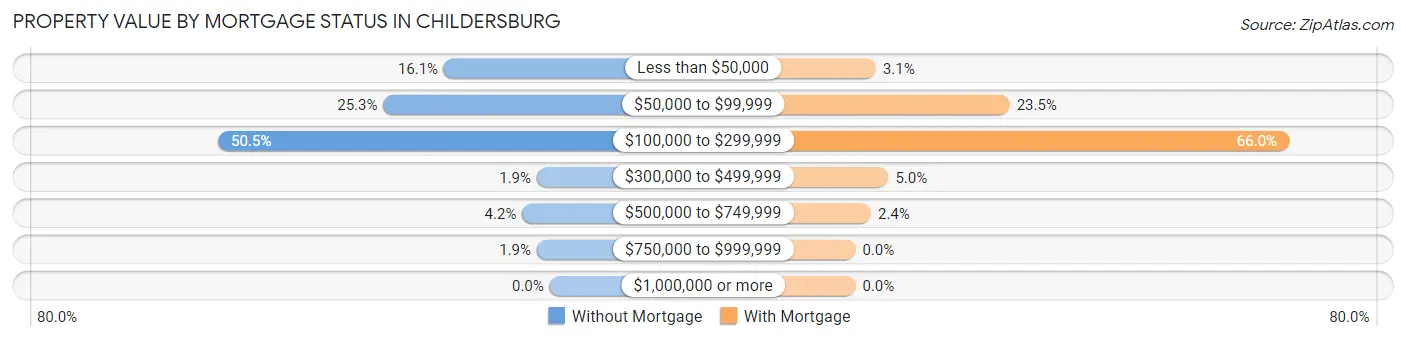
| Property Value | Without Mortgage | With Mortgage |
| Less than $50,000 | 108 (16.1%) | 21 (3.1%) |
| $50,000 to $99,999 | 170 (25.3%) | 159 (23.5%) |
| $100,000 to $299,999 | 339 (50.5%) | 447 (66.0%) |
| $300,000 to $499,999 | 13 (1.9%) | 34 (5.0%) |
| $500,000 to $749,999 | 28 (4.2%) | 16 (2.4%) |
| $750,000 to $999,999 | 13 (1.9%) | 0 (0.0%) |
| $1,000,000 or more | 0 (0.0%) | 0 (0.0%) |
| Total | 671 (100.0%) | 677 (100.0%) |
Household Income by Mortgage Status in Childersburg
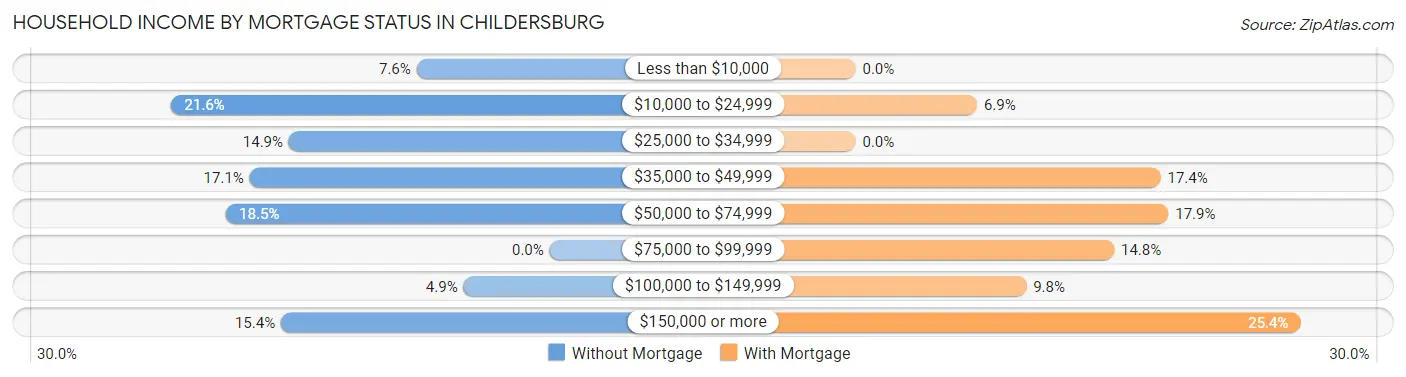
| Household Income | Without Mortgage | With Mortgage |
| Less than $10,000 | 51 (7.6%) | 0 (0.0%) |
| $10,000 to $24,999 | 145 (21.6%) | 47 (6.9%) |
| $25,000 to $34,999 | 100 (14.9%) | 0 (0.0%) |
| $35,000 to $49,999 | 115 (17.1%) | 118 (17.4%) |
| $50,000 to $74,999 | 124 (18.5%) | 121 (17.9%) |
| $75,000 to $99,999 | 0 (0.0%) | 100 (14.8%) |
| $100,000 to $149,999 | 33 (4.9%) | 66 (9.8%) |
| $150,000 or more | 103 (15.3%) | 172 (25.4%) |
| Total | 671 (100.0%) | 677 (100.0%) |
Property Value to Household Income Ratio in Childersburg
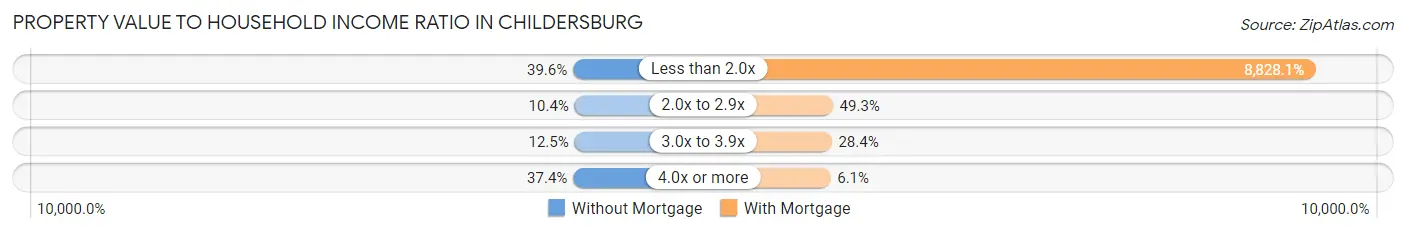
| Value-to-Income Ratio | Without Mortgage | With Mortgage |
| Less than 2.0x | 266 (39.6%) | 59,766 (8,828.1%) |
| 2.0x to 2.9x | 70 (10.4%) | 334 (49.3%) |
| 3.0x to 3.9x | 84 (12.5%) | 192 (28.4%) |
| 4.0x or more | 251 (37.4%) | 41 (6.1%) |
| Total | 671 (100.0%) | 677 (100.0%) |
Real Estate Taxes by Mortgage Status in Childersburg
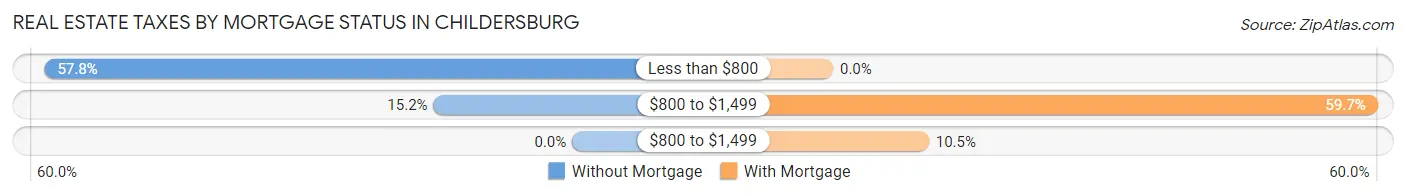
| Property Taxes | Without Mortgage | With Mortgage |
| Less than $800 | 388 (57.8%) | 0 (0.0%) |
| $800 to $1,499 | 102 (15.2%) | 404 (59.7%) |
| $800 to $1,499 | 0 (0.0%) | 71 (10.5%) |
| Total | 671 (100.0%) | 677 (100.0%) |
Health & Disability in Childersburg
Health Insurance Coverage by Age in Childersburg
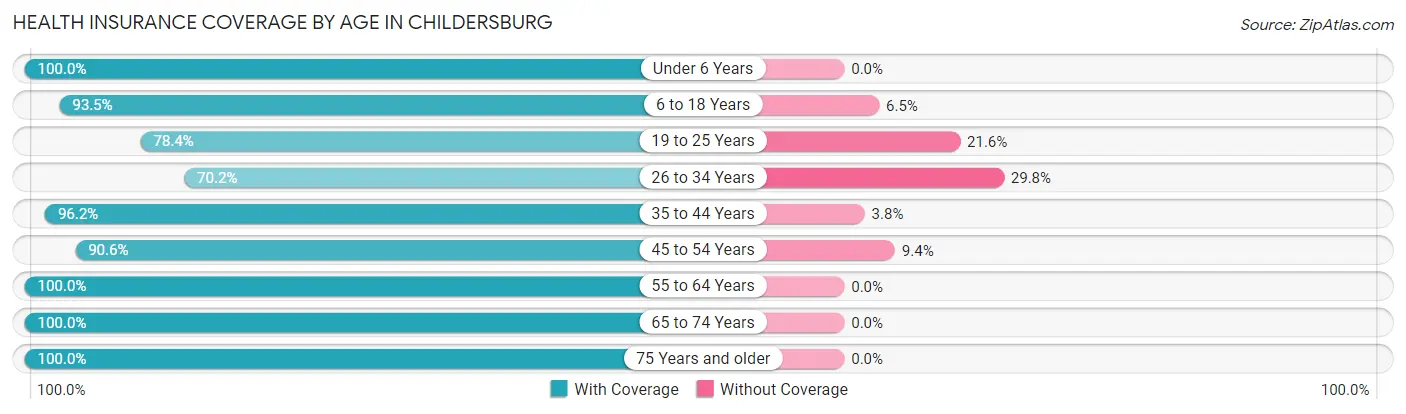
| Age Bracket | With Coverage | Without Coverage |
| Under 6 Years | 516 (100.0%) | 0 (0.0%) |
| 6 to 18 Years | 490 (93.5%) | 34 (6.5%) |
| 19 to 25 Years | 381 (78.4%) | 105 (21.6%) |
| 26 to 34 Years | 354 (70.2%) | 150 (29.8%) |
| 35 to 44 Years | 658 (96.2%) | 26 (3.8%) |
| 45 to 54 Years | 403 (90.6%) | 42 (9.4%) |
| 55 to 64 Years | 617 (100.0%) | 0 (0.0%) |
| 65 to 74 Years | 577 (100.0%) | 0 (0.0%) |
| 75 Years and older | 334 (100.0%) | 0 (0.0%) |
| Total | 4,330 (92.4%) | 357 (7.6%) |
Health Insurance Coverage by Citizenship Status in Childersburg
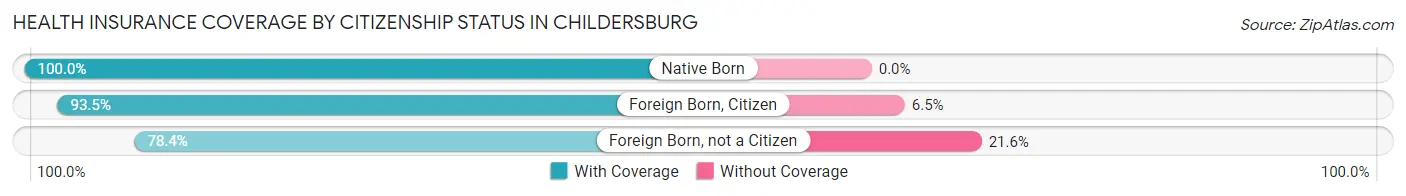
| Citizenship Status | With Coverage | Without Coverage |
| Native Born | 516 (100.0%) | 0 (0.0%) |
| Foreign Born, Citizen | 490 (93.5%) | 34 (6.5%) |
| Foreign Born, not a Citizen | 381 (78.4%) | 105 (21.6%) |
Health Insurance Coverage by Household Income in Childersburg
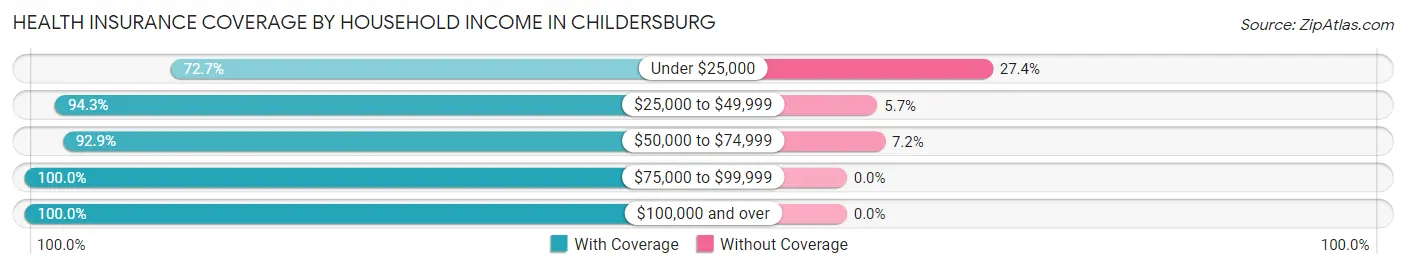
| Household Income | With Coverage | Without Coverage |
| Under $25,000 | 579 (72.7%) | 218 (27.4%) |
| $25,000 to $49,999 | 1,464 (94.3%) | 89 (5.7%) |
| $50,000 to $74,999 | 649 (92.8%) | 50 (7.1%) |
| $75,000 to $99,999 | 194 (100.0%) | 0 (0.0%) |
| $100,000 and over | 1,444 (100.0%) | 0 (0.0%) |
Public vs Private Health Insurance Coverage by Age in Childersburg
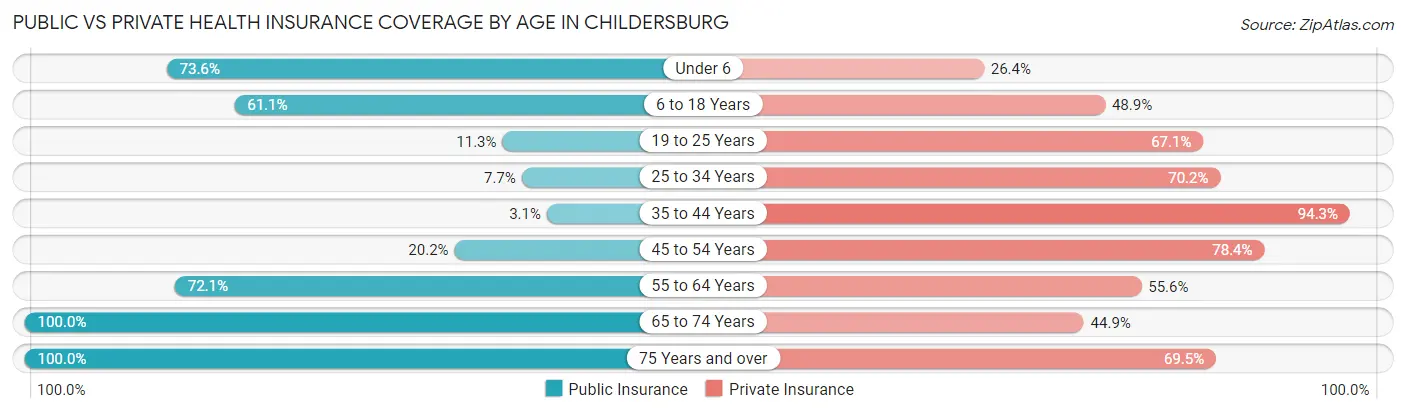
| Age Bracket | Public Insurance | Private Insurance |
| Under 6 | 380 (73.6%) | 136 (26.4%) |
| 6 to 18 Years | 320 (61.1%) | 256 (48.8%) |
| 19 to 25 Years | 55 (11.3%) | 326 (67.1%) |
| 25 to 34 Years | 39 (7.7%) | 354 (70.2%) |
| 35 to 44 Years | 21 (3.1%) | 645 (94.3%) |
| 45 to 54 Years | 90 (20.2%) | 349 (78.4%) |
| 55 to 64 Years | 445 (72.1%) | 343 (55.6%) |
| 65 to 74 Years | 577 (100.0%) | 259 (44.9%) |
| 75 Years and over | 334 (100.0%) | 232 (69.5%) |
| Total | 2,261 (48.2%) | 2,900 (61.9%) |
Disability Status by Sex by Age in Childersburg
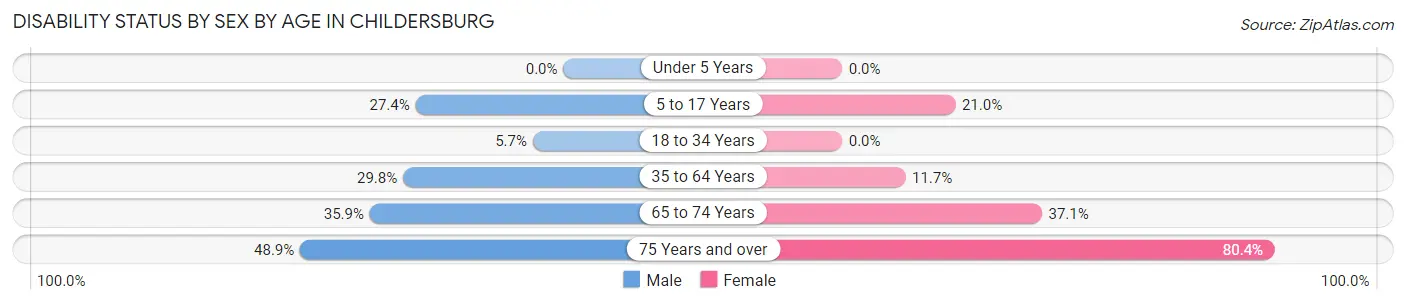
| Age Bracket | Male | Female |
| Under 5 Years | 0 (0.0%) | 0 (0.0%) |
| 5 to 17 Years | 118 (27.4%) | 58 (21.0%) |
| 18 to 34 Years | 27 (5.7%) | 0 (0.0%) |
| 35 to 64 Years | 266 (29.7%) | 100 (11.7%) |
| 65 to 74 Years | 60 (35.9%) | 152 (37.1%) |
| 75 Years and over | 86 (48.9%) | 127 (80.4%) |
Disability Class by Sex by Age in Childersburg
Disability Class: Hearing Difficulty
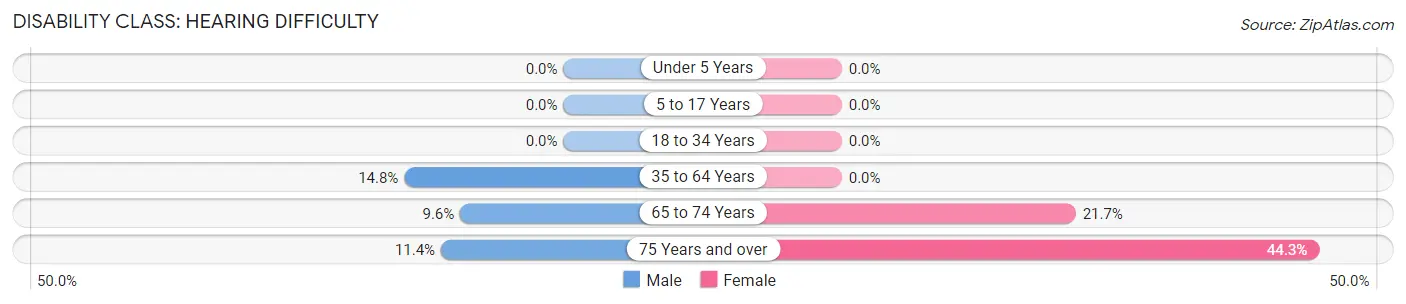
| Age Bracket | Male | Female |
| Under 5 Years | 0 (0.0%) | 0 (0.0%) |
| 5 to 17 Years | 0 (0.0%) | 0 (0.0%) |
| 18 to 34 Years | 0 (0.0%) | 0 (0.0%) |
| 35 to 64 Years | 132 (14.8%) | 0 (0.0%) |
| 65 to 74 Years | 16 (9.6%) | 89 (21.7%) |
| 75 Years and over | 20 (11.4%) | 70 (44.3%) |
Disability Class: Vision Difficulty
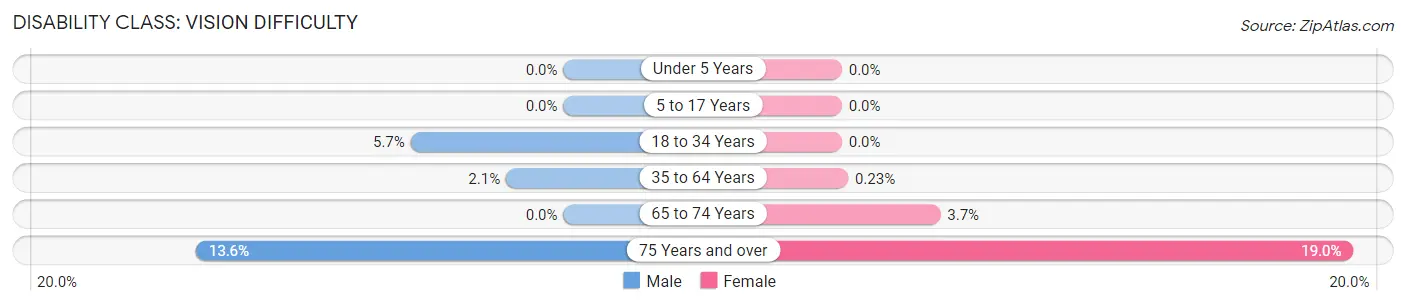
| Age Bracket | Male | Female |
| Under 5 Years | 0 (0.0%) | 0 (0.0%) |
| 5 to 17 Years | 0 (0.0%) | 0 (0.0%) |
| 18 to 34 Years | 27 (5.7%) | 0 (0.0%) |
| 35 to 64 Years | 19 (2.1%) | 2 (0.2%) |
| 65 to 74 Years | 0 (0.0%) | 15 (3.7%) |
| 75 Years and over | 24 (13.6%) | 30 (19.0%) |
Disability Class: Cognitive Difficulty
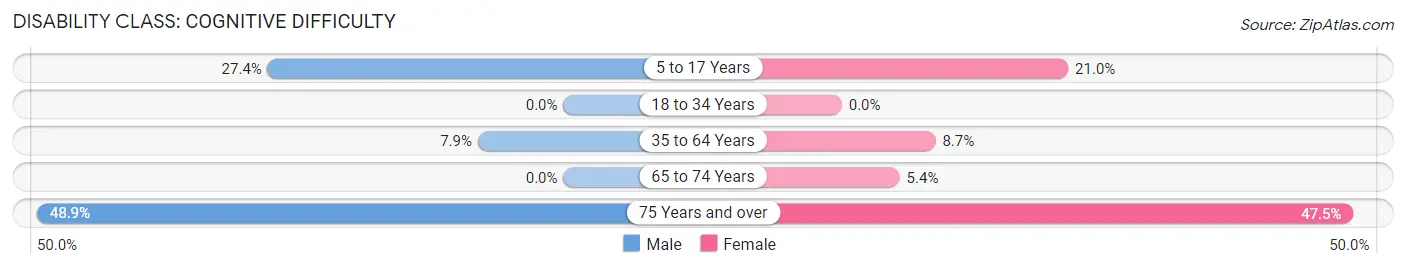
| Age Bracket | Male | Female |
| 5 to 17 Years | 118 (27.4%) | 58 (21.0%) |
| 18 to 34 Years | 0 (0.0%) | 0 (0.0%) |
| 35 to 64 Years | 71 (7.9%) | 74 (8.7%) |
| 65 to 74 Years | 0 (0.0%) | 22 (5.4%) |
| 75 Years and over | 86 (48.9%) | 75 (47.5%) |
Disability Class: Ambulatory Difficulty
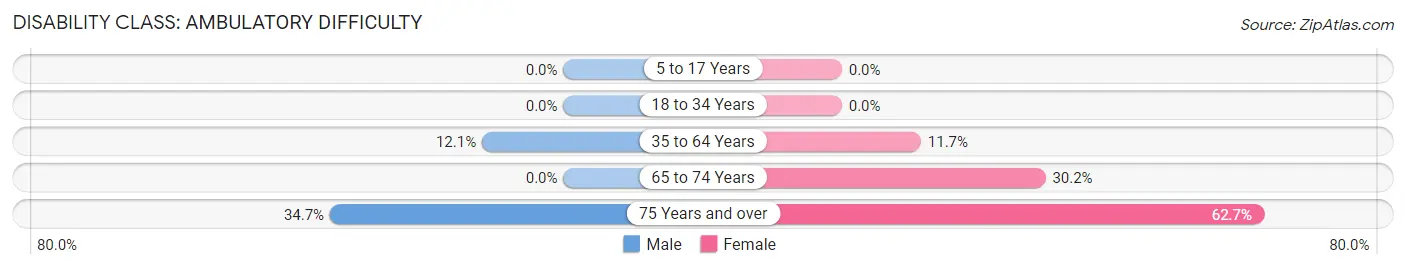
| Age Bracket | Male | Female |
| 5 to 17 Years | 0 (0.0%) | 0 (0.0%) |
| 18 to 34 Years | 0 (0.0%) | 0 (0.0%) |
| 35 to 64 Years | 108 (12.1%) | 100 (11.7%) |
| 65 to 74 Years | 0 (0.0%) | 124 (30.2%) |
| 75 Years and over | 61 (34.7%) | 99 (62.7%) |
Disability Class: Self-Care Difficulty
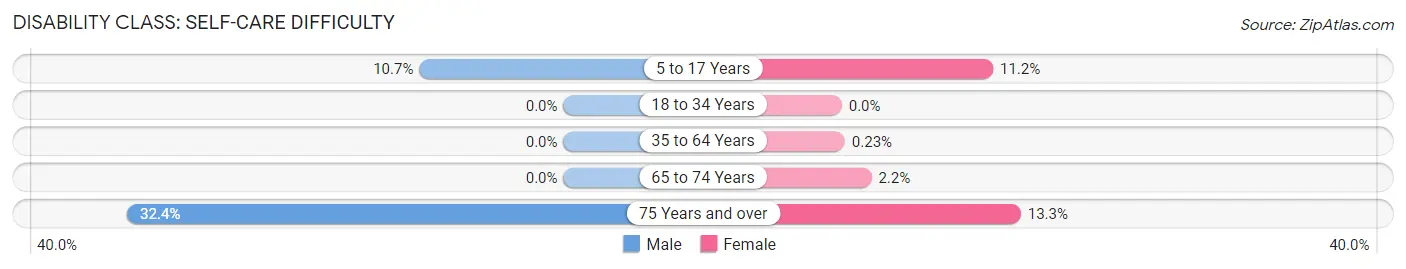
| Age Bracket | Male | Female |
| 5 to 17 Years | 46 (10.7%) | 31 (11.2%) |
| 18 to 34 Years | 0 (0.0%) | 0 (0.0%) |
| 35 to 64 Years | 0 (0.0%) | 2 (0.2%) |
| 65 to 74 Years | 0 (0.0%) | 9 (2.2%) |
| 75 Years and over | 57 (32.4%) | 21 (13.3%) |
Technology Access in Childersburg
Computing Device Access in Childersburg
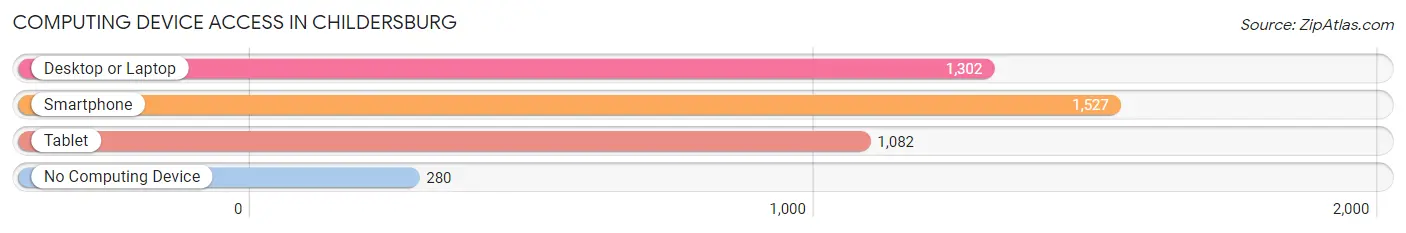
| Device Type | # Households | % Households |
| Desktop or Laptop | 1,302 | 64.7% |
| Smartphone | 1,527 | 75.9% |
| Tablet | 1,082 | 53.8% |
| No Computing Device | 280 | 13.9% |
| Total | 2,012 | 100.0% |
Internet Access in Childersburg
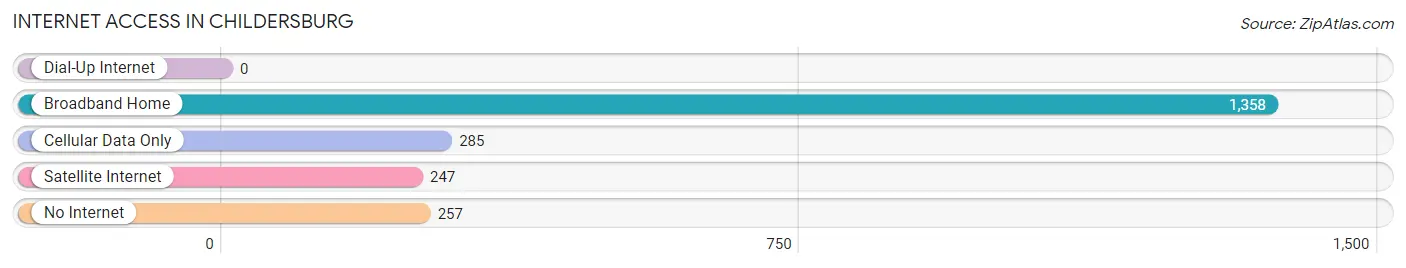
| Internet Type | # Households | % Households |
| Dial-Up Internet | 0 | 0.0% |
| Broadband Home | 1,358 | 67.5% |
| Cellular Data Only | 285 | 14.2% |
| Satellite Internet | 247 | 12.3% |
| No Internet | 257 | 12.8% |
| Total | 2,012 | 100.0% |
Childersburg Summary
Childersburg, Alabama is a small city located in Talladega County, Alabama. It is situated on the banks of the Coosa River, about 25 miles east of Birmingham. The city has a population of 5,175 as of the 2010 census.
History
Childersburg was founded in 1836 by William Childers, a settler from Georgia. The city was originally known as "Childers' Settlement" and was incorporated in 1887. The city was named after William Childers, who was a prominent local landowner and businessman.
Childersburg was an important center of the iron and steel industry in the late 19th and early 20th centuries. The city was home to several large iron and steel mills, including the Childersburg Iron and Steel Company, which was founded in 1887. The city was also home to the Childersburg Shipyard, which was established in 1891 and operated until the early 20th century.
Geography
Childersburg is located at 33°14'N 86°20'W (33.23, -86.33). The city is situated on the banks of the Coosa River, about 25 miles east of Birmingham. The city has a total area of 8.2 square miles, all of which is land.
Economy
Childersburg is a small city with a population of 5,175 as of the 2010 census. The city's economy is largely based on manufacturing and tourism. The city is home to several large manufacturing companies, including the Childersburg Iron and Steel Company, which was founded in 1887. The city is also home to several tourist attractions, including the DeSoto Caverns, which is a popular tourist destination.
Demographics
As of the 2010 census, the population of Childersburg was 5,175. The racial makeup of the city was 79.2% White, 17.7% African American, 0.3% Native American, 0.3% Asian, 0.1% Pacific Islander, 0.7% from other races, and 1.9% from two or more races. Hispanic or Latino of any race were 2.2% of the population.
The median income for a household in the city was $30,938, and the median income for a family was $37,917. The per capita income for the city was $17,845. About 17.2% of families and 20.2% of the population were below the poverty line, including 28.2% of those under age 18 and 11.2% of those age 65 or over.
Childersburg is served by the Talladega County School System. The city is home to two public schools, Childersburg High School and Childersburg Middle School. The city is also home to several private schools, including the Childersburg Christian Academy and the Childersburg Academy of Arts and Sciences.
Common Questions
What is Per Capita Income in Childersburg?
Per Capita income in Childersburg is $28,986.
What is the Median Family Income in Childersburg?
Median Family Income in Childersburg is $47,739.
What is the Median Household income in Childersburg?
Median Household Income in Childersburg is $45,483.
What is Income or Wage Gap in Childersburg?
Income or Wage Gap in Childersburg is 27.1%.
Women in Childersburg earn 72.9 cents for every dollar earned by a man.
What is Inequality or Gini Index in Childersburg?
Inequality or Gini Index in Childersburg is 0.49.
What is the Total Population of Childersburg?
Total Population of Childersburg is 4,743.
What is the Total Male Population of Childersburg?
Total Male Population of Childersburg is 2,432.
What is the Total Female Population of Childersburg?
Total Female Population of Childersburg is 2,311.
What is the Ratio of Males per 100 Females in Childersburg?
There are 105.24 Males per 100 Females in Childersburg.
What is the Ratio of Females per 100 Males in Childersburg?
There are 95.02 Females per 100 Males in Childersburg.
What is the Median Population Age in Childersburg?
Median Population Age in Childersburg is 42.0 Years.
What is the Average Family Size in Childersburg
Average Family Size in Childersburg is 2.8 People.
What is the Average Household Size in Childersburg
Average Household Size in Childersburg is 2.4 People.
How Large is the Labor Force in Childersburg?
There are 2,125 People in the Labor Forcein in Childersburg.
What is the Percentage of People in the Labor Force in Childersburg?
55.9% of People are in the Labor Force in Childersburg.
What is the Unemployment Rate in Childersburg?
Unemployment Rate in Childersburg is 8.2%.