Hueytown, AL Map & Demographics
Hueytown Map
Hueytown Overview
$28,299
PER CAPITA INCOME
$71,780
AVG FAMILY INCOME
$64,176
AVG HOUSEHOLD INCOME
20.3%
WAGE / INCOME GAP [ % ]
79.7¢/ $1
WAGE / INCOME GAP [ $ ]
$12,518
FAMILY INCOME DEFICIT
0.37
INEQUALITY / GINI INDEX
16,655
TOTAL POPULATION
7,557
MALE POPULATION
9,098
FEMALE POPULATION
83.06
MALES / 100 FEMALES
120.39
FEMALES / 100 MALES
36.1
MEDIAN AGE
3.4
AVG FAMILY SIZE
2.8
AVG HOUSEHOLD SIZE
8,013
LABOR FORCE [ PEOPLE ]
62.2%
PERCENT IN LABOR FORCE
7.8%
UNEMPLOYMENT RATE
Hueytown Area Codes
Income in Hueytown
Income Overview in Hueytown
Per Capita Income in Hueytown is $28,299, while median incomes of families and households are $71,780 and $64,176 respectively.
| Characteristic | Number | Measure |
| Per Capita Income | 16,655 | $28,299 |
| Median Family Income | 4,173 | $71,780 |
| Mean Family Income | 4,173 | $83,975 |
| Median Household Income | 5,803 | $64,176 |
| Mean Household Income | 5,803 | $76,827 |
| Income Deficit | 4,173 | $12,518 |
| Wage / Income Gap (%) | 16,655 | 20.29% |
| Wage / Income Gap ($) | 16,655 | 79.71¢ per $1 |
| Gini / Inequality Index | 16,655 | 0.37 |
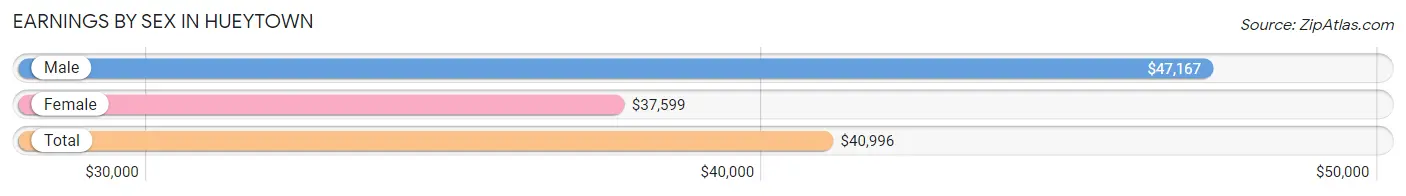
Earnings by Sex in Hueytown
Average Earnings in Hueytown are $40,996, $47,167 for men and $37,599 for women, a difference of 20.3%.
| Sex | Number | Average Earnings |
| Male | 3,800 (47.9%) | $47,167 |
| Female | 4,135 (52.1%) | $37,599 |
| Total | 7,935 (100.0%) | $40,996 |
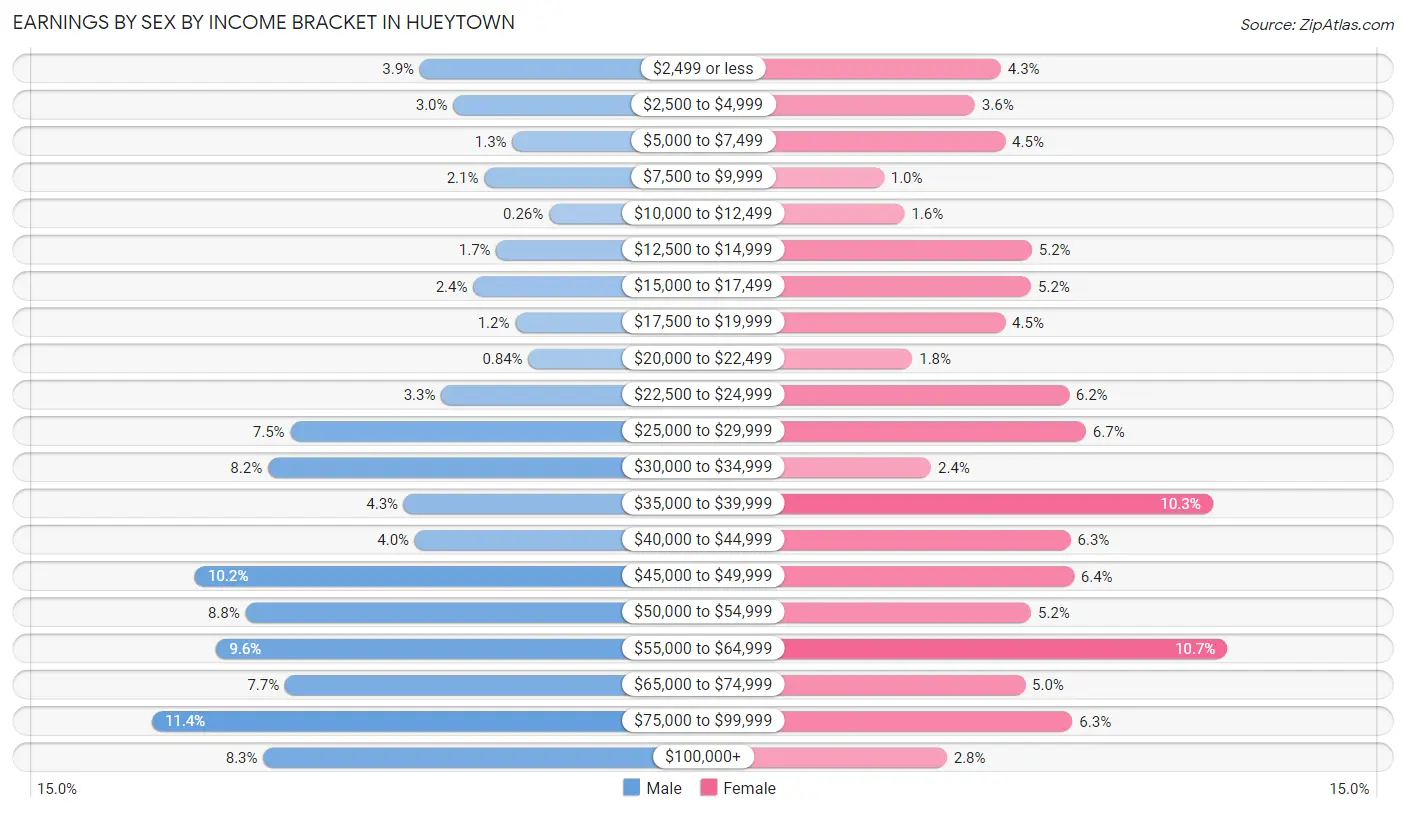
Earnings by Sex by Income Bracket in Hueytown
The most common earnings brackets in Hueytown are $75,000 to $99,999 for men (434 | 11.4%) and $55,000 to $64,999 for women (442 | 10.7%).
| Income | Male | Female |
| $2,499 or less | 148 (3.9%) | 179 (4.3%) |
| $2,500 to $4,999 | 112 (2.9%) | 149 (3.6%) |
| $5,000 to $7,499 | 49 (1.3%) | 184 (4.4%) |
| $7,500 to $9,999 | 79 (2.1%) | 43 (1.0%) |
| $10,000 to $12,499 | 10 (0.3%) | 67 (1.6%) |
| $12,500 to $14,999 | 66 (1.7%) | 215 (5.2%) |
| $15,000 to $17,499 | 91 (2.4%) | 214 (5.2%) |
| $17,500 to $19,999 | 46 (1.2%) | 184 (4.4%) |
| $20,000 to $22,499 | 32 (0.8%) | 76 (1.8%) |
| $22,500 to $24,999 | 125 (3.3%) | 258 (6.2%) |
| $25,000 to $29,999 | 286 (7.5%) | 278 (6.7%) |
| $30,000 to $34,999 | 310 (8.2%) | 98 (2.4%) |
| $35,000 to $39,999 | 165 (4.3%) | 425 (10.3%) |
| $40,000 to $44,999 | 153 (4.0%) | 260 (6.3%) |
| $45,000 to $49,999 | 388 (10.2%) | 264 (6.4%) |
| $50,000 to $54,999 | 334 (8.8%) | 214 (5.2%) |
| $55,000 to $64,999 | 365 (9.6%) | 442 (10.7%) |
| $65,000 to $74,999 | 292 (7.7%) | 207 (5.0%) |
| $75,000 to $99,999 | 434 (11.4%) | 262 (6.3%) |
| $100,000+ | 315 (8.3%) | 116 (2.8%) |
| Total | 3,800 (100.0%) | 4,135 (100.0%) |
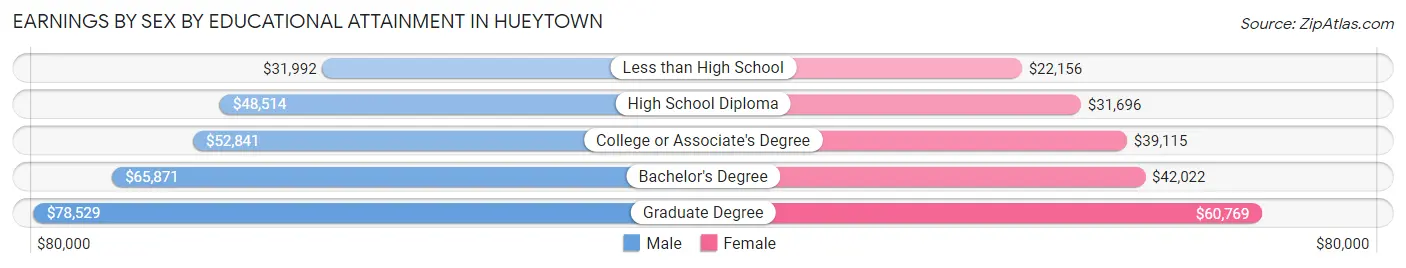
Earnings by Sex by Educational Attainment in Hueytown
Average earnings in Hueytown are $50,342 for men and $39,972 for women, a difference of 20.6%. Men with an educational attainment of graduate degree enjoy the highest average annual earnings of $78,529, while those with less than high school education earn the least with $31,992. Women with an educational attainment of graduate degree earn the most with the average annual earnings of $60,769, while those with less than high school education have the smallest earnings of $22,156.
| Educational Attainment | Male Income | Female Income |
| Less than High School | $31,992 | $22,156 |
| High School Diploma | $48,514 | $31,696 |
| College or Associate's Degree | $52,841 | $39,115 |
| Bachelor's Degree | $65,871 | $42,022 |
| Graduate Degree | $78,529 | $60,769 |
| Total | $50,342 | $39,972 |
Family Income in Hueytown
Family Income Brackets in Hueytown
According to the Hueytown family income data, there are 1,047 families falling into the $50,000 to $74,999 income range, which is the most common income bracket and makes up 25.1% of all families. Conversely, the $10,000 to $14,999 income bracket is the least frequent group with only 83 families (2.0%) belonging to this category.
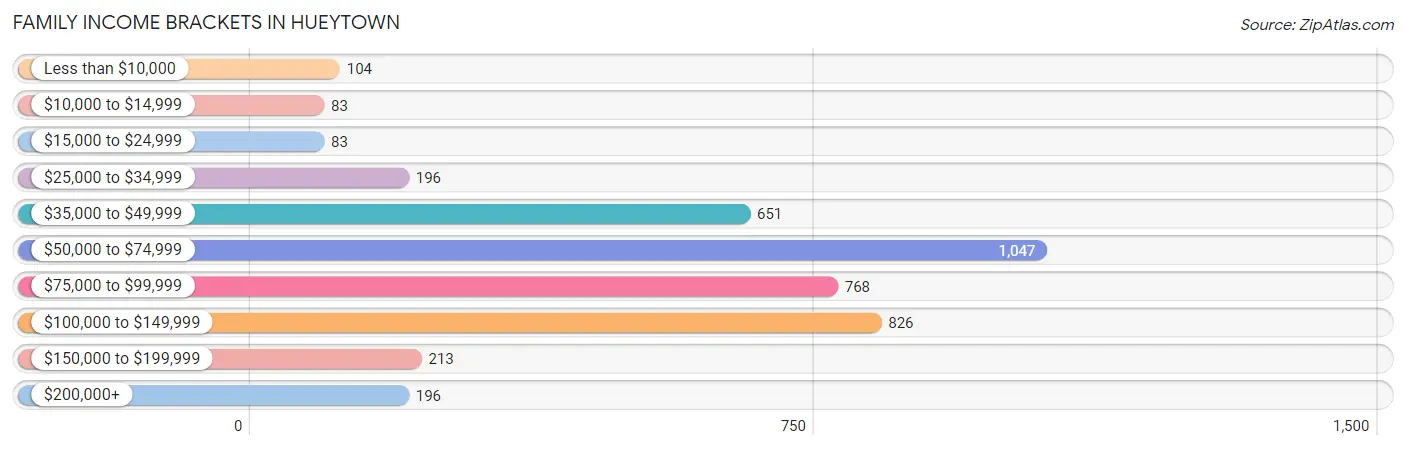
| Income Bracket | # Families | % Families |
| Less than $10,000 | 104 | 2.5% |
| $10,000 to $14,999 | 83 | 2.0% |
| $15,000 to $24,999 | 83 | 2.0% |
| $25,000 to $34,999 | 196 | 4.7% |
| $35,000 to $49,999 | 651 | 15.6% |
| $50,000 to $74,999 | 1,047 | 25.1% |
| $75,000 to $99,999 | 768 | 18.4% |
| $100,000 to $149,999 | 826 | 19.8% |
| $150,000 to $199,999 | 213 | 5.1% |
| $200,000+ | 196 | 4.7% |
Family Income by Famaliy Size in Hueytown
7+ person families (65 | 1.6%) account for the highest median family income in Hueytown with $112,760 per family, while 2-person families (1,630 | 39.1%) have the highest median income of $35,796 per family member.
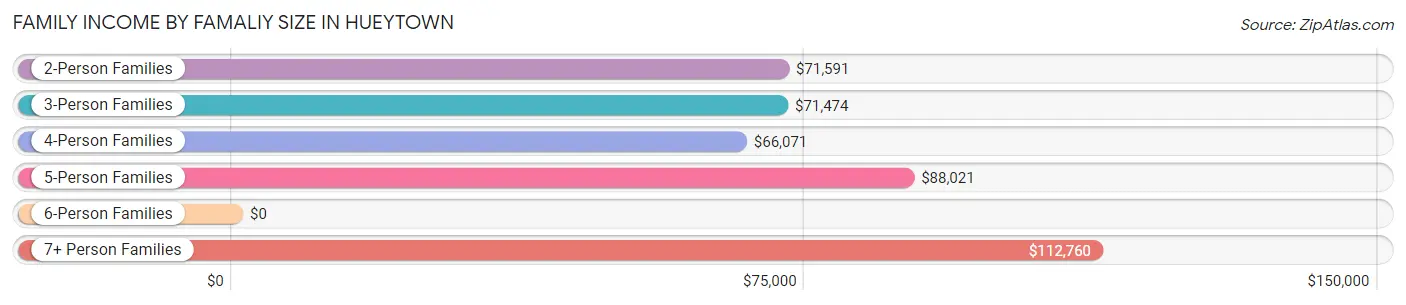
| Income Bracket | # Families | Median Income |
| 2-Person Families | 1,630 (39.1%) | $71,591 |
| 3-Person Families | 1,138 (27.3%) | $71,474 |
| 4-Person Families | 882 (21.1%) | $66,071 |
| 5-Person Families | 383 (9.2%) | $88,021 |
| 6-Person Families | 75 (1.8%) | $0 |
| 7+ Person Families | 65 (1.6%) | $112,760 |
| Total | 4,173 (100.0%) | $71,780 |
Family Income by Number of Earners in Hueytown
The median family income in Hueytown is $71,780, with families comprising 3+ earners (456) having the highest median family income of $120,313, while families with 1 earner (1,304) have the lowest median family income of $55,180, accounting for 10.9% and 31.2% of families, respectively.
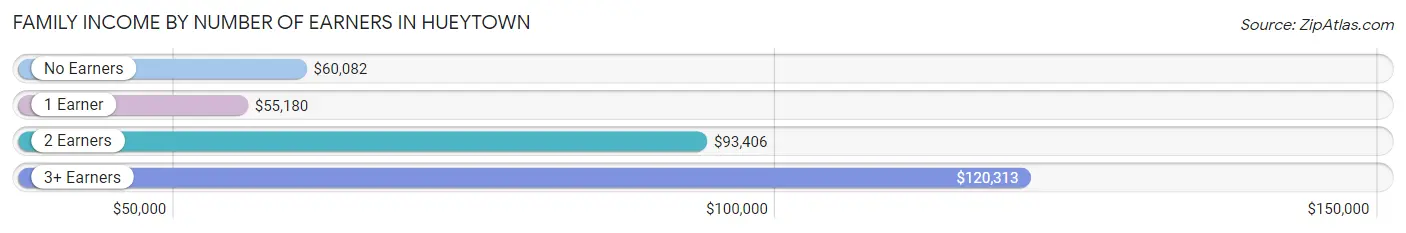
| Number of Earners | # Families | Median Income |
| No Earners | 669 (16.0%) | $60,082 |
| 1 Earner | 1,304 (31.2%) | $55,180 |
| 2 Earners | 1,744 (41.8%) | $93,406 |
| 3+ Earners | 456 (10.9%) | $120,313 |
| Total | 4,173 (100.0%) | $71,780 |
Household Income in Hueytown
Household Income Brackets in Hueytown
With 1,486 households falling in the category, the $50,000 to $74,999 income range is the most frequent in Hueytown, accounting for 25.6% of all households. In contrast, only 139 households (2.4%) fall into the $10,000 to $14,999 income bracket, making it the least populous group.
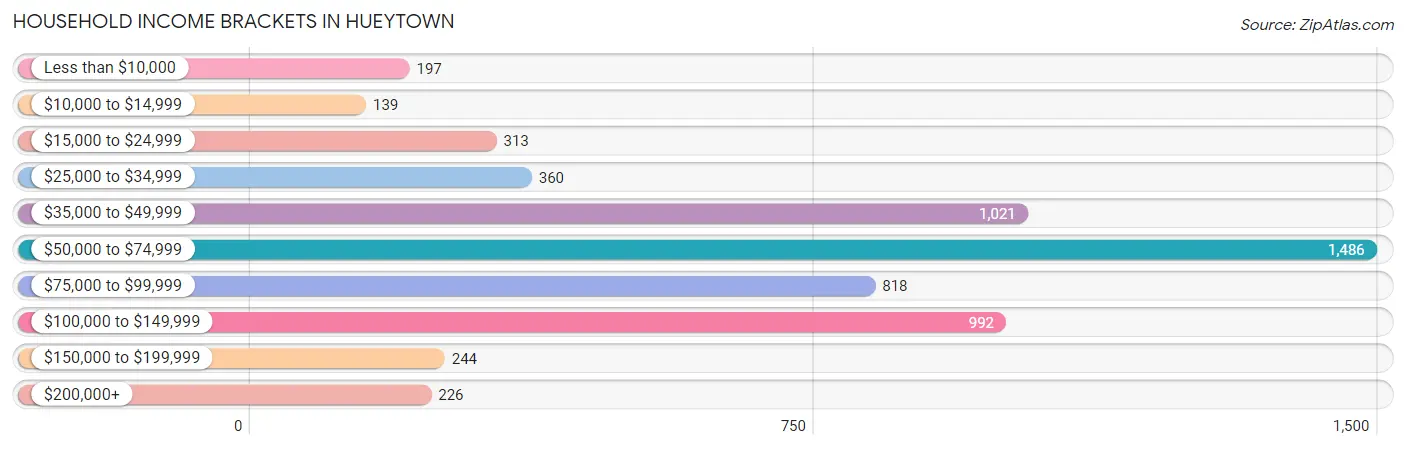
| Income Bracket | # Households | % Households |
| Less than $10,000 | 197 | 3.4% |
| $10,000 to $14,999 | 139 | 2.4% |
| $15,000 to $24,999 | 313 | 5.4% |
| $25,000 to $34,999 | 360 | 6.2% |
| $35,000 to $49,999 | 1,021 | 17.6% |
| $50,000 to $74,999 | 1,486 | 25.6% |
| $75,000 to $99,999 | 818 | 14.1% |
| $100,000 to $149,999 | 992 | 17.1% |
| $150,000 to $199,999 | 244 | 4.2% |
| $200,000+ | 226 | 3.9% |
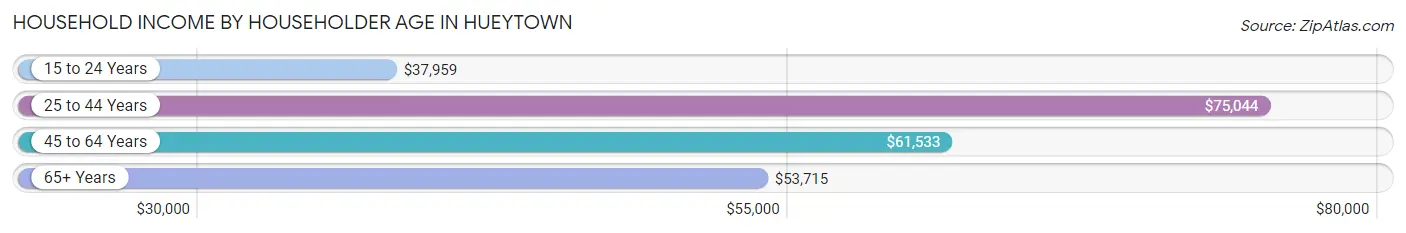
Household Income by Householder Age in Hueytown
The median household income in Hueytown is $64,176, with the highest median household income of $75,044 found in the 25 to 44 years age bracket for the primary householder. A total of 1,982 households (34.2%) fall into this category. Meanwhile, the 15 to 24 years age bracket for the primary householder has the lowest median household income of $37,959, with 172 households (3.0%) in this group.
| Income Bracket | # Households | Median Income |
| 15 to 24 Years | 172 (3.0%) | $37,959 |
| 25 to 44 Years | 1,982 (34.2%) | $75,044 |
| 45 to 64 Years | 1,979 (34.1%) | $61,533 |
| 65+ Years | 1,670 (28.8%) | $53,715 |
| Total | 5,803 (100.0%) | $64,176 |
Poverty in Hueytown
Income Below Poverty by Sex and Age in Hueytown
With 8.2% poverty level for males and 11.4% for females among the residents of Hueytown, under 5 year old males and 5 year old females are the most vulnerable to poverty, with 98 males (29.2%) and 23 females (63.9%) in their respective age groups living below the poverty level.
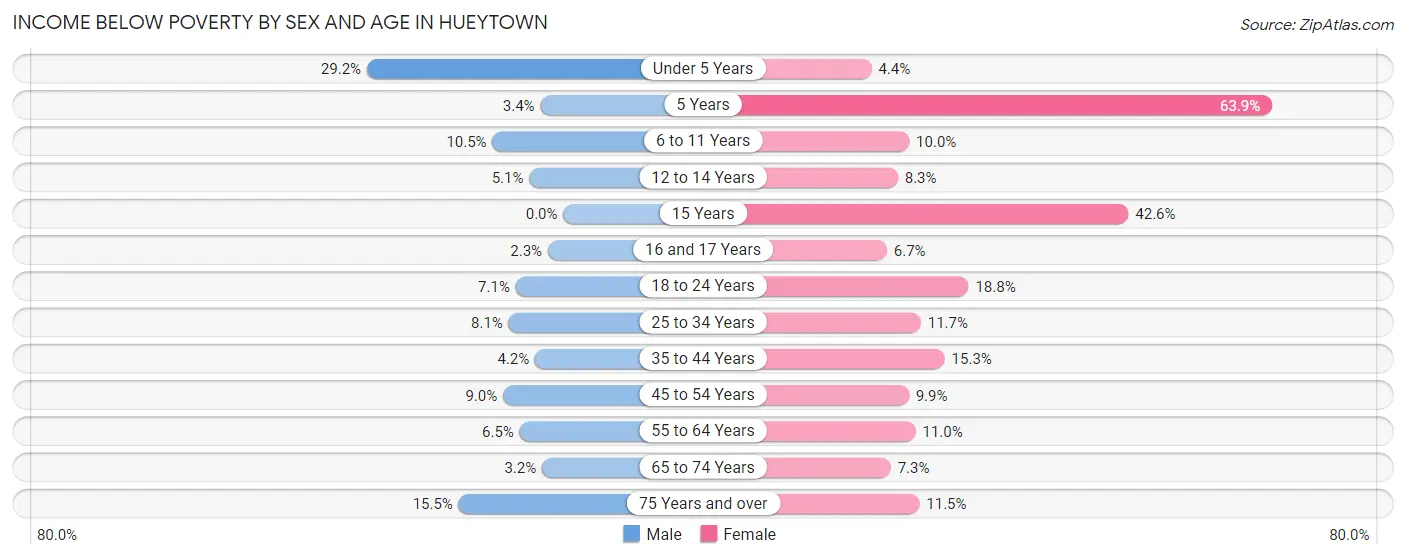
| Age Bracket | Male | Female |
| Under 5 Years | 98 (29.2%) | 36 (4.4%) |
| 5 Years | 5 (3.4%) | 23 (63.9%) |
| 6 to 11 Years | 75 (10.5%) | 82 (10.0%) |
| 12 to 14 Years | 13 (5.1%) | 36 (8.3%) |
| 15 Years | 0 (0.0%) | 40 (42.5%) |
| 16 and 17 Years | 7 (2.3%) | 19 (6.7%) |
| 18 to 24 Years | 37 (7.1%) | 126 (18.8%) |
| 25 to 34 Years | 115 (8.1%) | 128 (11.7%) |
| 35 to 44 Years | 35 (4.2%) | 192 (15.3%) |
| 45 to 54 Years | 85 (8.9%) | 95 (9.9%) |
| 55 to 64 Years | 49 (6.5%) | 106 (11.0%) |
| 65 to 74 Years | 23 (3.2%) | 62 (7.3%) |
| 75 Years and over | 69 (15.5%) | 69 (11.5%) |
| Total | 611 (8.2%) | 1,014 (11.4%) |
Income Above Poverty by Sex and Age in Hueytown
According to the poverty statistics in Hueytown, males aged 15 years and females aged under 5 years are the age groups that are most secure financially, with 100.0% of males and 95.6% of females in these age groups living above the poverty line.
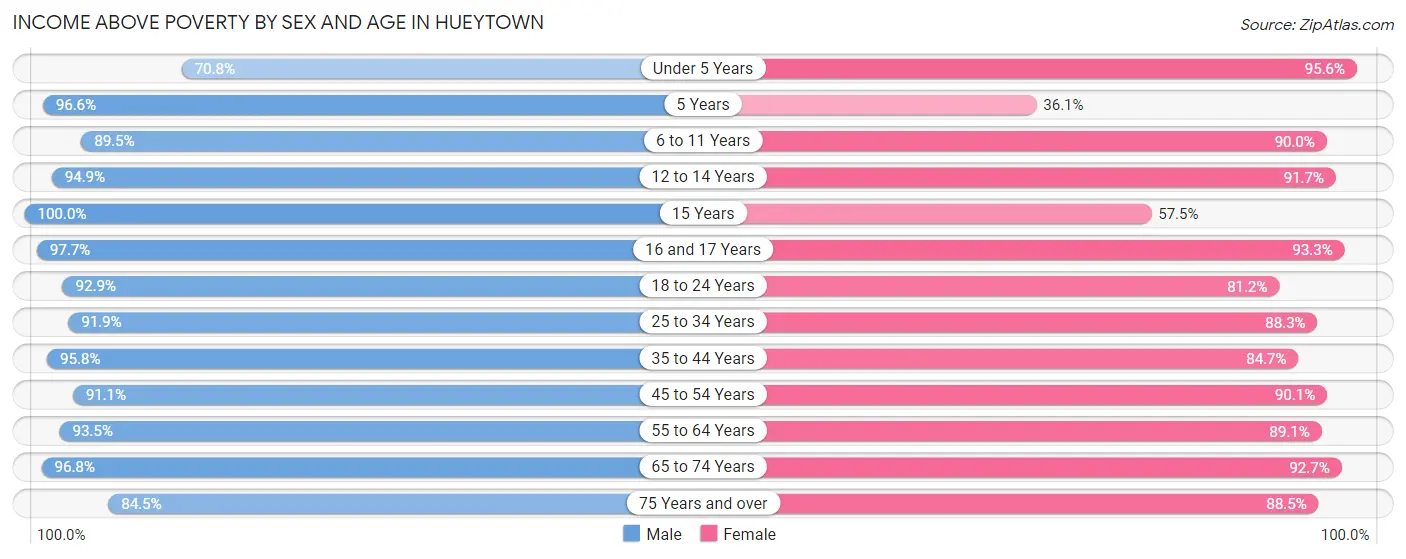
| Age Bracket | Male | Female |
| Under 5 Years | 238 (70.8%) | 783 (95.6%) |
| 5 Years | 142 (96.6%) | 13 (36.1%) |
| 6 to 11 Years | 637 (89.5%) | 738 (90.0%) |
| 12 to 14 Years | 244 (94.9%) | 397 (91.7%) |
| 15 Years | 23 (100.0%) | 54 (57.5%) |
| 16 and 17 Years | 299 (97.7%) | 265 (93.3%) |
| 18 to 24 Years | 486 (92.9%) | 544 (81.2%) |
| 25 to 34 Years | 1,302 (91.9%) | 963 (88.3%) |
| 35 to 44 Years | 801 (95.8%) | 1,065 (84.7%) |
| 45 to 54 Years | 865 (91.0%) | 861 (90.1%) |
| 55 to 64 Years | 706 (93.5%) | 862 (89.0%) |
| 65 to 74 Years | 706 (96.8%) | 792 (92.7%) |
| 75 Years and over | 375 (84.5%) | 530 (88.5%) |
| Total | 6,824 (91.8%) | 7,867 (88.6%) |
Income Below Poverty Among Married-Couple Families in Hueytown
The poverty statistics for married-couple families in Hueytown show that 2.5% or 73 of the total 2,874 families live below the poverty line. Families with 1 or 2 children have the highest poverty rate of 4.6%, comprising of 52 families. On the other hand, families with 3 or 4 children have the lowest poverty rate of 0.0%, which includes 0 families.
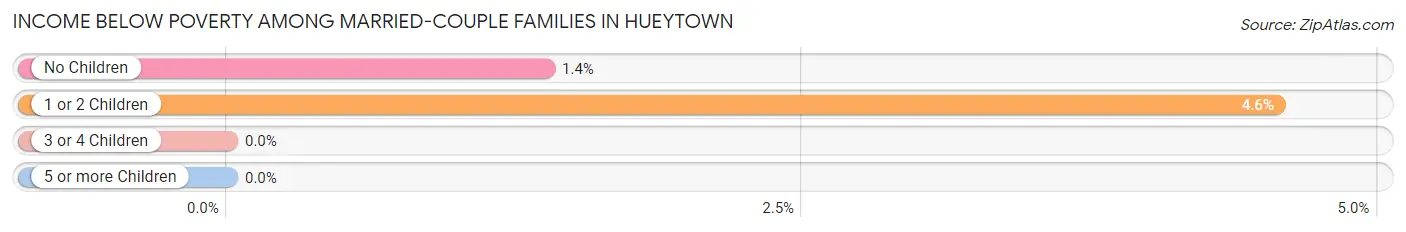
| Children | Above Poverty | Below Poverty |
| No Children | 1,502 (98.6%) | 21 (1.4%) |
| 1 or 2 Children | 1,089 (95.4%) | 52 (4.6%) |
| 3 or 4 Children | 185 (100.0%) | 0 (0.0%) |
| 5 or more Children | 25 (100.0%) | 0 (0.0%) |
| Total | 2,801 (97.5%) | 73 (2.5%) |
Income Below Poverty Among Single-Parent Households in Hueytown
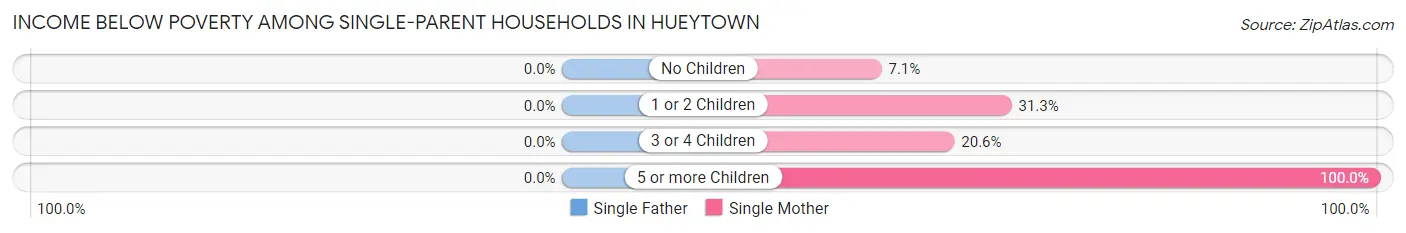
| Children | Single Father | Single Mother |
| No Children | 0 (0.0%) | 28 (7.0%) |
| 1 or 2 Children | 0 (0.0%) | 157 (31.3%) |
| 3 or 4 Children | 0 (0.0%) | 40 (20.6%) |
| 5 or more Children | 0 (0.0%) | 5 (100.0%) |
| Total | 0 (0.0%) | 230 (20.9%) |
Income Below Poverty Among Married-Couple vs Single-Parent Households in Hueytown
The poverty data for Hueytown shows that 73 of the married-couple family households (2.5%) and 230 of the single-parent households (17.7%) are living below the poverty level. Within the married-couple family households, those with 1 or 2 children have the highest poverty rate, with 52 households (4.6%) falling below the poverty line. Among the single-parent households, those with 5 or more children have the highest poverty rate, with 5 household (100.0%) living below poverty.
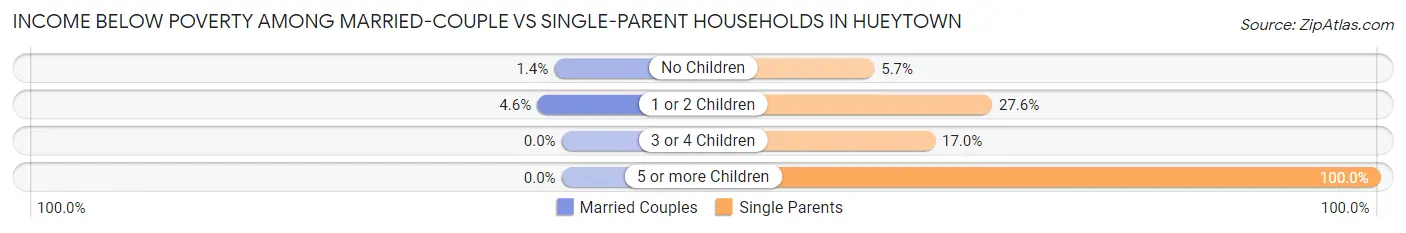
| Children | Married-Couple Families | Single-Parent Households |
| No Children | 21 (1.4%) | 28 (5.7%) |
| 1 or 2 Children | 52 (4.6%) | 157 (27.6%) |
| 3 or 4 Children | 0 (0.0%) | 40 (17.0%) |
| 5 or more Children | 0 (0.0%) | 5 (100.0%) |
| Total | 73 (2.5%) | 230 (17.7%) |
Race in Hueytown
The most populous races in Hueytown are White / Caucasian (8,741 | 52.5%), Black / African American (6,795 | 40.8%), and Hispanic or Latino (882 | 5.3%).
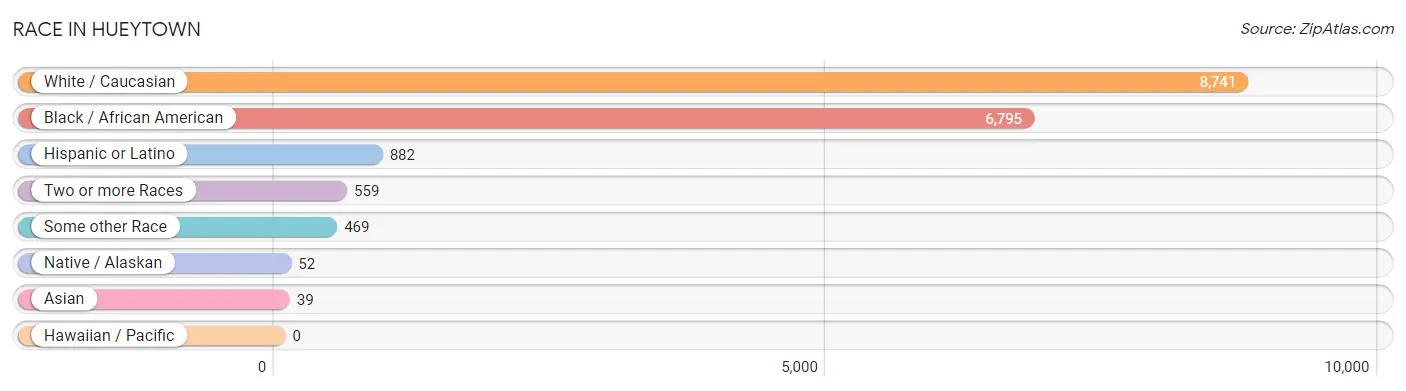
| Race | # Population | % Population |
| Asian | 39 | 0.2% |
| Black / African American | 6,795 | 40.8% |
| Hawaiian / Pacific | 0 | 0.0% |
| Hispanic or Latino | 882 | 5.3% |
| Native / Alaskan | 52 | 0.3% |
| White / Caucasian | 8,741 | 52.5% |
| Two or more Races | 559 | 3.4% |
| Some other Race | 469 | 2.8% |
| Total | 16,655 | 100.0% |
Ancestry in Hueytown
The most populous ancestries reported in Hueytown are American (2,110 | 12.7%), English (1,422 | 8.5%), Irish (1,205 | 7.2%), Mexican (632 | 3.8%), and Italian (502 | 3.0%), together accounting for 35.3% of all Hueytown residents.
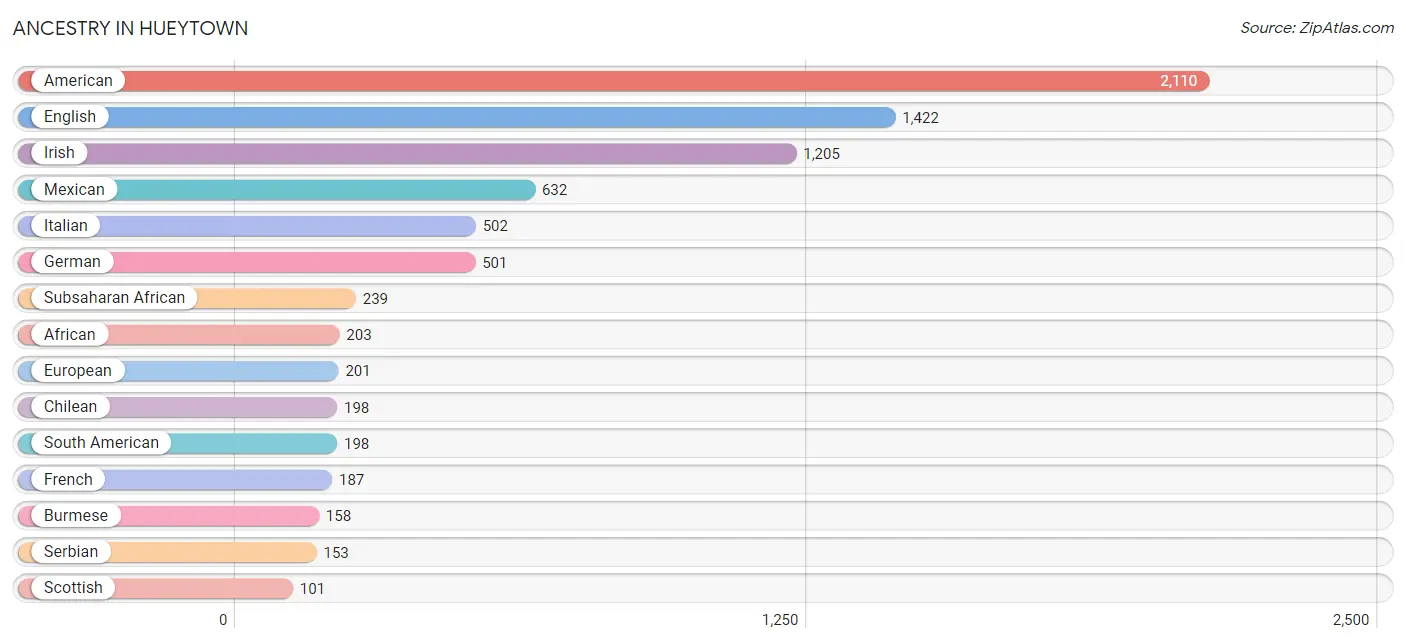
| Ancestry | # Population | % Population |
| African | 203 | 1.2% |
| American | 2,110 | 12.7% |
| Austrian | 6 | 0.0% |
| Blackfeet | 40 | 0.2% |
| British | 79 | 0.5% |
| Burmese | 158 | 0.9% |
| Central American | 47 | 0.3% |
| Central American Indian | 5 | 0.0% |
| Cherokee | 54 | 0.3% |
| Chilean | 198 | 1.2% |
| Croatian | 60 | 0.4% |
| Crow | 6 | 0.0% |
| Dutch | 60 | 0.4% |
| Eastern European | 1 | 0.0% |
| English | 1,422 | 8.5% |
| European | 201 | 1.2% |
| French | 187 | 1.1% |
| French Canadian | 97 | 0.6% |
| German | 501 | 3.0% |
| Greek | 6 | 0.0% |
| Haitian | 12 | 0.1% |
| Honduran | 42 | 0.3% |
| Irish | 1,205 | 7.2% |
| Italian | 502 | 3.0% |
| Jamaican | 16 | 0.1% |
| Kenyan | 20 | 0.1% |
| Korean | 44 | 0.3% |
| Mexican | 632 | 3.8% |
| Mexican American Indian | 60 | 0.4% |
| Native Hawaiian | 8 | 0.1% |
| Navajo | 3 | 0.0% |
| Nigerian | 16 | 0.1% |
| Polish | 18 | 0.1% |
| Puerto Rican | 5 | 0.0% |
| Salvadoran | 5 | 0.0% |
| Scotch-Irish | 95 | 0.6% |
| Scottish | 101 | 0.6% |
| Serbian | 153 | 0.9% |
| South American | 198 | 1.2% |
| Subsaharan African | 239 | 1.4% |
| Swedish | 11 | 0.1% |
| Welsh | 67 | 0.4% |
| West Indian | 5 | 0.0% | View All 43 Rows |
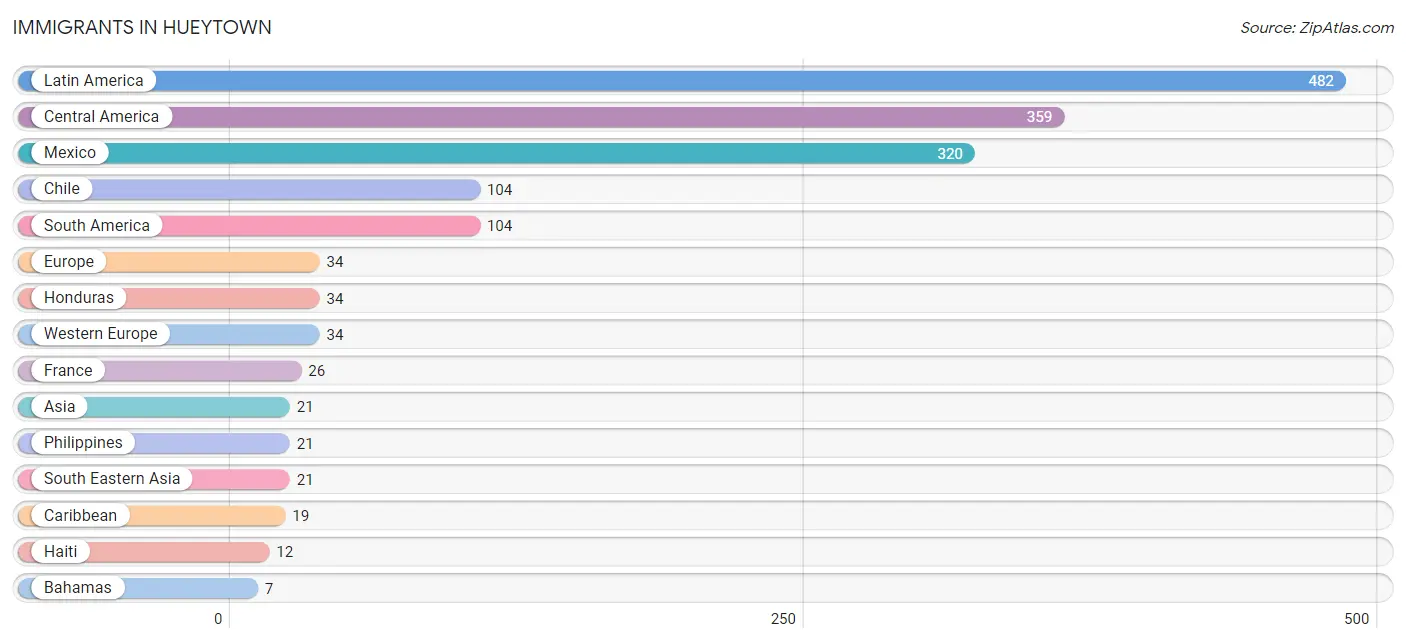
Immigrants in Hueytown
The most numerous immigrant groups reported in Hueytown came from Latin America (482 | 2.9%), Central America (359 | 2.2%), Mexico (320 | 1.9%), Chile (104 | 0.6%), and South America (104 | 0.6%), together accounting for 8.2% of all Hueytown residents.
| Immigration Origin | # Population | % Population |
| Africa | 5 | 0.0% |
| Asia | 21 | 0.1% |
| Austria | 3 | 0.0% |
| Bahamas | 7 | 0.0% |
| Canada | 7 | 0.0% |
| Caribbean | 19 | 0.1% |
| Central America | 359 | 2.2% |
| Chile | 104 | 0.6% |
| Eastern Africa | 5 | 0.0% |
| El Salvador | 5 | 0.0% |
| Europe | 34 | 0.2% |
| France | 26 | 0.2% |
| Germany | 5 | 0.0% |
| Haiti | 12 | 0.1% |
| Honduras | 34 | 0.2% |
| Kenya | 5 | 0.0% |
| Latin America | 482 | 2.9% |
| Mexico | 320 | 1.9% |
| Philippines | 21 | 0.1% |
| South America | 104 | 0.6% |
| South Eastern Asia | 21 | 0.1% |
| Western Europe | 34 | 0.2% | View All 22 Rows |
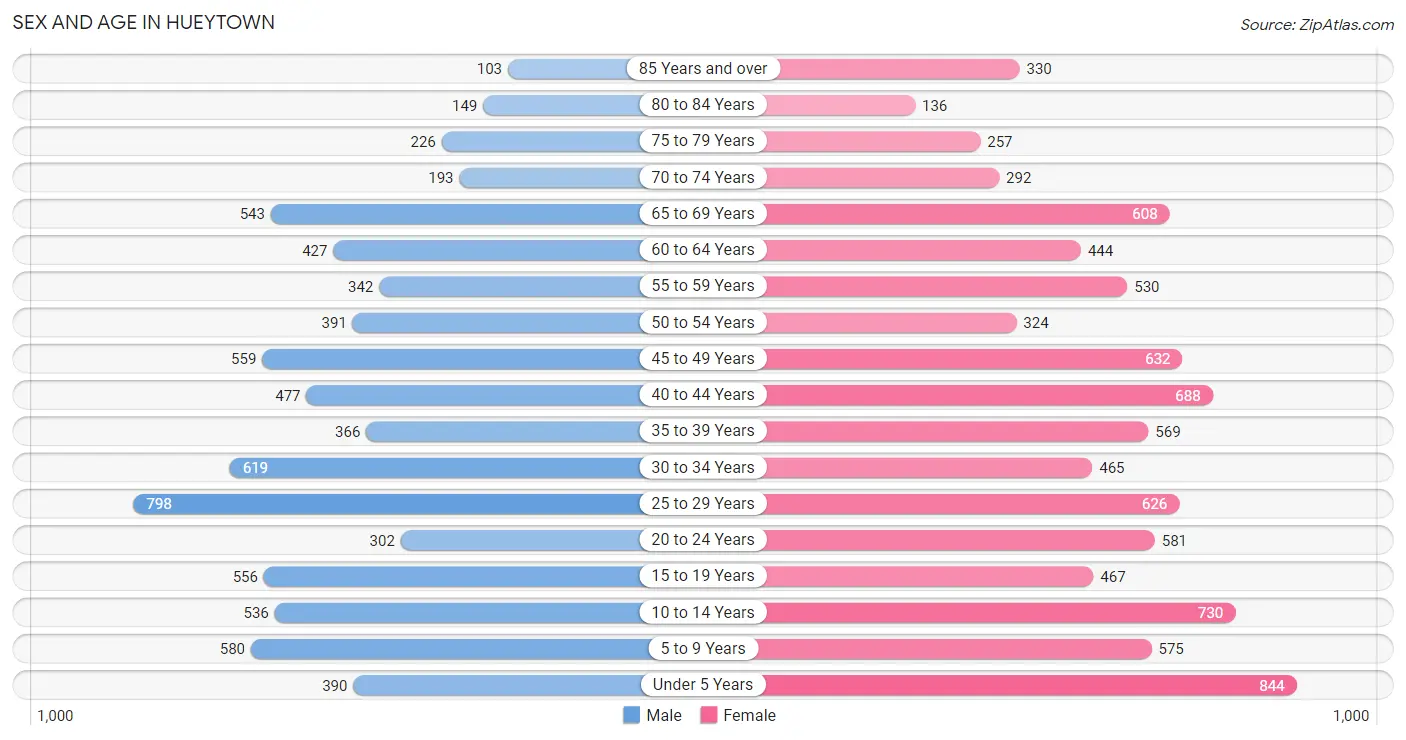
Sex and Age in Hueytown
Sex and Age in Hueytown
The most populous age groups in Hueytown are 25 to 29 Years (798 | 10.6%) for men and Under 5 Years (844 | 9.3%) for women.
| Age Bracket | Male | Female |
| Under 5 Years | 390 (5.2%) | 844 (9.3%) |
| 5 to 9 Years | 580 (7.7%) | 575 (6.3%) |
| 10 to 14 Years | 536 (7.1%) | 730 (8.0%) |
| 15 to 19 Years | 556 (7.4%) | 467 (5.1%) |
| 20 to 24 Years | 302 (4.0%) | 581 (6.4%) |
| 25 to 29 Years | 798 (10.6%) | 626 (6.9%) |
| 30 to 34 Years | 619 (8.2%) | 465 (5.1%) |
| 35 to 39 Years | 366 (4.8%) | 569 (6.2%) |
| 40 to 44 Years | 477 (6.3%) | 688 (7.6%) |
| 45 to 49 Years | 559 (7.4%) | 632 (7.0%) |
| 50 to 54 Years | 391 (5.2%) | 324 (3.6%) |
| 55 to 59 Years | 342 (4.5%) | 530 (5.8%) |
| 60 to 64 Years | 427 (5.7%) | 444 (4.9%) |
| 65 to 69 Years | 543 (7.2%) | 608 (6.7%) |
| 70 to 74 Years | 193 (2.5%) | 292 (3.2%) |
| 75 to 79 Years | 226 (3.0%) | 257 (2.8%) |
| 80 to 84 Years | 149 (2.0%) | 136 (1.5%) |
| 85 Years and over | 103 (1.4%) | 330 (3.6%) |
| Total | 7,557 (100.0%) | 9,098 (100.0%) |
Families and Households in Hueytown
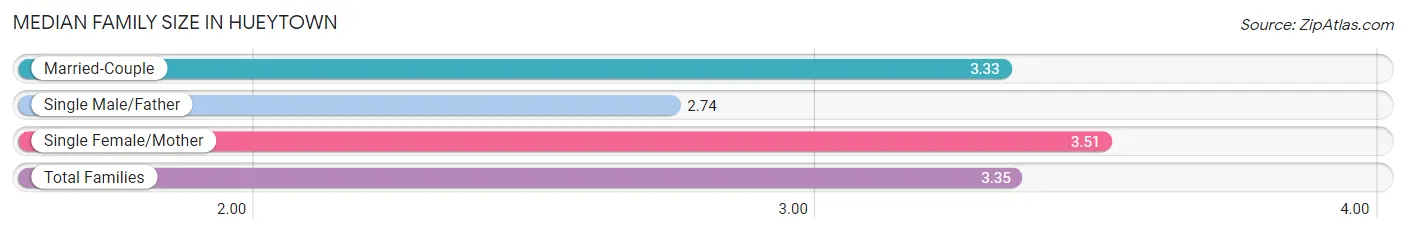
Median Family Size in Hueytown
The median family size in Hueytown is 3.35 persons per family, with single female/mother families (1,098 | 26.3%) accounting for the largest median family size of 3.51 persons per family. On the other hand, single male/father families (201 | 4.8%) represent the smallest median family size with 2.74 persons per family.
| Family Type | # Families | Family Size |
| Married-Couple | 2,874 (68.9%) | 3.33 |
| Single Male/Father | 201 (4.8%) | 2.74 |
| Single Female/Mother | 1,098 (26.3%) | 3.51 |
| Total Families | 4,173 (100.0%) | 3.35 |
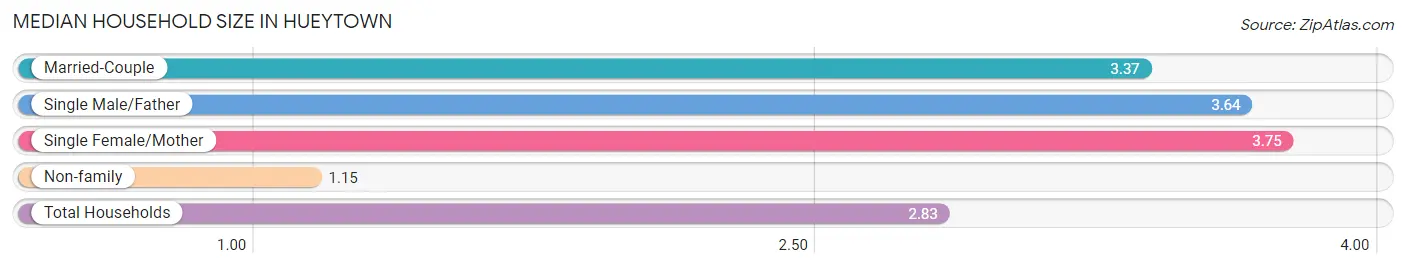
Median Household Size in Hueytown
The median household size in Hueytown is 2.83 persons per household, with single female/mother households (1,098 | 18.9%) accounting for the largest median household size of 3.75 persons per household. non-family households (1,630 | 28.1%) represent the smallest median household size with 1.15 persons per household.
| Household Type | # Households | Household Size |
| Married-Couple | 2,874 (49.5%) | 3.37 |
| Single Male/Father | 201 (3.5%) | 3.64 |
| Single Female/Mother | 1,098 (18.9%) | 3.75 |
| Non-family | 1,630 (28.1%) | 1.15 |
| Total Households | 5,803 (100.0%) | 2.83 |
Household Size by Marriage Status in Hueytown
Out of a total of 5,803 households in Hueytown, 4,173 (71.9%) are family households, while 1,630 (28.1%) are nonfamily households. The most numerous type of family households are 2-person households, comprising 1,507, and the most common type of nonfamily households are 1-person households, comprising 1,468.
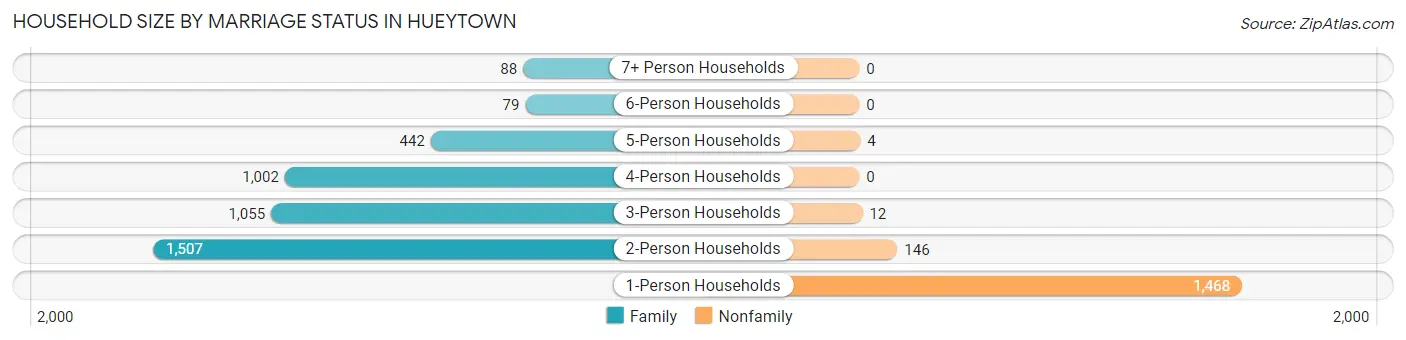
| Household Size | Family Households | Nonfamily Households |
| 1-Person Households | - | 1,468 (25.3%) |
| 2-Person Households | 1,507 (26.0%) | 146 (2.5%) |
| 3-Person Households | 1,055 (18.2%) | 12 (0.2%) |
| 4-Person Households | 1,002 (17.3%) | 0 (0.0%) |
| 5-Person Households | 442 (7.6%) | 4 (0.1%) |
| 6-Person Households | 79 (1.4%) | 0 (0.0%) |
| 7+ Person Households | 88 (1.5%) | 0 (0.0%) |
| Total | 4,173 (71.9%) | 1,630 (28.1%) |
Female Fertility in Hueytown
Fertility by Age in Hueytown
Average fertility rate in Hueytown is 81.0 births per 1,000 women. Women in the age bracket of 20 to 34 years have the highest fertility rate with 195.0 births per 1,000 women. Women in the age bracket of 20 to 34 years acount for 94.8% of all women with births.
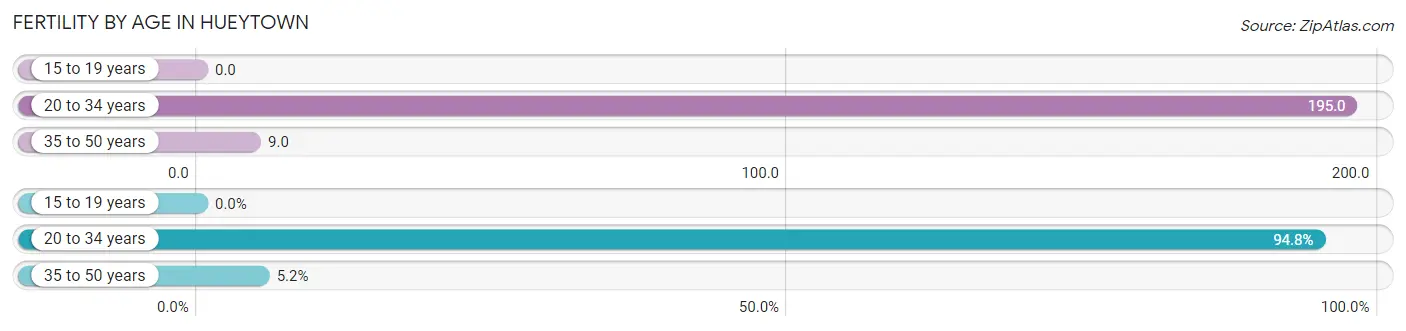
| Age Bracket | Women with Births | Births / 1,000 Women |
| 15 to 19 years | 0 (0.0%) | 0.0 |
| 20 to 34 years | 326 (94.8%) | 195.0 |
| 35 to 50 years | 18 (5.2%) | 9.0 |
| Total | 344 (100.0%) | 81.0 |
Fertility by Age by Marriage Status in Hueytown
53.5% of women with births (344) in Hueytown are married. The highest percentage of unmarried women with births falls into 20 to 34 years age bracket with 49.1% of them unmarried at the time of birth, while the lowest percentage of unmarried women with births belong to 35 to 50 years age bracket with 0.0% of them unmarried.
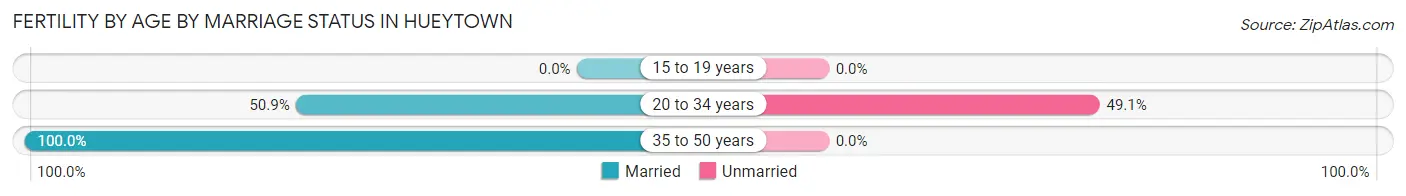
| Age Bracket | Married | Unmarried |
| 15 to 19 years | 0 (0.0%) | 0 (0.0%) |
| 20 to 34 years | 166 (50.9%) | 160 (49.1%) |
| 35 to 50 years | 18 (100.0%) | 0 (0.0%) |
| Total | 184 (53.5%) | 160 (46.5%) |
Fertility by Education in Hueytown
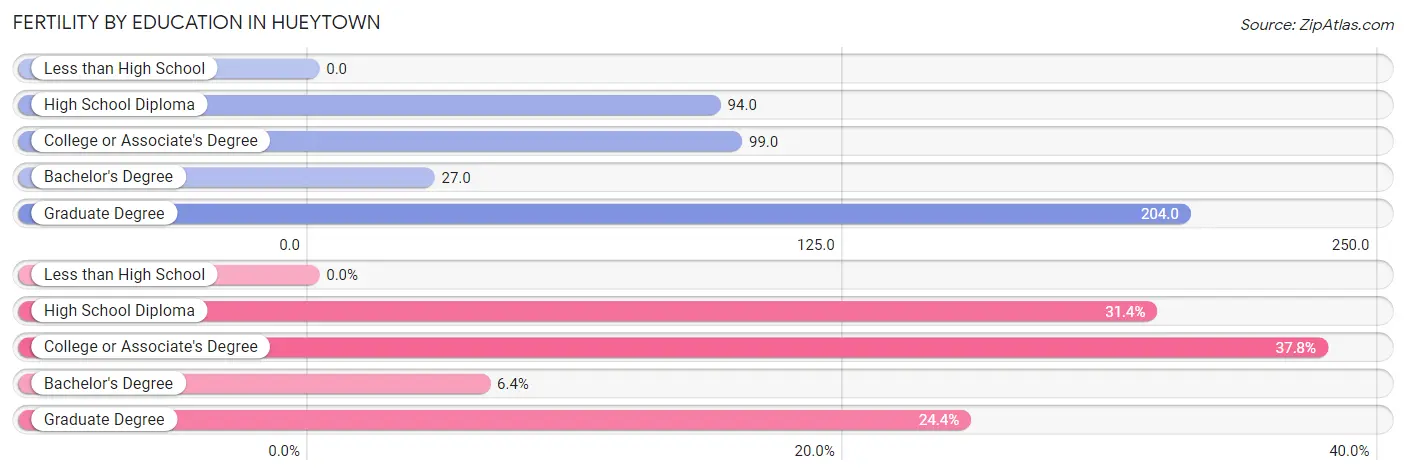
| Educational Attainment | Women with Births | Births / 1,000 Women |
| Less than High School | 0 (0.0%) | 0.0 |
| High School Diploma | 108 (31.4%) | 94.0 |
| College or Associate's Degree | 130 (37.8%) | 99.0 |
| Bachelor's Degree | 22 (6.4%) | 27.0 |
| Graduate Degree | 84 (24.4%) | 204.0 |
| Total | 344 (100.0%) | 81.0 |
Fertility by Education by Marriage Status in Hueytown
46.5% of women with births in Hueytown are unmarried. Women with the educational attainment of bachelor's degree are most likely to be married with 100.0% of them married at childbirth, while women with the educational attainment of graduate degree are least likely to be married with 86.9% of them unmarried at childbirth.
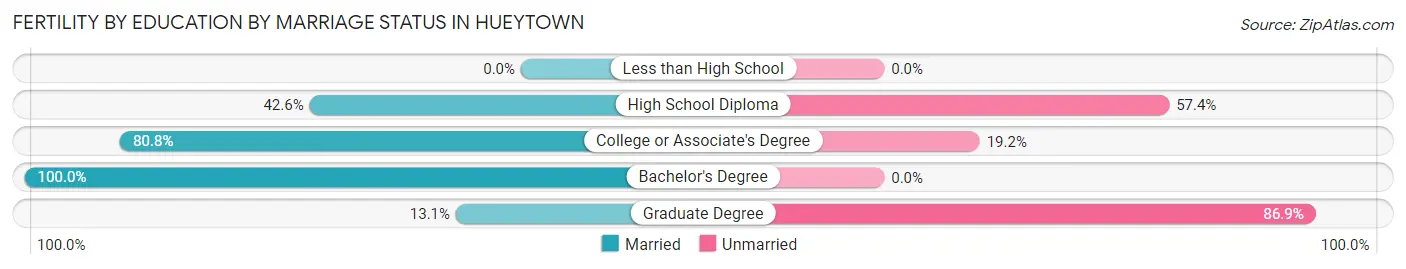
| Educational Attainment | Married | Unmarried |
| Less than High School | 0 (0.0%) | 0 (0.0%) |
| High School Diploma | 46 (42.6%) | 62 (57.4%) |
| College or Associate's Degree | 105 (80.8%) | 25 (19.2%) |
| Bachelor's Degree | 22 (100.0%) | 0 (0.0%) |
| Graduate Degree | 11 (13.1%) | 73 (86.9%) |
| Total | 184 (53.5%) | 160 (46.5%) |
Employment Characteristics in Hueytown
Employment by Class of Employer in Hueytown
Among the 7,252 employed individuals in Hueytown, private company employees (5,303 | 73.1%), local government employees (553 | 7.6%), and not-for-profit organizations (416 | 5.7%) make up the most common classes of employment.
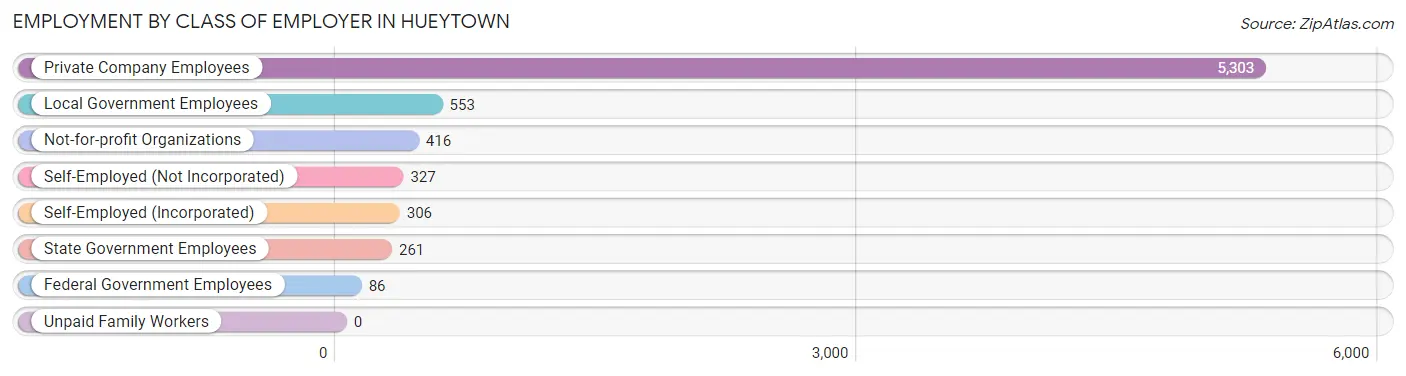
| Employer Class | # Employees | % Employees |
| Private Company Employees | 5,303 | 73.1% |
| Self-Employed (Incorporated) | 306 | 4.2% |
| Self-Employed (Not Incorporated) | 327 | 4.5% |
| Not-for-profit Organizations | 416 | 5.7% |
| Local Government Employees | 553 | 7.6% |
| State Government Employees | 261 | 3.6% |
| Federal Government Employees | 86 | 1.2% |
| Unpaid Family Workers | 0 | 0.0% |
| Total | 7,252 | 100.0% |
Employment Status by Age in Hueytown
According to the labor force statistics for Hueytown, out of the total population over 16 years of age (12,883), 62.2% or 8,013 individuals are in the labor force, with 7.8% or 625 of them unemployed. The age group with the highest labor force participation rate is 30 to 34 years, with 90.6% or 982 individuals in the labor force. Within the labor force, the 20 to 24 years age range has the highest percentage of unemployed individuals, with 21.3% or 137 of them being unemployed.
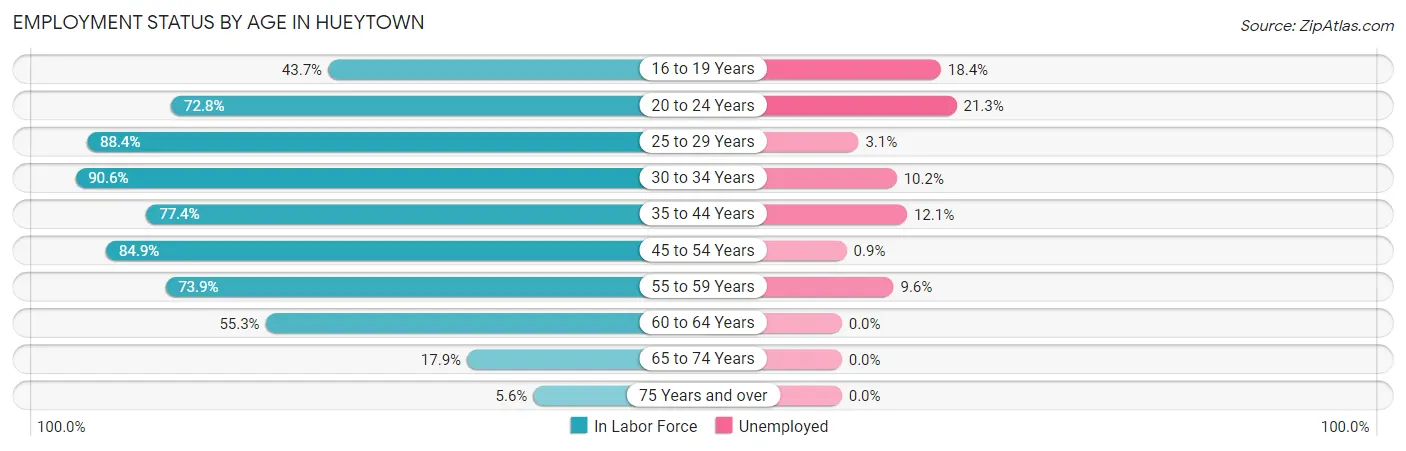
| Age Bracket | In Labor Force | Unemployed |
| 16 to 19 Years | 396 (43.7%) | 73 (18.4%) |
| 20 to 24 Years | 643 (72.8%) | 137 (21.3%) |
| 25 to 29 Years | 1,259 (88.4%) | 39 (3.1%) |
| 30 to 34 Years | 982 (90.6%) | 100 (10.2%) |
| 35 to 44 Years | 1,625 (77.4%) | 197 (12.1%) |
| 45 to 54 Years | 1,618 (84.9%) | 15 (0.9%) |
| 55 to 59 Years | 644 (73.9%) | 62 (9.6%) |
| 60 to 64 Years | 482 (55.3%) | 0 (0.0%) |
| 65 to 74 Years | 293 (17.9%) | 0 (0.0%) |
| 75 Years and over | 67 (5.6%) | 0 (0.0%) |
| Total | 8,013 (62.2%) | 625 (7.8%) |
Employment Status by Educational Attainment in Hueytown
According to labor force statistics for Hueytown, 80.1% of individuals (6,614) out of the total population between 25 and 64 years of age (8,257) are in the labor force, with 6.2% or 410 of them being unemployed. The group with the highest labor force participation rate are those with the educational attainment of bachelor's degree or higher, with 90.9% or 1,933 individuals in the labor force. Within the labor force, individuals with less than high school education have the highest percentage of unemployment, with 20.2% or 93 of them being unemployed.
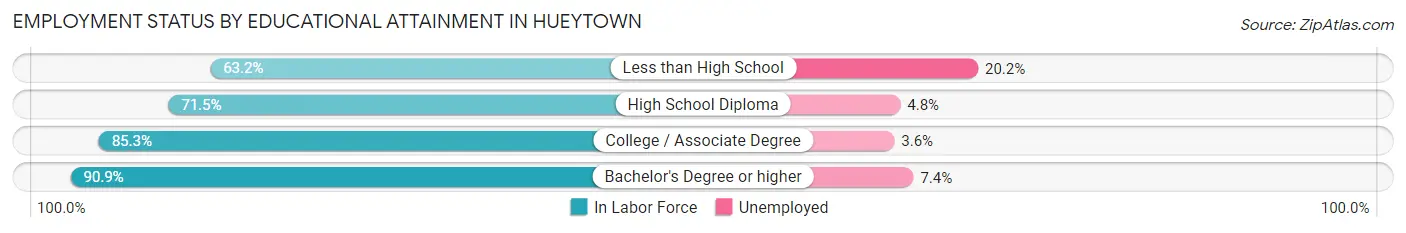
| Educational Attainment | In Labor Force | Unemployed |
| Less than High School | 461 (63.2%) | 147 (20.2%) |
| High School Diploma | 2,012 (71.5%) | 135 (4.8%) |
| College / Associate Degree | 2,207 (85.3%) | 93 (3.6%) |
| Bachelor's Degree or higher | 1,933 (90.9%) | 157 (7.4%) |
| Total | 6,614 (80.1%) | 512 (6.2%) |
Employment Occupations by Sex in Hueytown
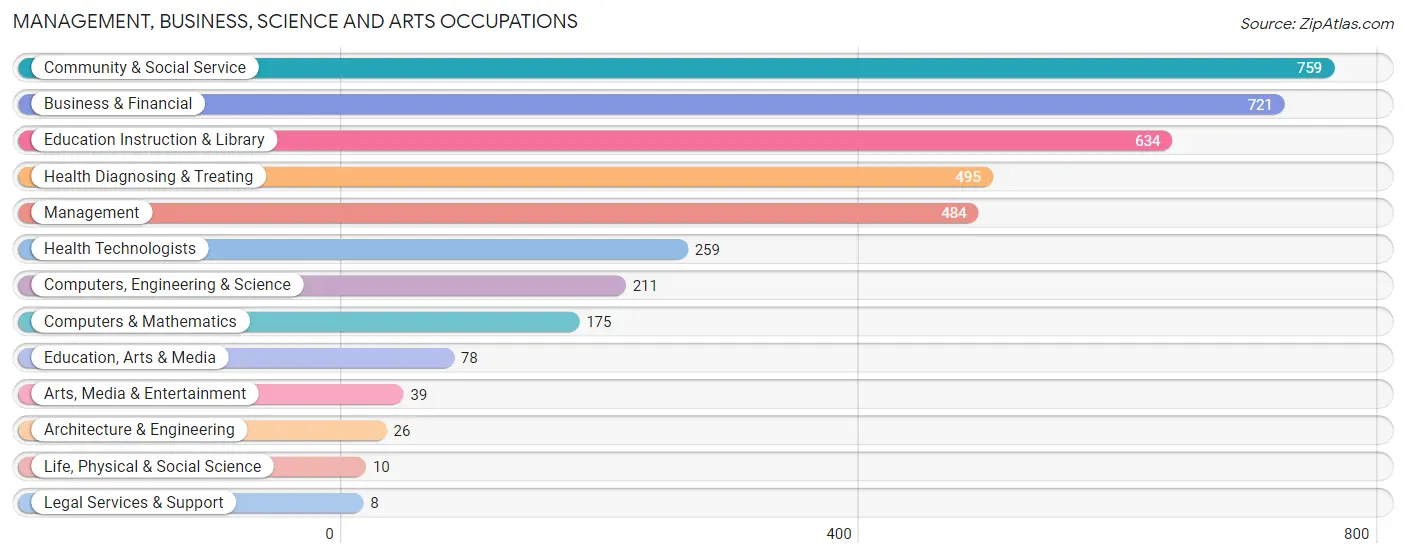
Management, Business, Science and Arts Occupations
The most common Management, Business, Science and Arts occupations in Hueytown are Community & Social Service (759 | 10.3%), Business & Financial (721 | 9.8%), Education Instruction & Library (634 | 8.6%), Health Diagnosing & Treating (495 | 6.7%), and Management (484 | 6.6%).
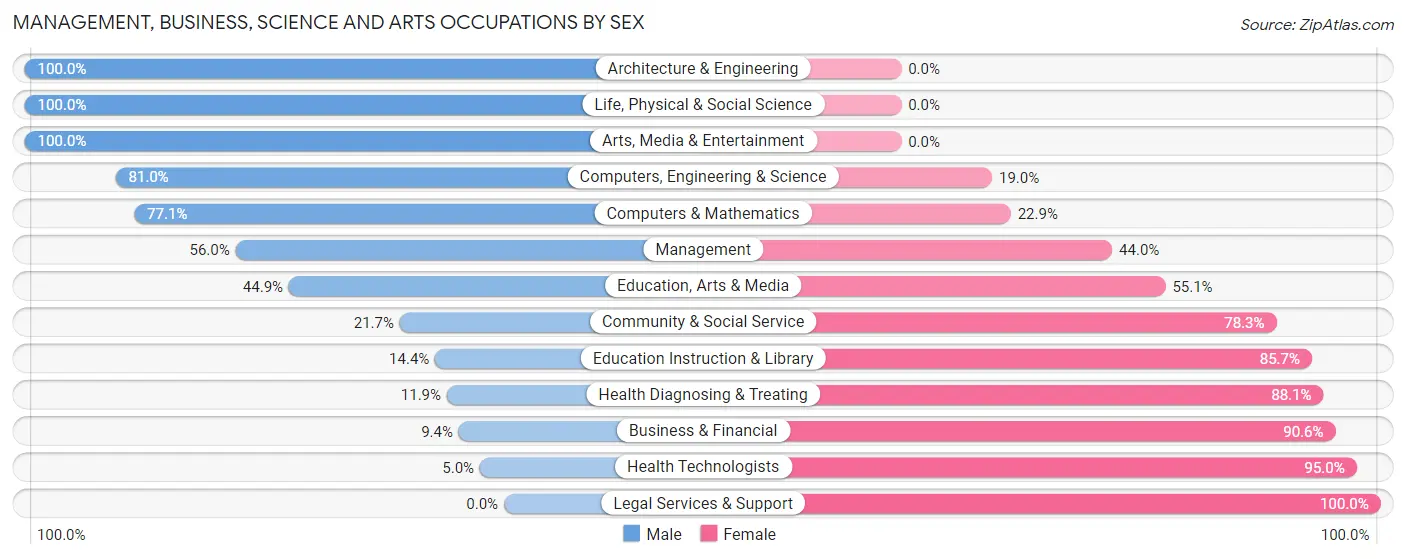
Management, Business, Science and Arts Occupations by Sex
Within the Management, Business, Science and Arts occupations in Hueytown, the most male-oriented occupations are Architecture & Engineering (100.0%), Life, Physical & Social Science (100.0%), and Arts, Media & Entertainment (100.0%), while the most female-oriented occupations are Legal Services & Support (100.0%), Health Technologists (95.0%), and Business & Financial (90.6%).
| Occupation | Male | Female |
| Management | 271 (56.0%) | 213 (44.0%) |
| Business & Financial | 68 (9.4%) | 653 (90.6%) |
| Computers, Engineering & Science | 171 (81.0%) | 40 (19.0%) |
| Computers & Mathematics | 135 (77.1%) | 40 (22.9%) |
| Architecture & Engineering | 26 (100.0%) | 0 (0.0%) |
| Life, Physical & Social Science | 10 (100.0%) | 0 (0.0%) |
| Community & Social Service | 165 (21.7%) | 594 (78.3%) |
| Education, Arts & Media | 35 (44.9%) | 43 (55.1%) |
| Legal Services & Support | 0 (0.0%) | 8 (100.0%) |
| Education Instruction & Library | 91 (14.3%) | 543 (85.7%) |
| Arts, Media & Entertainment | 39 (100.0%) | 0 (0.0%) |
| Health Diagnosing & Treating | 59 (11.9%) | 436 (88.1%) |
| Health Technologists | 13 (5.0%) | 246 (95.0%) |
| Total (Category) | 734 (27.5%) | 1,936 (72.5%) |
| Total (Overall) | 3,629 (49.1%) | 3,760 (50.9%) |
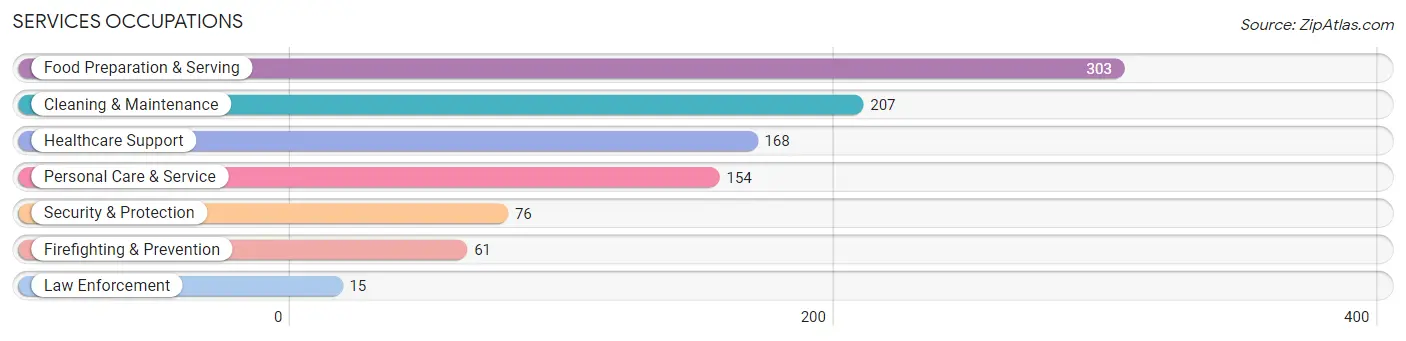
Services Occupations
The most common Services occupations in Hueytown are Food Preparation & Serving (303 | 4.1%), Cleaning & Maintenance (207 | 2.8%), Healthcare Support (168 | 2.3%), Personal Care & Service (154 | 2.1%), and Security & Protection (76 | 1.0%).
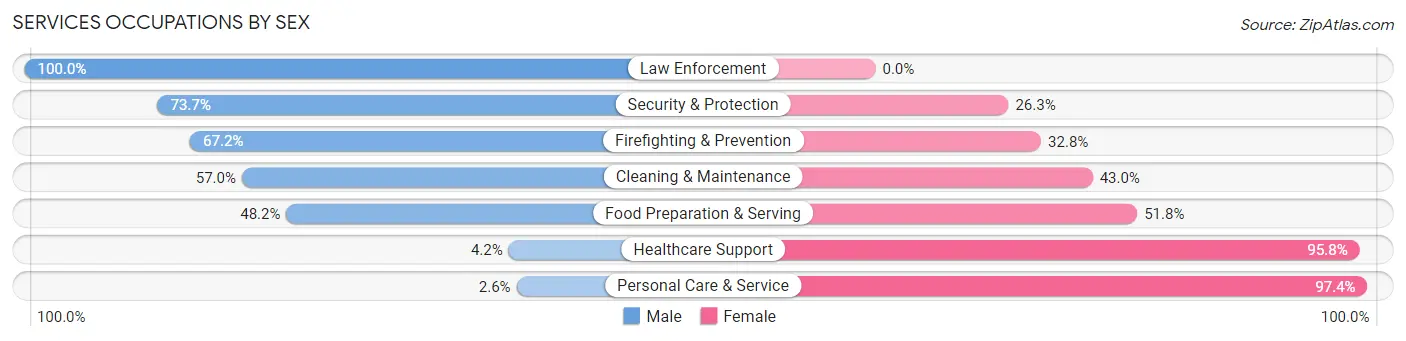
Services Occupations by Sex
Within the Services occupations in Hueytown, the most male-oriented occupations are Law Enforcement (100.0%), Security & Protection (73.7%), and Firefighting & Prevention (67.2%), while the most female-oriented occupations are Personal Care & Service (97.4%), Healthcare Support (95.8%), and Food Preparation & Serving (51.8%).
| Occupation | Male | Female |
| Healthcare Support | 7 (4.2%) | 161 (95.8%) |
| Security & Protection | 56 (73.7%) | 20 (26.3%) |
| Firefighting & Prevention | 41 (67.2%) | 20 (32.8%) |
| Law Enforcement | 15 (100.0%) | 0 (0.0%) |
| Food Preparation & Serving | 146 (48.2%) | 157 (51.8%) |
| Cleaning & Maintenance | 118 (57.0%) | 89 (43.0%) |
| Personal Care & Service | 4 (2.6%) | 150 (97.4%) |
| Total (Category) | 331 (36.4%) | 577 (63.5%) |
| Total (Overall) | 3,629 (49.1%) | 3,760 (50.9%) |
Sales and Office Occupations
The most common Sales and Office occupations in Hueytown are Office & Administration (1,004 | 13.6%), and Sales & Related (475 | 6.4%).
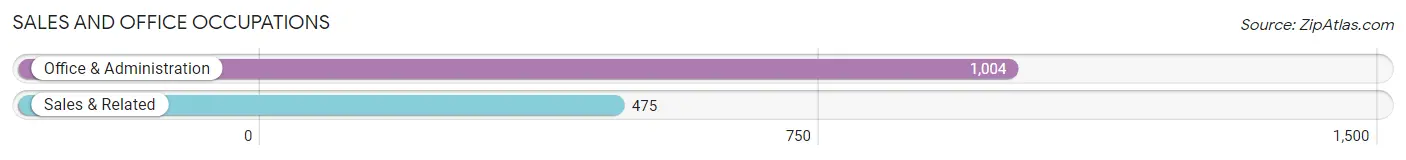
Sales and Office Occupations by Sex
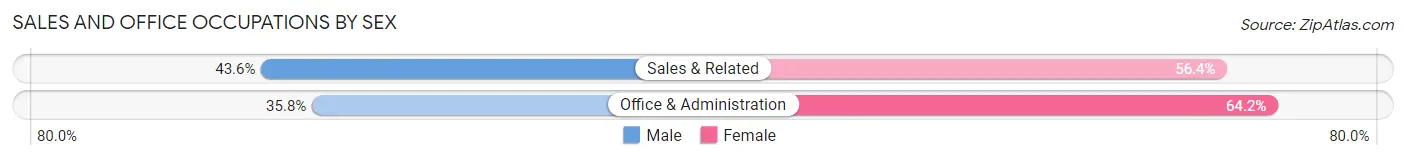
| Occupation | Male | Female |
| Sales & Related | 207 (43.6%) | 268 (56.4%) |
| Office & Administration | 359 (35.8%) | 645 (64.2%) |
| Total (Category) | 566 (38.3%) | 913 (61.7%) |
| Total (Overall) | 3,629 (49.1%) | 3,760 (50.9%) |
Natural Resources, Construction and Maintenance Occupations
The most common Natural Resources, Construction and Maintenance occupations in Hueytown are Installation, Maintenance & Repair (630 | 8.5%), Construction & Extraction (445 | 6.0%), and Farming, Fishing & Forestry (28 | 0.4%).
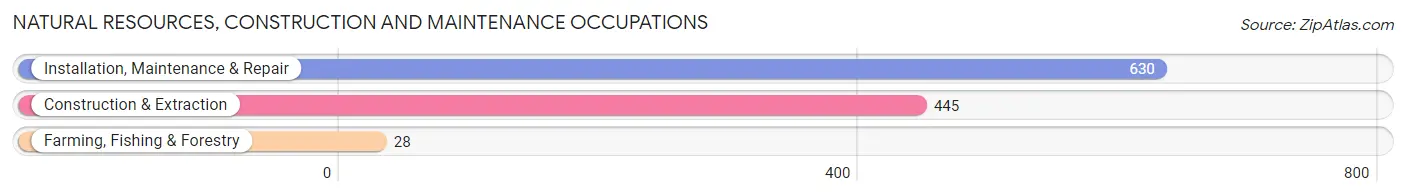
Natural Resources, Construction and Maintenance Occupations by Sex
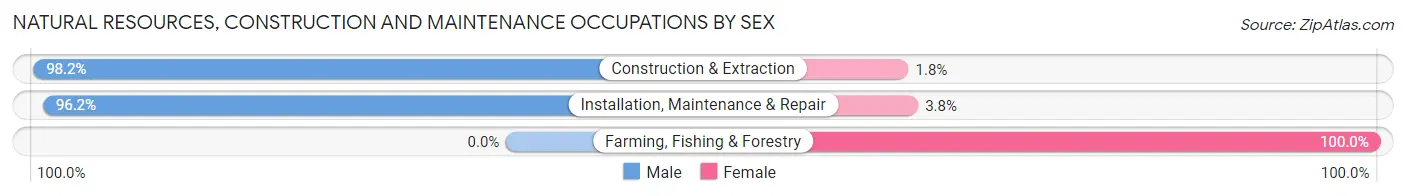
| Occupation | Male | Female |
| Farming, Fishing & Forestry | 0 (0.0%) | 28 (100.0%) |
| Construction & Extraction | 437 (98.2%) | 8 (1.8%) |
| Installation, Maintenance & Repair | 606 (96.2%) | 24 (3.8%) |
| Total (Category) | 1,043 (94.6%) | 60 (5.4%) |
| Total (Overall) | 3,629 (49.1%) | 3,760 (50.9%) |
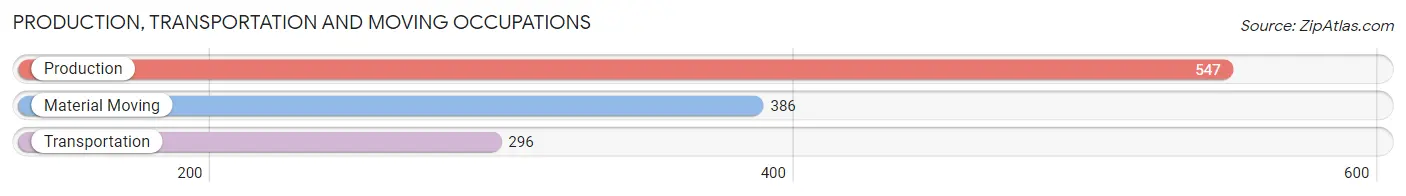
Production, Transportation and Moving Occupations
The most common Production, Transportation and Moving occupations in Hueytown are Production (547 | 7.4%), Material Moving (386 | 5.2%), and Transportation (296 | 4.0%).
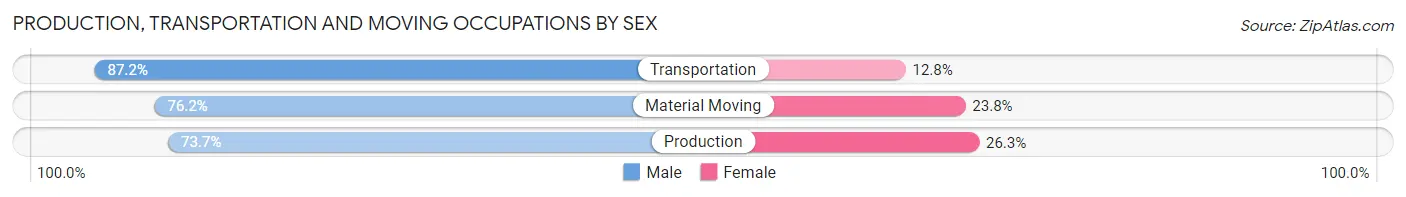
Production, Transportation and Moving Occupations by Sex
| Occupation | Male | Female |
| Production | 403 (73.7%) | 144 (26.3%) |
| Transportation | 258 (87.2%) | 38 (12.8%) |
| Material Moving | 294 (76.2%) | 92 (23.8%) |
| Total (Category) | 955 (77.7%) | 274 (22.3%) |
| Total (Overall) | 3,629 (49.1%) | 3,760 (50.9%) |
Employment Industries by Sex in Hueytown
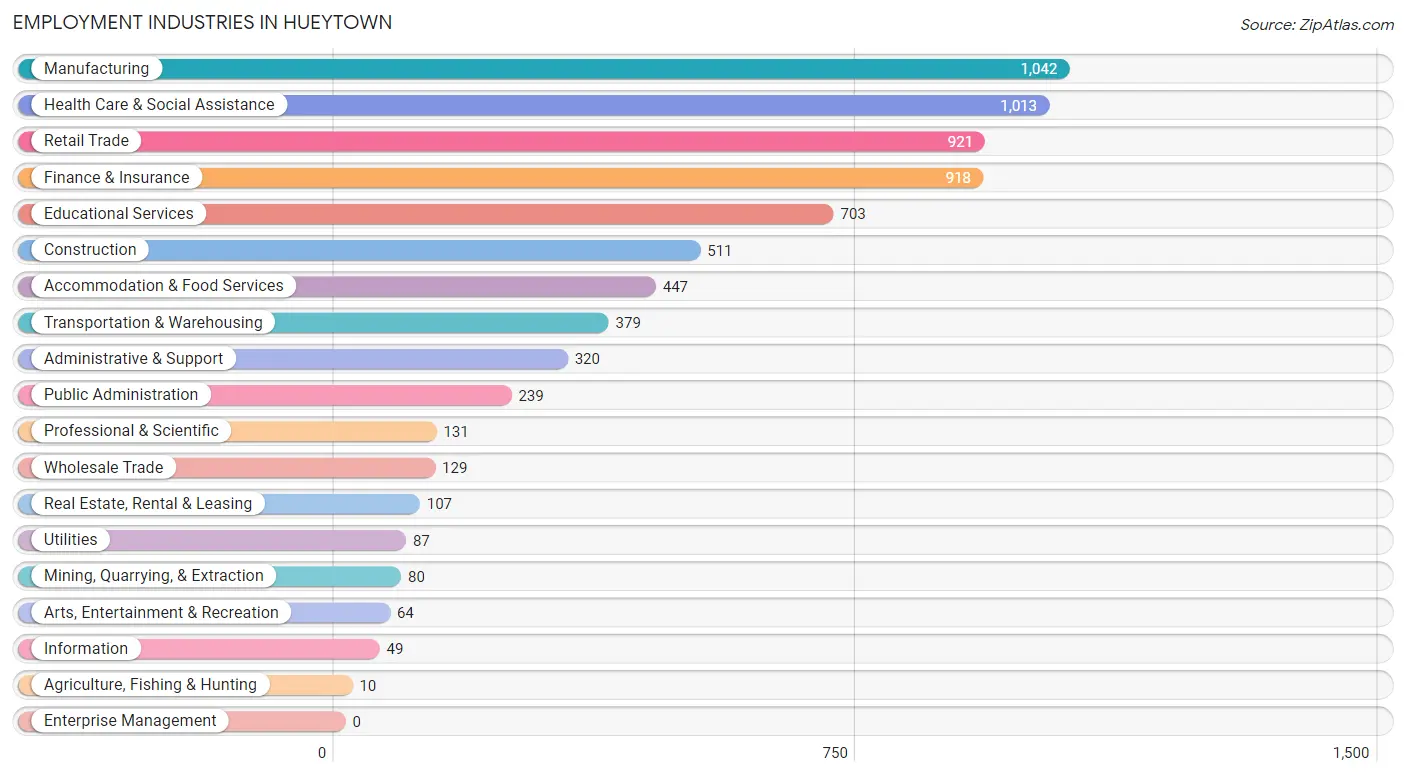
Employment Industries in Hueytown
The major employment industries in Hueytown include Manufacturing (1,042 | 14.1%), Health Care & Social Assistance (1,013 | 13.7%), Retail Trade (921 | 12.5%), Finance & Insurance (918 | 12.4%), and Educational Services (703 | 9.5%).
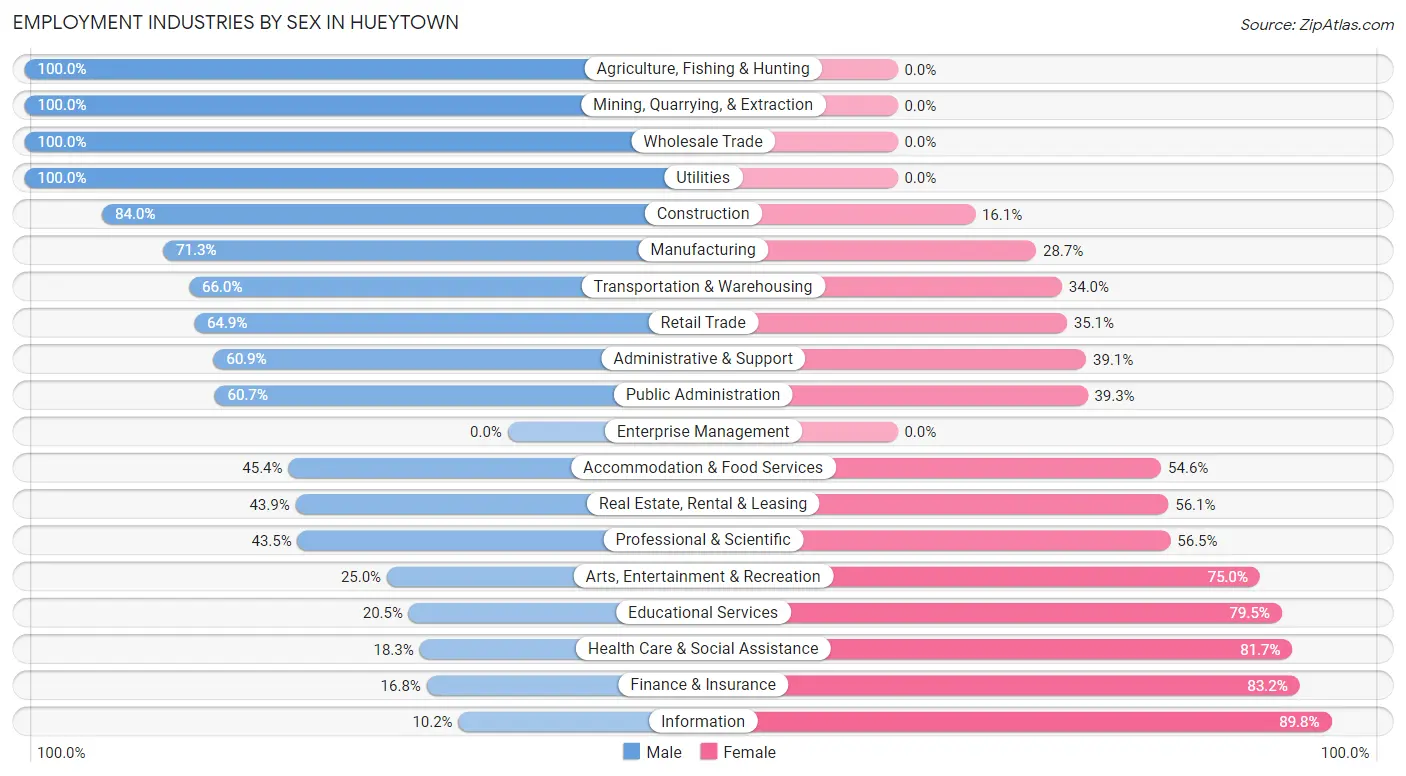
Employment Industries by Sex in Hueytown
The Hueytown industries that see more men than women are Agriculture, Fishing & Hunting (100.0%), Mining, Quarrying, & Extraction (100.0%), and Wholesale Trade (100.0%), whereas the industries that tend to have a higher number of women are Information (89.8%), Finance & Insurance (83.2%), and Health Care & Social Assistance (81.7%).
| Industry | Male | Female |
| Agriculture, Fishing & Hunting | 10 (100.0%) | 0 (0.0%) |
| Mining, Quarrying, & Extraction | 80 (100.0%) | 0 (0.0%) |
| Construction | 429 (84.0%) | 82 (16.1%) |
| Manufacturing | 743 (71.3%) | 299 (28.7%) |
| Wholesale Trade | 129 (100.0%) | 0 (0.0%) |
| Retail Trade | 598 (64.9%) | 323 (35.1%) |
| Transportation & Warehousing | 250 (66.0%) | 129 (34.0%) |
| Utilities | 87 (100.0%) | 0 (0.0%) |
| Information | 5 (10.2%) | 44 (89.8%) |
| Finance & Insurance | 154 (16.8%) | 764 (83.2%) |
| Real Estate, Rental & Leasing | 47 (43.9%) | 60 (56.1%) |
| Professional & Scientific | 57 (43.5%) | 74 (56.5%) |
| Enterprise Management | 0 (0.0%) | 0 (0.0%) |
| Administrative & Support | 195 (60.9%) | 125 (39.1%) |
| Educational Services | 144 (20.5%) | 559 (79.5%) |
| Health Care & Social Assistance | 185 (18.3%) | 828 (81.7%) |
| Arts, Entertainment & Recreation | 16 (25.0%) | 48 (75.0%) |
| Accommodation & Food Services | 203 (45.4%) | 244 (54.6%) |
| Public Administration | 145 (60.7%) | 94 (39.3%) |
| Total | 3,629 (49.1%) | 3,760 (50.9%) |
Education in Hueytown
School Enrollment in Hueytown
The most common levels of schooling among the 4,050 students in Hueytown are middle school (988 | 24.4%), high school (927 | 22.9%), and elementary school (884 | 21.8%).
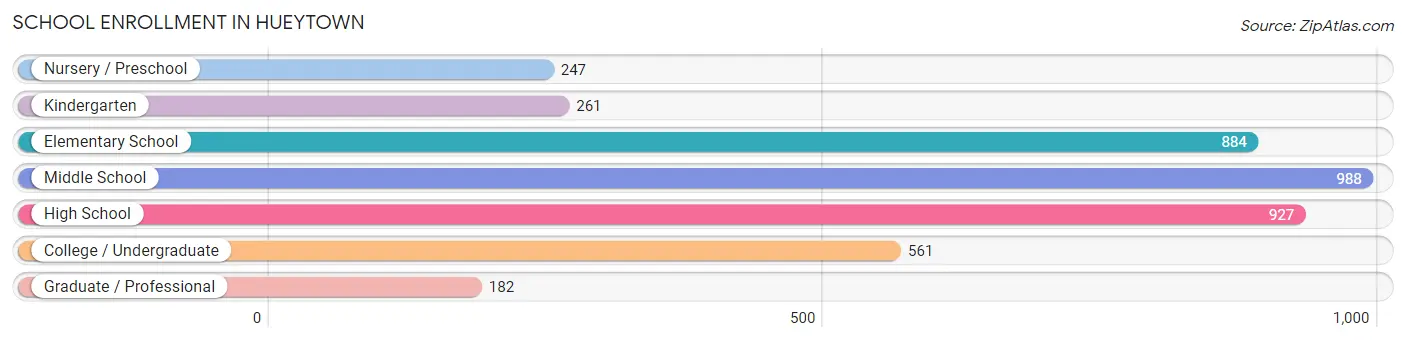
| School Level | # Students | % Students |
| Nursery / Preschool | 247 | 6.1% |
| Kindergarten | 261 | 6.4% |
| Elementary School | 884 | 21.8% |
| Middle School | 988 | 24.4% |
| High School | 927 | 22.9% |
| College / Undergraduate | 561 | 13.9% |
| Graduate / Professional | 182 | 4.5% |
| Total | 4,050 | 100.0% |
School Enrollment by Age by Funding Source in Hueytown
Out of a total of 4,050 students who are enrolled in schools in Hueytown, 535 (13.2%) attend a private institution, while the remaining 3,515 (86.8%) are enrolled in public schools. The age group of 3 to 4 year olds has the highest likelihood of being enrolled in private schools, with 136 (66.7% in the age bracket) enrolled. Conversely, the age group of 10 to 14 year olds has the lowest likelihood of being enrolled in a private school, with 1,183 (93.4% in the age bracket) attending a public institution.
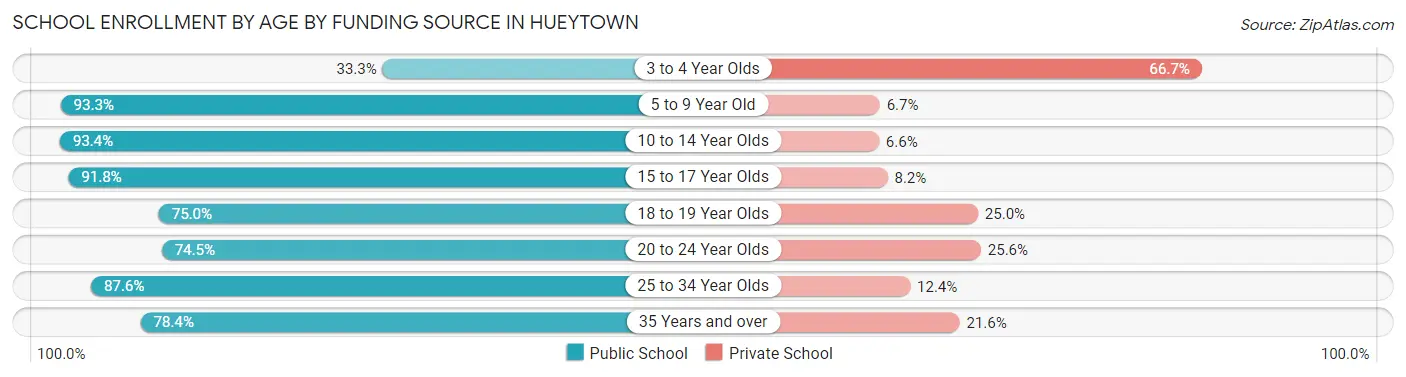
| Age Bracket | Public School | Private School |
| 3 to 4 Year Olds | 68 (33.3%) | 136 (66.7%) |
| 5 to 9 Year Old | 1,027 (93.3%) | 74 (6.7%) |
| 10 to 14 Year Olds | 1,183 (93.4%) | 83 (6.6%) |
| 15 to 17 Year Olds | 607 (91.8%) | 54 (8.2%) |
| 18 to 19 Year Olds | 171 (75.0%) | 57 (25.0%) |
| 20 to 24 Year Olds | 236 (74.5%) | 81 (25.6%) |
| 25 to 34 Year Olds | 85 (87.6%) | 12 (12.4%) |
| 35 Years and over | 138 (78.4%) | 38 (21.6%) |
| Total | 3,515 (86.8%) | 535 (13.2%) |
Educational Attainment by Field of Study in Hueytown
Business (708 | 27.4%), education (338 | 13.1%), science & technology (219 | 8.5%), arts & humanities (205 | 8.0%), and psychology (187 | 7.2%) are the most common fields of study among 2,580 individuals in Hueytown who have obtained a bachelor's degree or higher.
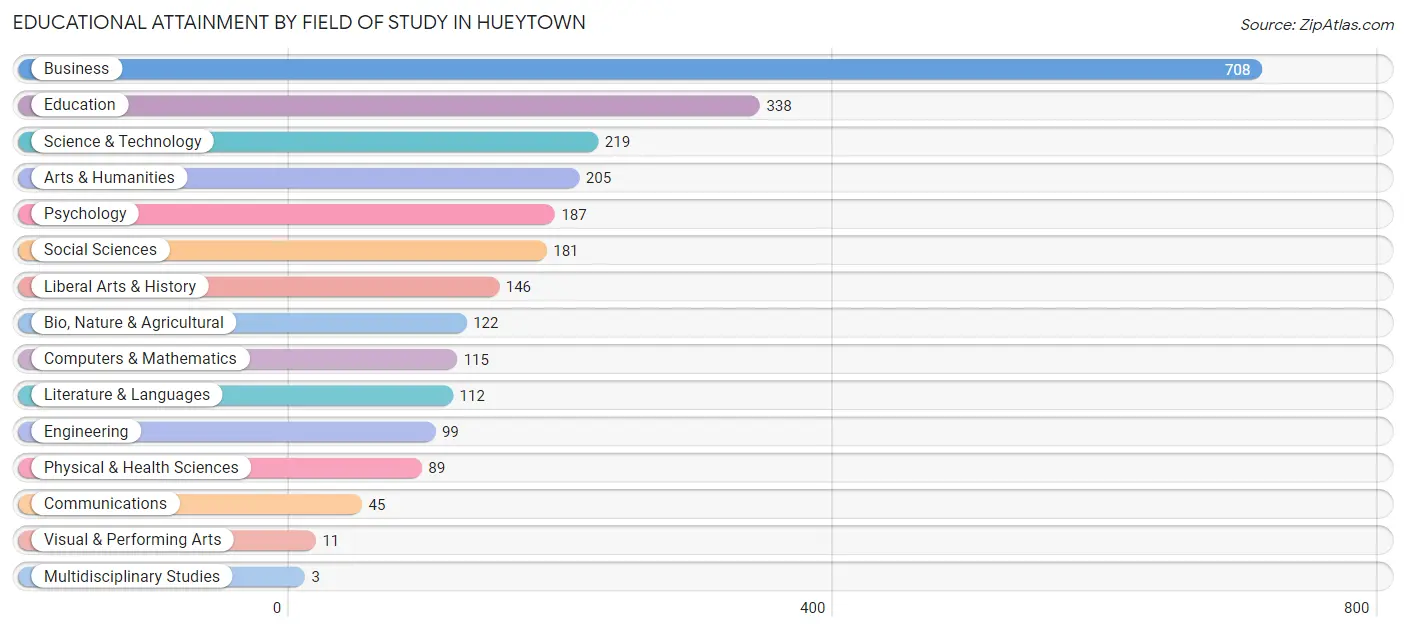
| Field of Study | # Graduates | % Graduates |
| Computers & Mathematics | 115 | 4.5% |
| Bio, Nature & Agricultural | 122 | 4.7% |
| Physical & Health Sciences | 89 | 3.5% |
| Psychology | 187 | 7.2% |
| Social Sciences | 181 | 7.0% |
| Engineering | 99 | 3.8% |
| Multidisciplinary Studies | 3 | 0.1% |
| Science & Technology | 219 | 8.5% |
| Business | 708 | 27.4% |
| Education | 338 | 13.1% |
| Literature & Languages | 112 | 4.3% |
| Liberal Arts & History | 146 | 5.7% |
| Visual & Performing Arts | 11 | 0.4% |
| Communications | 45 | 1.7% |
| Arts & Humanities | 205 | 8.0% |
| Total | 2,580 | 100.0% |
Transportation & Commute in Hueytown
Vehicle Availability by Sex in Hueytown
The most prevalent vehicle ownership categories in Hueytown are males with 2 vehicles (1,420, accounting for 39.5%) and females with 2 vehicles (1,479, making up 38.8%).
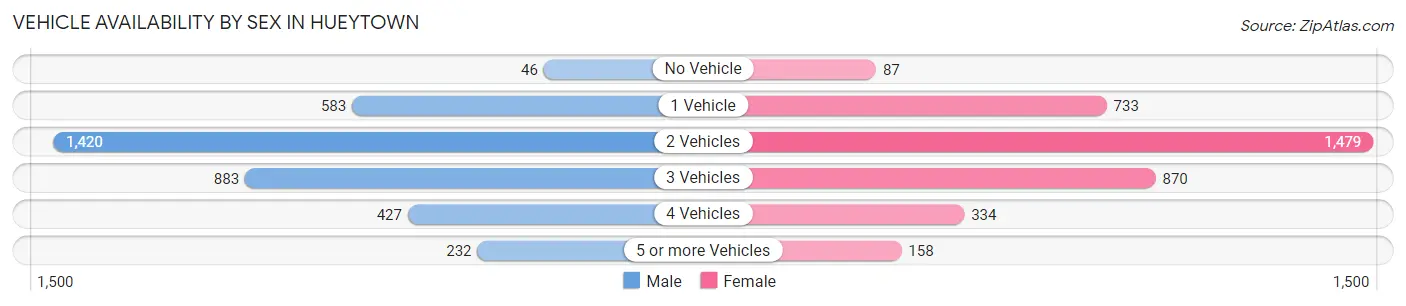
| Vehicles Available | Male | Female |
| No Vehicle | 46 (1.3%) | 87 (2.4%) |
| 1 Vehicle | 583 (16.2%) | 733 (20.0%) |
| 2 Vehicles | 1,420 (39.5%) | 1,479 (40.4%) |
| 3 Vehicles | 883 (24.6%) | 870 (23.8%) |
| 4 Vehicles | 427 (11.9%) | 334 (9.1%) |
| 5 or more Vehicles | 232 (6.5%) | 158 (4.3%) |
| Total | 3,591 (100.0%) | 3,661 (100.0%) |
Commute Time in Hueytown
The most frequently occuring commute durations in Hueytown are 15 to 19 minutes (1,175 commuters, 17.6%), 30 to 34 minutes (1,077 commuters, 16.2%), and 20 to 24 minutes (1,061 commuters, 15.9%).
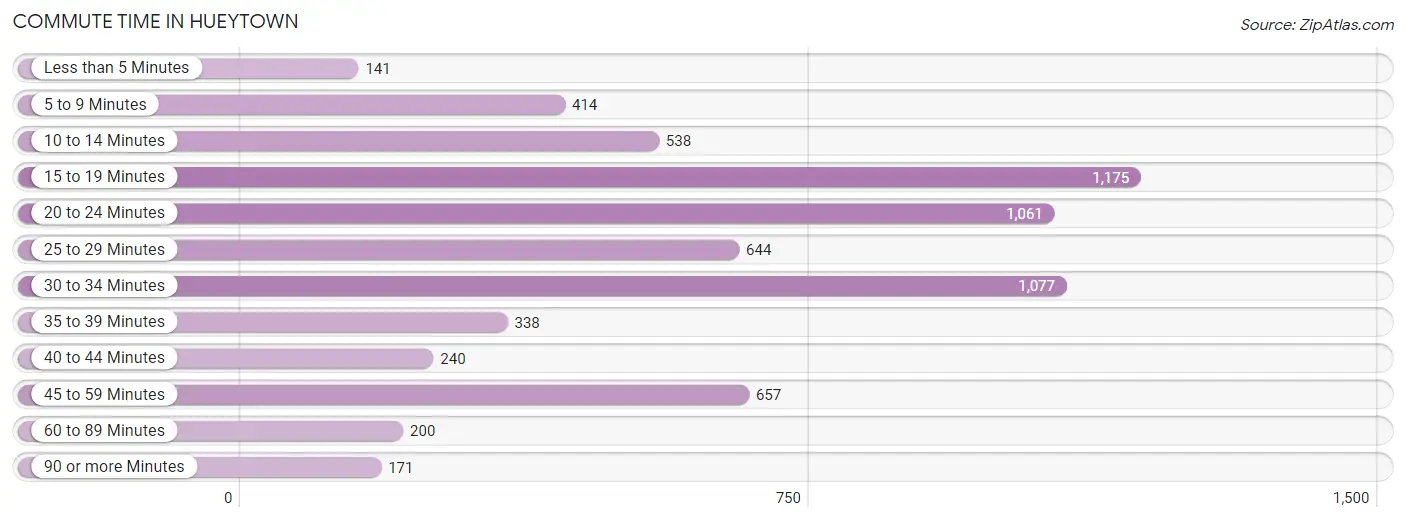
| Commute Time | # Commuters | % Commuters |
| Less than 5 Minutes | 141 | 2.1% |
| 5 to 9 Minutes | 414 | 6.2% |
| 10 to 14 Minutes | 538 | 8.1% |
| 15 to 19 Minutes | 1,175 | 17.6% |
| 20 to 24 Minutes | 1,061 | 15.9% |
| 25 to 29 Minutes | 644 | 9.7% |
| 30 to 34 Minutes | 1,077 | 16.2% |
| 35 to 39 Minutes | 338 | 5.1% |
| 40 to 44 Minutes | 240 | 3.6% |
| 45 to 59 Minutes | 657 | 9.9% |
| 60 to 89 Minutes | 200 | 3.0% |
| 90 or more Minutes | 171 | 2.6% |
Commute Time by Sex in Hueytown
The most common commute times in Hueytown are 15 to 19 minutes (859 commuters, 25.2%) for males and 20 to 24 minutes (754 commuters, 23.2%) for females.
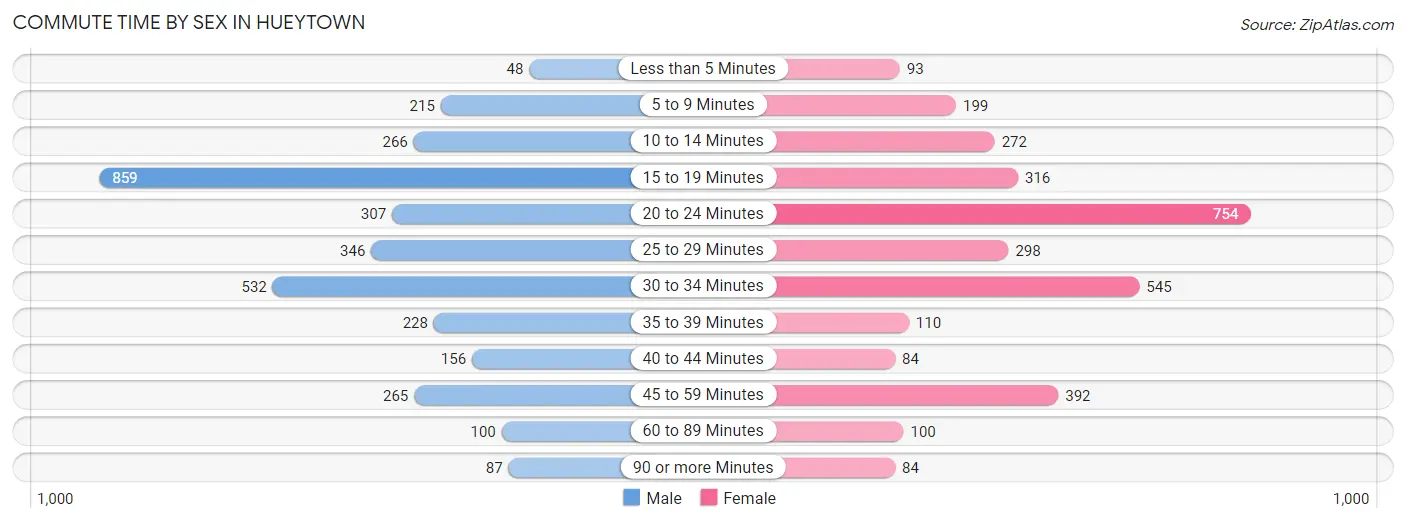
| Commute Time | Male | Female |
| Less than 5 Minutes | 48 (1.4%) | 93 (2.9%) |
| 5 to 9 Minutes | 215 (6.3%) | 199 (6.1%) |
| 10 to 14 Minutes | 266 (7.8%) | 272 (8.4%) |
| 15 to 19 Minutes | 859 (25.2%) | 316 (9.7%) |
| 20 to 24 Minutes | 307 (9.0%) | 754 (23.2%) |
| 25 to 29 Minutes | 346 (10.2%) | 298 (9.2%) |
| 30 to 34 Minutes | 532 (15.6%) | 545 (16.8%) |
| 35 to 39 Minutes | 228 (6.7%) | 110 (3.4%) |
| 40 to 44 Minutes | 156 (4.6%) | 84 (2.6%) |
| 45 to 59 Minutes | 265 (7.8%) | 392 (12.1%) |
| 60 to 89 Minutes | 100 (2.9%) | 100 (3.1%) |
| 90 or more Minutes | 87 (2.5%) | 84 (2.6%) |
Time of Departure to Work by Sex in Hueytown
The most frequent times of departure to work in Hueytown are 7:00 AM to 7:29 AM (516, 15.1%) for males and 7:30 AM to 7:59 AM (634, 19.5%) for females.
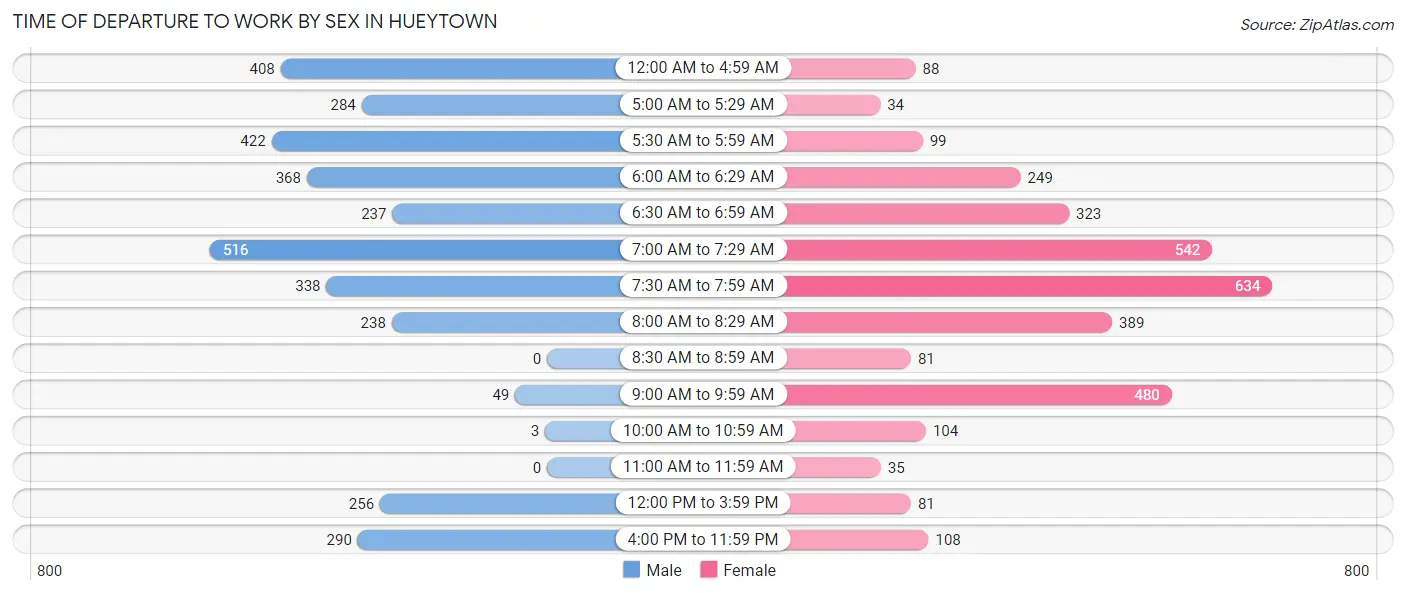
| Time of Departure | Male | Female |
| 12:00 AM to 4:59 AM | 408 (12.0%) | 88 (2.7%) |
| 5:00 AM to 5:29 AM | 284 (8.3%) | 34 (1.1%) |
| 5:30 AM to 5:59 AM | 422 (12.4%) | 99 (3.0%) |
| 6:00 AM to 6:29 AM | 368 (10.8%) | 249 (7.7%) |
| 6:30 AM to 6:59 AM | 237 (7.0%) | 323 (10.0%) |
| 7:00 AM to 7:29 AM | 516 (15.1%) | 542 (16.7%) |
| 7:30 AM to 7:59 AM | 338 (9.9%) | 634 (19.5%) |
| 8:00 AM to 8:29 AM | 238 (7.0%) | 389 (12.0%) |
| 8:30 AM to 8:59 AM | 0 (0.0%) | 81 (2.5%) |
| 9:00 AM to 9:59 AM | 49 (1.4%) | 480 (14.8%) |
| 10:00 AM to 10:59 AM | 3 (0.1%) | 104 (3.2%) |
| 11:00 AM to 11:59 AM | 0 (0.0%) | 35 (1.1%) |
| 12:00 PM to 3:59 PM | 256 (7.5%) | 81 (2.5%) |
| 4:00 PM to 11:59 PM | 290 (8.5%) | 108 (3.3%) |
| Total | 3,409 (100.0%) | 3,247 (100.0%) |
Housing Occupancy in Hueytown
Occupancy by Ownership in Hueytown
Of the total 5,803 dwellings in Hueytown, owner-occupied units account for 4,362 (75.2%), while renter-occupied units make up 1,441 (24.8%).
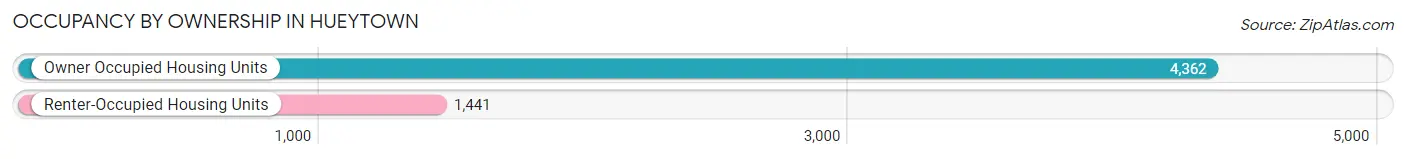
| Occupancy | # Housing Units | % Housing Units |
| Owner Occupied Housing Units | 4,362 | 75.2% |
| Renter-Occupied Housing Units | 1,441 | 24.8% |
| Total Occupied Housing Units | 5,803 | 100.0% |
Occupancy by Household Size in Hueytown
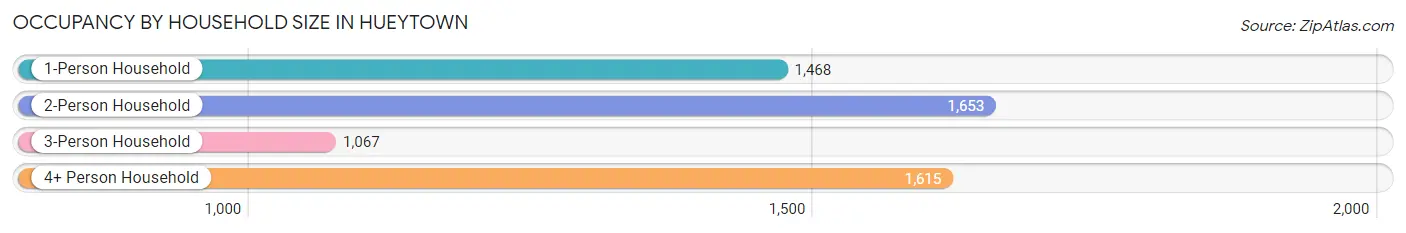
| Household Size | # Housing Units | % Housing Units |
| 1-Person Household | 1,468 | 25.3% |
| 2-Person Household | 1,653 | 28.5% |
| 3-Person Household | 1,067 | 18.4% |
| 4+ Person Household | 1,615 | 27.8% |
| Total Housing Units | 5,803 | 100.0% |
Occupancy by Ownership by Household Size in Hueytown
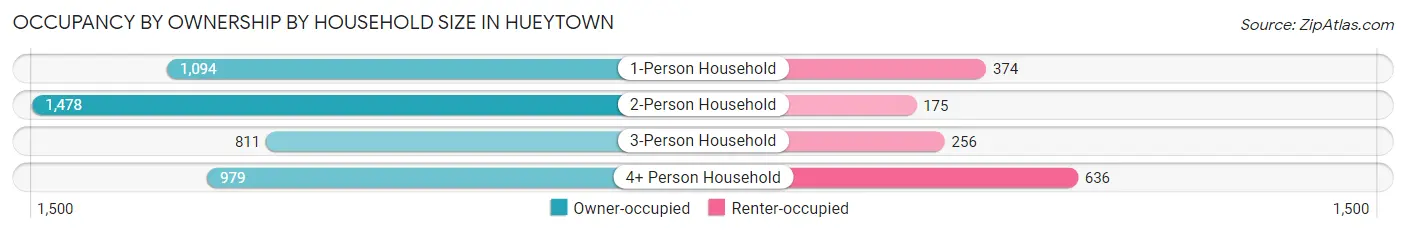
| Household Size | Owner-occupied | Renter-occupied |
| 1-Person Household | 1,094 (74.5%) | 374 (25.5%) |
| 2-Person Household | 1,478 (89.4%) | 175 (10.6%) |
| 3-Person Household | 811 (76.0%) | 256 (24.0%) |
| 4+ Person Household | 979 (60.6%) | 636 (39.4%) |
| Total Housing Units | 4,362 (75.2%) | 1,441 (24.8%) |
Occupancy by Educational Attainment in Hueytown
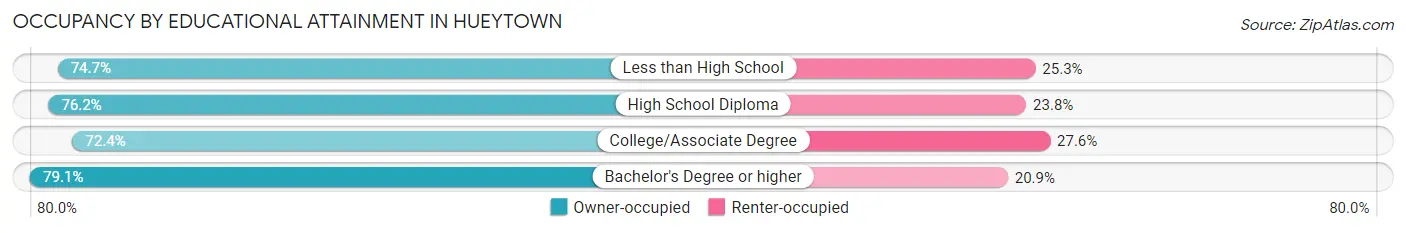
| Household Size | Owner-occupied | Renter-occupied |
| Less than High School | 284 (74.7%) | 96 (25.3%) |
| High School Diploma | 1,464 (76.2%) | 457 (23.8%) |
| College/Associate Degree | 1,693 (72.4%) | 645 (27.6%) |
| Bachelor's Degree or higher | 921 (79.1%) | 243 (20.9%) |
Occupancy by Age of Householder in Hueytown
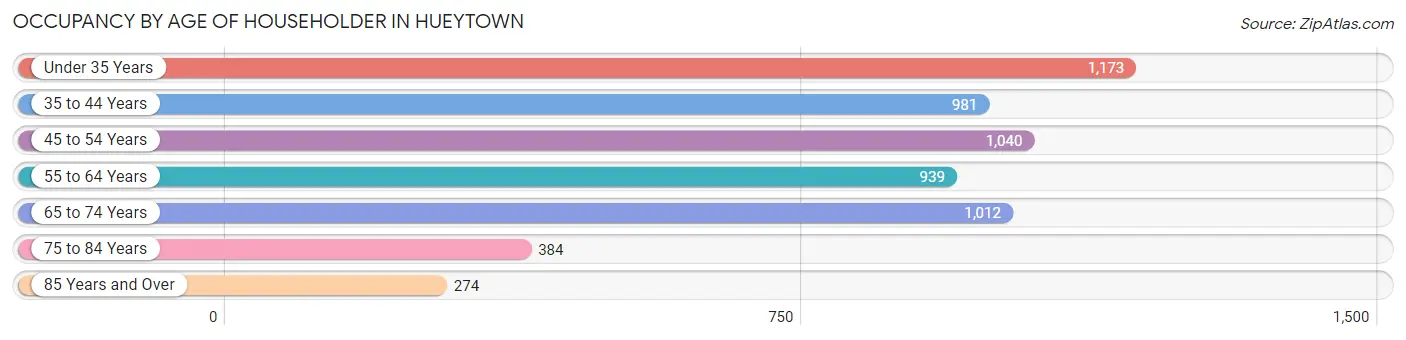
| Age Bracket | # Households | % Households |
| Under 35 Years | 1,173 | 20.2% |
| 35 to 44 Years | 981 | 16.9% |
| 45 to 54 Years | 1,040 | 17.9% |
| 55 to 64 Years | 939 | 16.2% |
| 65 to 74 Years | 1,012 | 17.4% |
| 75 to 84 Years | 384 | 6.6% |
| 85 Years and Over | 274 | 4.7% |
| Total | 5,803 | 100.0% |
Housing Finances in Hueytown
Median Income by Occupancy in Hueytown
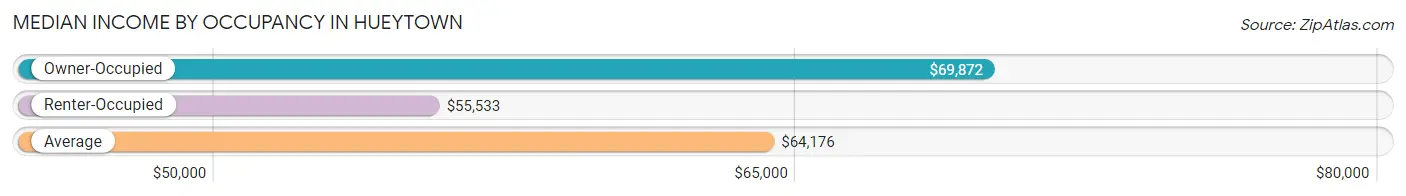
| Occupancy Type | # Households | Median Income |
| Owner-Occupied | 4,362 (75.2%) | $69,872 |
| Renter-Occupied | 1,441 (24.8%) | $55,533 |
| Average | 5,803 (100.0%) | $64,176 |
Occupancy by Householder Income Bracket in Hueytown
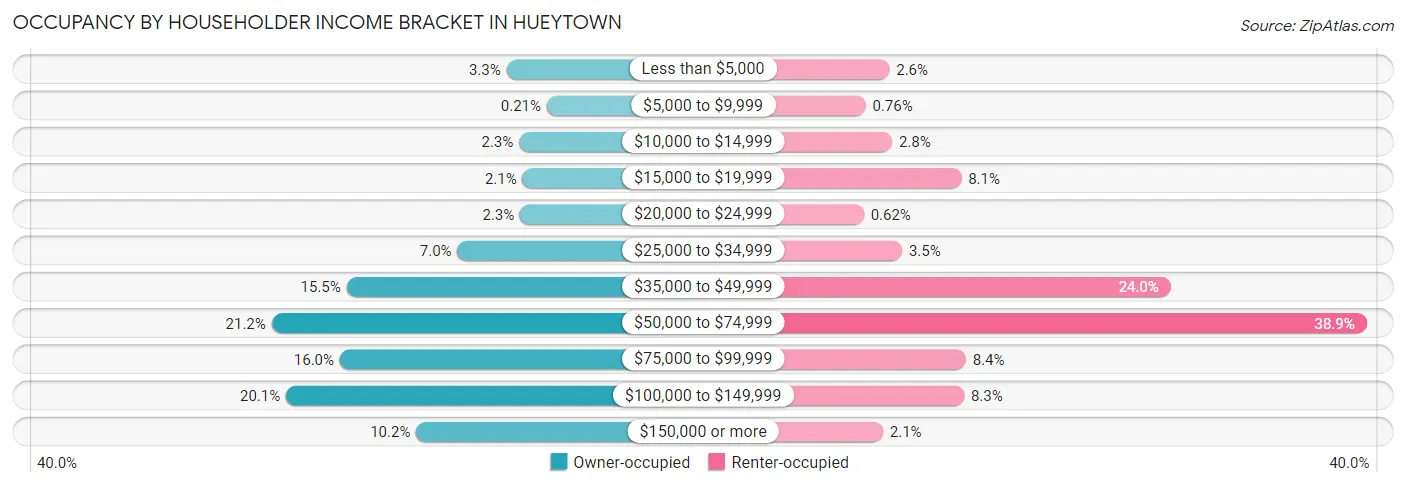
| Income Bracket | Owner-occupied | Renter-occupied |
| Less than $5,000 | 143 (3.3%) | 37 (2.6%) |
| $5,000 to $9,999 | 9 (0.2%) | 11 (0.8%) |
| $10,000 to $14,999 | 101 (2.3%) | 40 (2.8%) |
| $15,000 to $19,999 | 90 (2.1%) | 116 (8.1%) |
| $20,000 to $24,999 | 98 (2.2%) | 9 (0.6%) |
| $25,000 to $34,999 | 306 (7.0%) | 51 (3.5%) |
| $35,000 to $49,999 | 675 (15.5%) | 346 (24.0%) |
| $50,000 to $74,999 | 924 (21.2%) | 561 (38.9%) |
| $75,000 to $99,999 | 697 (16.0%) | 121 (8.4%) |
| $100,000 to $149,999 | 876 (20.1%) | 119 (8.3%) |
| $150,000 or more | 443 (10.2%) | 30 (2.1%) |
| Total | 4,362 (100.0%) | 1,441 (100.0%) |
Monthly Housing Cost Tiers in Hueytown
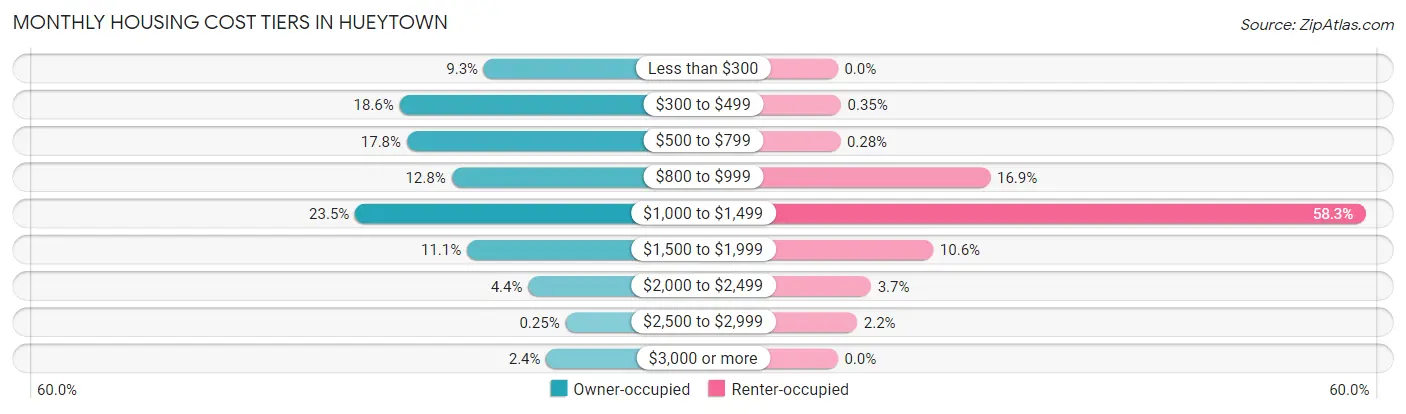
| Monthly Cost | Owner-occupied | Renter-occupied |
| Less than $300 | 404 (9.3%) | 0 (0.0%) |
| $300 to $499 | 810 (18.6%) | 5 (0.4%) |
| $500 to $799 | 775 (17.8%) | 4 (0.3%) |
| $800 to $999 | 560 (12.8%) | 243 (16.9%) |
| $1,000 to $1,499 | 1,024 (23.5%) | 840 (58.3%) |
| $1,500 to $1,999 | 485 (11.1%) | 152 (10.5%) |
| $2,000 to $2,499 | 190 (4.4%) | 53 (3.7%) |
| $2,500 to $2,999 | 11 (0.3%) | 31 (2.1%) |
| $3,000 or more | 103 (2.4%) | 0 (0.0%) |
| Total | 4,362 (100.0%) | 1,441 (100.0%) |
Physical Housing Characteristics in Hueytown
Housing Structures in Hueytown
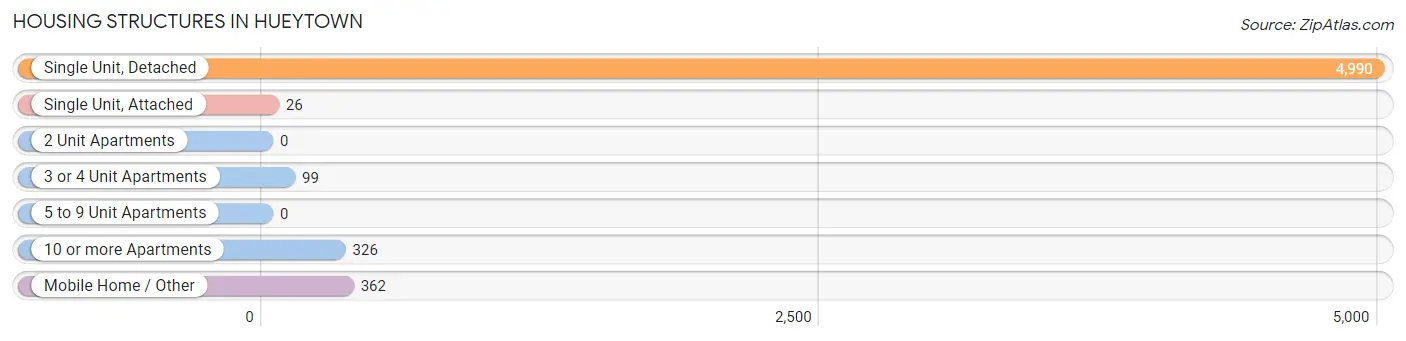
| Structure Type | # Housing Units | % Housing Units |
| Single Unit, Detached | 4,990 | 86.0% |
| Single Unit, Attached | 26 | 0.4% |
| 2 Unit Apartments | 0 | 0.0% |
| 3 or 4 Unit Apartments | 99 | 1.7% |
| 5 to 9 Unit Apartments | 0 | 0.0% |
| 10 or more Apartments | 326 | 5.6% |
| Mobile Home / Other | 362 | 6.2% |
| Total | 5,803 | 100.0% |
Housing Structures by Occupancy in Hueytown
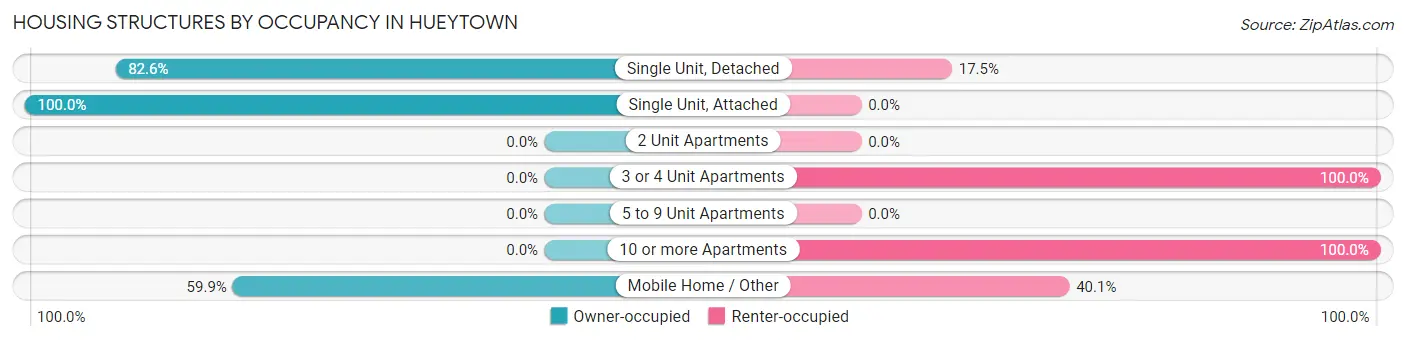
| Structure Type | Owner-occupied | Renter-occupied |
| Single Unit, Detached | 4,119 (82.6%) | 871 (17.4%) |
| Single Unit, Attached | 26 (100.0%) | 0 (0.0%) |
| 2 Unit Apartments | 0 (0.0%) | 0 (0.0%) |
| 3 or 4 Unit Apartments | 0 (0.0%) | 99 (100.0%) |
| 5 to 9 Unit Apartments | 0 (0.0%) | 0 (0.0%) |
| 10 or more Apartments | 0 (0.0%) | 326 (100.0%) |
| Mobile Home / Other | 217 (59.9%) | 145 (40.1%) |
| Total | 4,362 (75.2%) | 1,441 (24.8%) |
Housing Structures by Number of Rooms in Hueytown
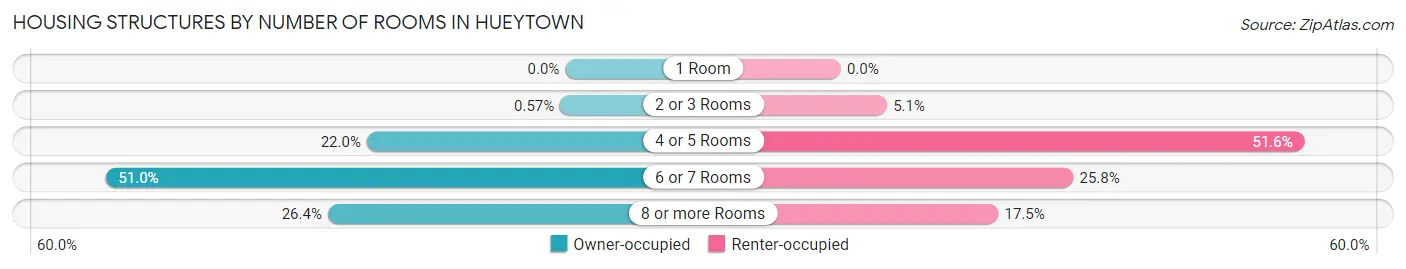
| Number of Rooms | Owner-occupied | Renter-occupied |
| 1 Room | 0 (0.0%) | 0 (0.0%) |
| 2 or 3 Rooms | 25 (0.6%) | 74 (5.1%) |
| 4 or 5 Rooms | 961 (22.0%) | 743 (51.6%) |
| 6 or 7 Rooms | 2,226 (51.0%) | 372 (25.8%) |
| 8 or more Rooms | 1,150 (26.4%) | 252 (17.5%) |
| Total | 4,362 (100.0%) | 1,441 (100.0%) |
Housing Structure by Heating Type in Hueytown
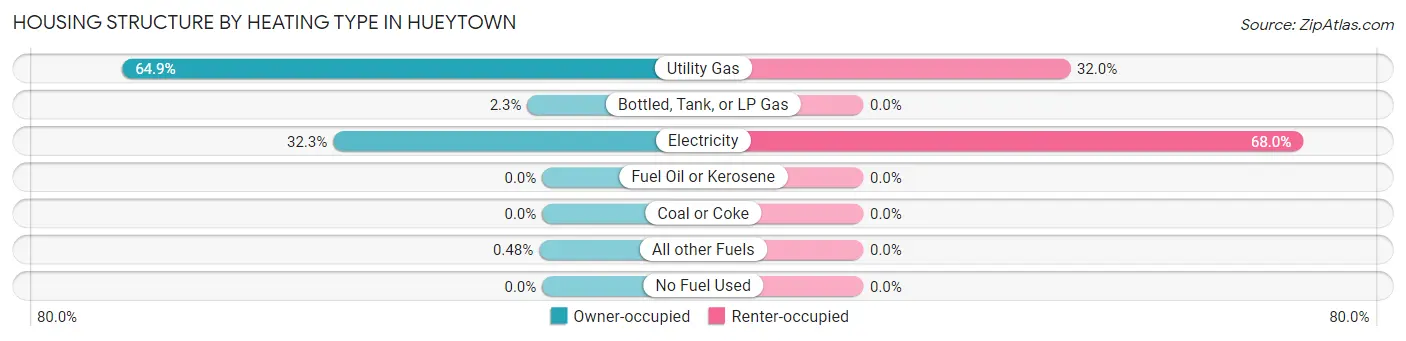
| Heating Type | Owner-occupied | Renter-occupied |
| Utility Gas | 2,831 (64.9%) | 461 (32.0%) |
| Bottled, Tank, or LP Gas | 100 (2.3%) | 0 (0.0%) |
| Electricity | 1,410 (32.3%) | 980 (68.0%) |
| Fuel Oil or Kerosene | 0 (0.0%) | 0 (0.0%) |
| Coal or Coke | 0 (0.0%) | 0 (0.0%) |
| All other Fuels | 21 (0.5%) | 0 (0.0%) |
| No Fuel Used | 0 (0.0%) | 0 (0.0%) |
| Total | 4,362 (100.0%) | 1,441 (100.0%) |
Household Vehicle Usage in Hueytown
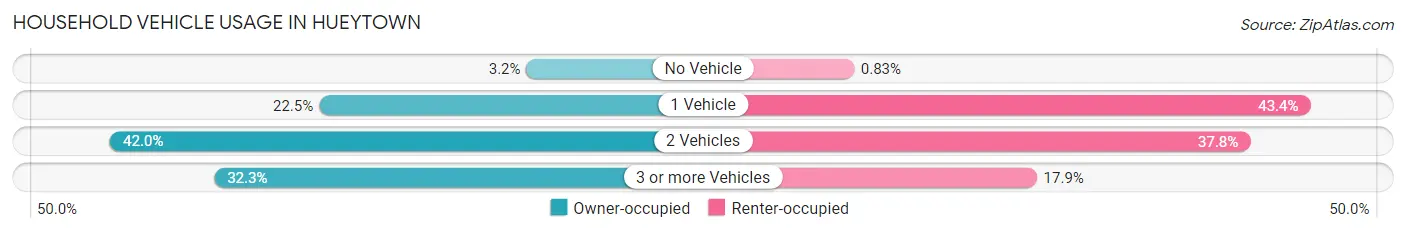
| Vehicles per Household | Owner-occupied | Renter-occupied |
| No Vehicle | 138 (3.2%) | 12 (0.8%) |
| 1 Vehicle | 982 (22.5%) | 626 (43.4%) |
| 2 Vehicles | 1,833 (42.0%) | 545 (37.8%) |
| 3 or more Vehicles | 1,409 (32.3%) | 258 (17.9%) |
| Total | 4,362 (100.0%) | 1,441 (100.0%) |
Real Estate & Mortgages in Hueytown
Real Estate and Mortgage Overview in Hueytown
| Characteristic | Without Mortgage | With Mortgage |
| Housing Units | 1,679 | 2,683 |
| Median Property Value | $120,100 | $141,700 |
| Median Household Income | $48,865 | $355 |
| Monthly Housing Costs | $397 | $103 |
| Real Estate Taxes | $718 | $310 |
Property Value by Mortgage Status in Hueytown
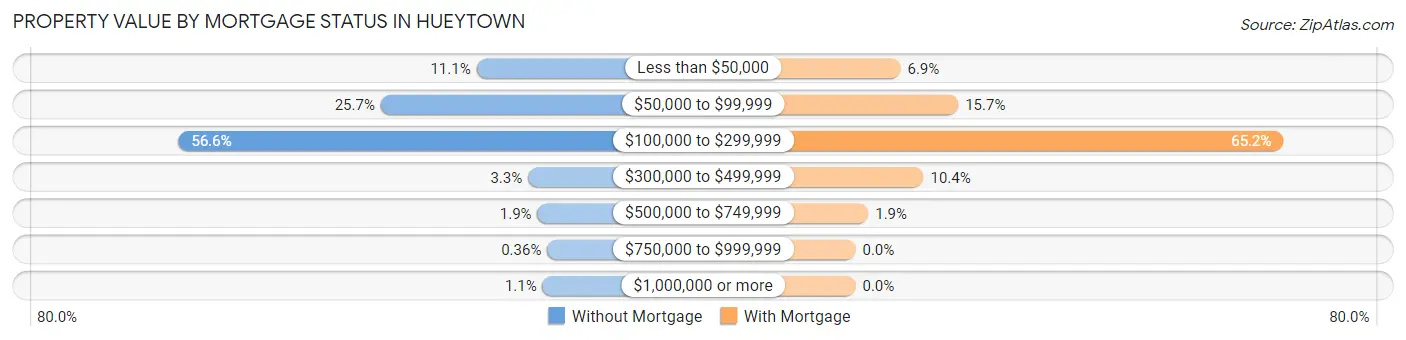
| Property Value | Without Mortgage | With Mortgage |
| Less than $50,000 | 187 (11.1%) | 184 (6.9%) |
| $50,000 to $99,999 | 432 (25.7%) | 420 (15.7%) |
| $100,000 to $299,999 | 950 (56.6%) | 1,749 (65.2%) |
| $300,000 to $499,999 | 55 (3.3%) | 278 (10.4%) |
| $500,000 to $749,999 | 31 (1.8%) | 52 (1.9%) |
| $750,000 to $999,999 | 6 (0.4%) | 0 (0.0%) |
| $1,000,000 or more | 18 (1.1%) | 0 (0.0%) |
| Total | 1,679 (100.0%) | 2,683 (100.0%) |
Household Income by Mortgage Status in Hueytown
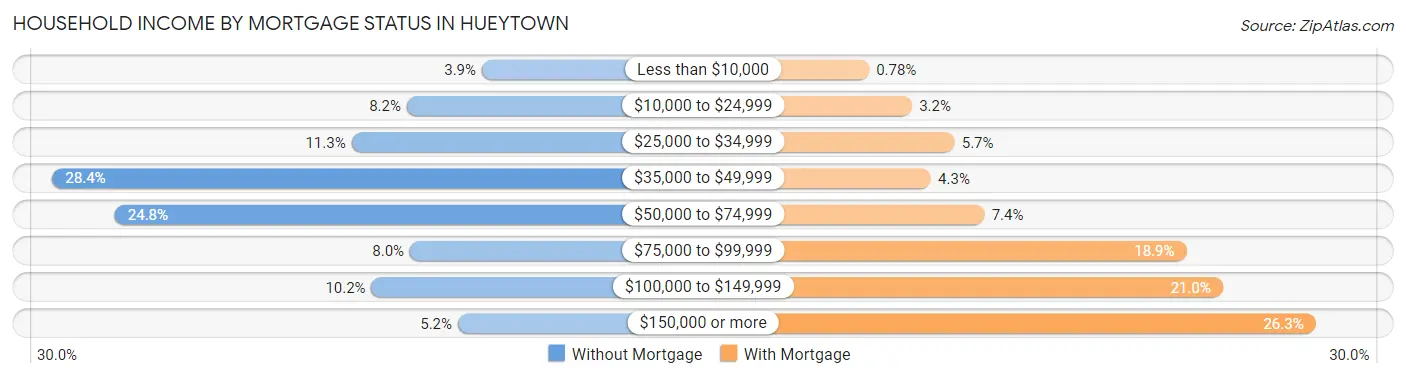
| Household Income | Without Mortgage | With Mortgage |
| Less than $10,000 | 65 (3.9%) | 21 (0.8%) |
| $10,000 to $24,999 | 137 (8.2%) | 87 (3.2%) |
| $25,000 to $34,999 | 190 (11.3%) | 152 (5.7%) |
| $35,000 to $49,999 | 477 (28.4%) | 116 (4.3%) |
| $50,000 to $74,999 | 417 (24.8%) | 198 (7.4%) |
| $75,000 to $99,999 | 134 (8.0%) | 507 (18.9%) |
| $100,000 to $149,999 | 171 (10.2%) | 563 (21.0%) |
| $150,000 or more | 88 (5.2%) | 705 (26.3%) |
| Total | 1,679 (100.0%) | 2,683 (100.0%) |
Property Value to Household Income Ratio in Hueytown
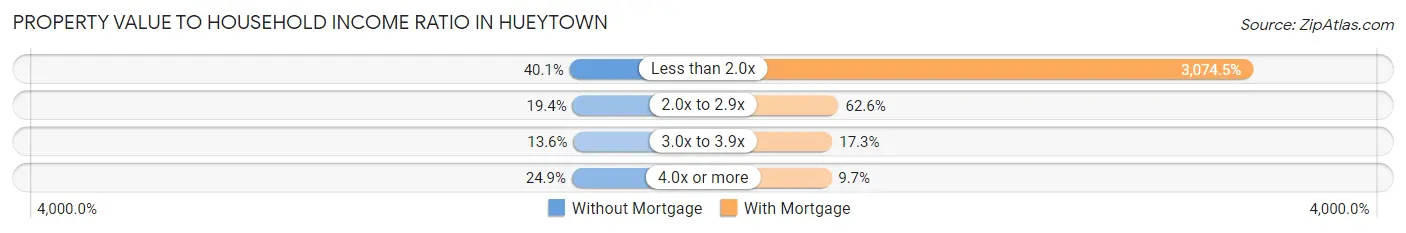
| Value-to-Income Ratio | Without Mortgage | With Mortgage |
| Less than 2.0x | 674 (40.1%) | 82,490 (3,074.5%) |
| 2.0x to 2.9x | 325 (19.4%) | 1,679 (62.6%) |
| 3.0x to 3.9x | 228 (13.6%) | 463 (17.3%) |
| 4.0x or more | 418 (24.9%) | 261 (9.7%) |
| Total | 1,679 (100.0%) | 2,683 (100.0%) |
Real Estate Taxes by Mortgage Status in Hueytown
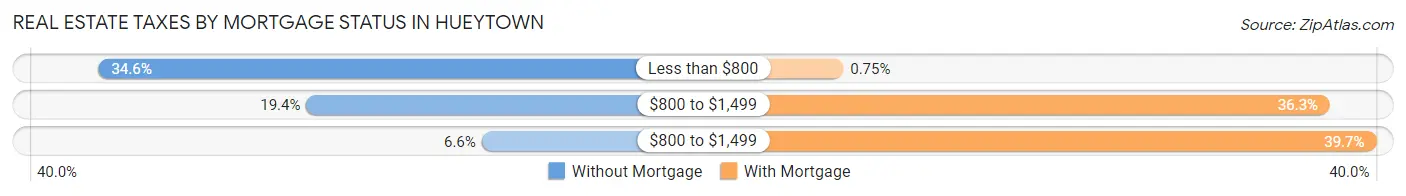
| Property Taxes | Without Mortgage | With Mortgage |
| Less than $800 | 581 (34.6%) | 20 (0.7%) |
| $800 to $1,499 | 326 (19.4%) | 974 (36.3%) |
| $800 to $1,499 | 111 (6.6%) | 1,065 (39.7%) |
| Total | 1,679 (100.0%) | 2,683 (100.0%) |
Health & Disability in Hueytown
Health Insurance Coverage by Age in Hueytown
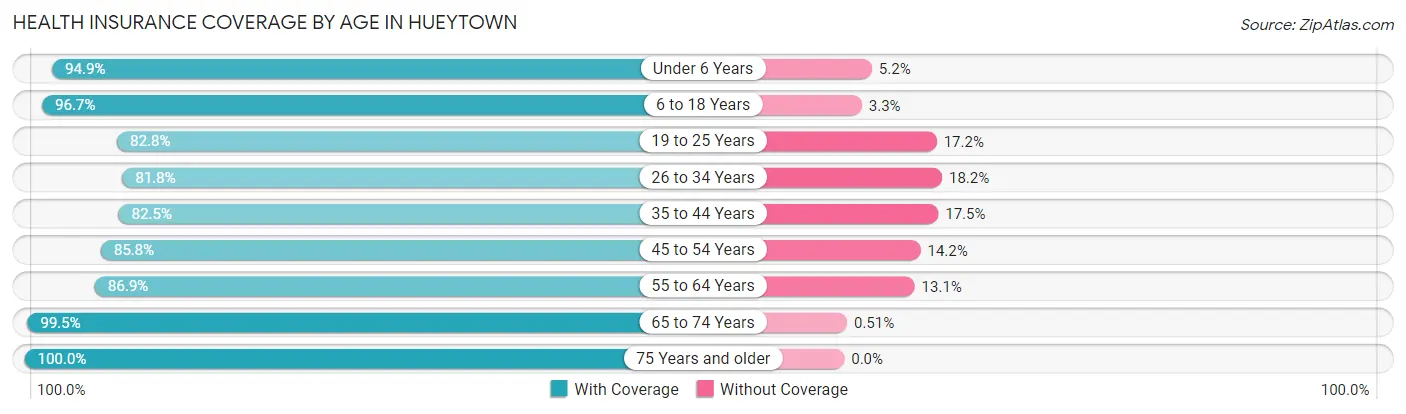
| Age Bracket | With Coverage | Without Coverage |
| Under 6 Years | 1,344 (94.9%) | 73 (5.1%) |
| 6 to 18 Years | 2,989 (96.7%) | 101 (3.3%) |
| 19 to 25 Years | 1,032 (82.8%) | 215 (17.2%) |
| 26 to 34 Years | 1,888 (81.8%) | 421 (18.2%) |
| 35 to 44 Years | 1,726 (82.5%) | 367 (17.5%) |
| 45 to 54 Years | 1,635 (85.8%) | 271 (14.2%) |
| 55 to 64 Years | 1,497 (86.9%) | 226 (13.1%) |
| 65 to 74 Years | 1,575 (99.5%) | 8 (0.5%) |
| 75 Years and older | 1,043 (100.0%) | 0 (0.0%) |
| Total | 14,729 (89.7%) | 1,682 (10.2%) |
Health Insurance Coverage by Citizenship Status in Hueytown
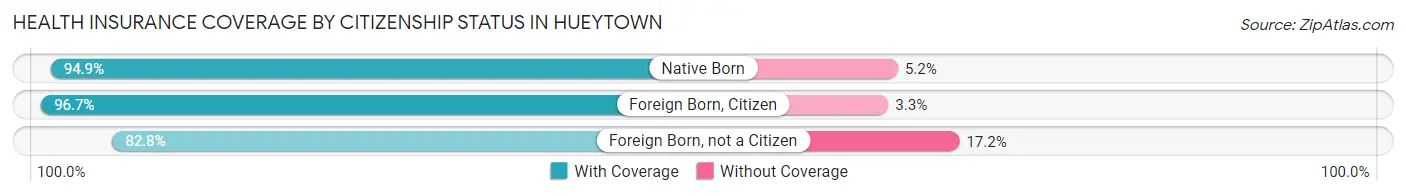
| Citizenship Status | With Coverage | Without Coverage |
| Native Born | 1,344 (94.9%) | 73 (5.1%) |
| Foreign Born, Citizen | 2,989 (96.7%) | 101 (3.3%) |
| Foreign Born, not a Citizen | 1,032 (82.8%) | 215 (17.2%) |
Health Insurance Coverage by Household Income in Hueytown
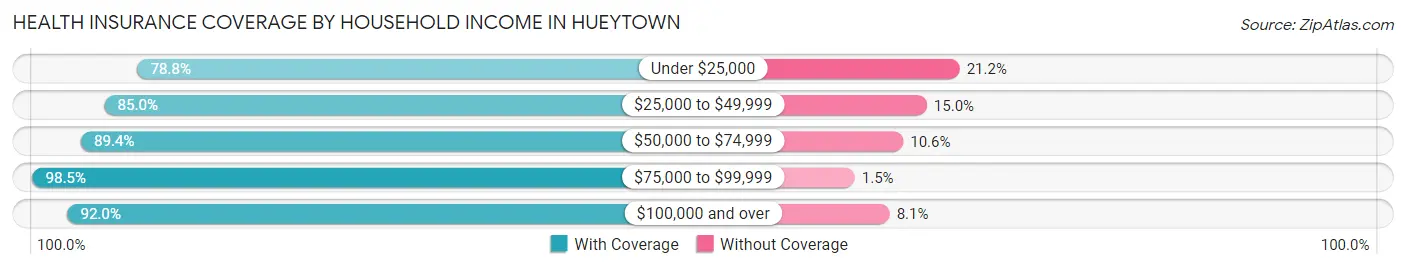
| Household Income | With Coverage | Without Coverage |
| Under $25,000 | 1,058 (78.8%) | 284 (21.2%) |
| $25,000 to $49,999 | 2,786 (85.0%) | 492 (15.0%) |
| $50,000 to $74,999 | 3,829 (89.4%) | 453 (10.6%) |
| $75,000 to $99,999 | 2,283 (98.5%) | 35 (1.5%) |
| $100,000 and over | 4,772 (91.9%) | 418 (8.1%) |
Public vs Private Health Insurance Coverage by Age in Hueytown
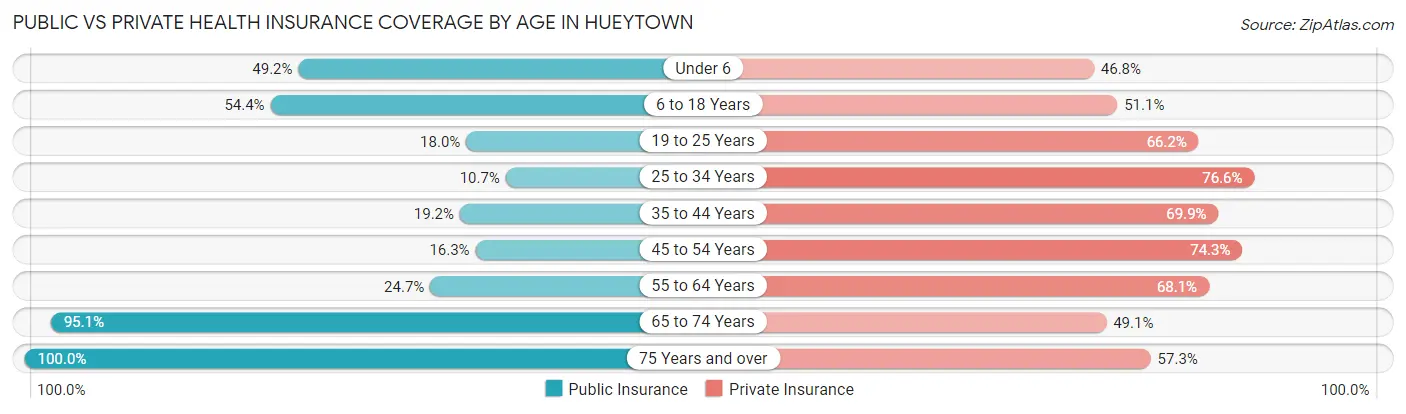
| Age Bracket | Public Insurance | Private Insurance |
| Under 6 | 697 (49.2%) | 663 (46.8%) |
| 6 to 18 Years | 1,680 (54.4%) | 1,580 (51.1%) |
| 19 to 25 Years | 225 (18.0%) | 826 (66.2%) |
| 25 to 34 Years | 247 (10.7%) | 1,768 (76.6%) |
| 35 to 44 Years | 402 (19.2%) | 1,463 (69.9%) |
| 45 to 54 Years | 311 (16.3%) | 1,417 (74.3%) |
| 55 to 64 Years | 426 (24.7%) | 1,174 (68.1%) |
| 65 to 74 Years | 1,506 (95.1%) | 777 (49.1%) |
| 75 Years and over | 1,043 (100.0%) | 598 (57.3%) |
| Total | 6,537 (39.8%) | 10,266 (62.6%) |
Disability Status by Sex by Age in Hueytown
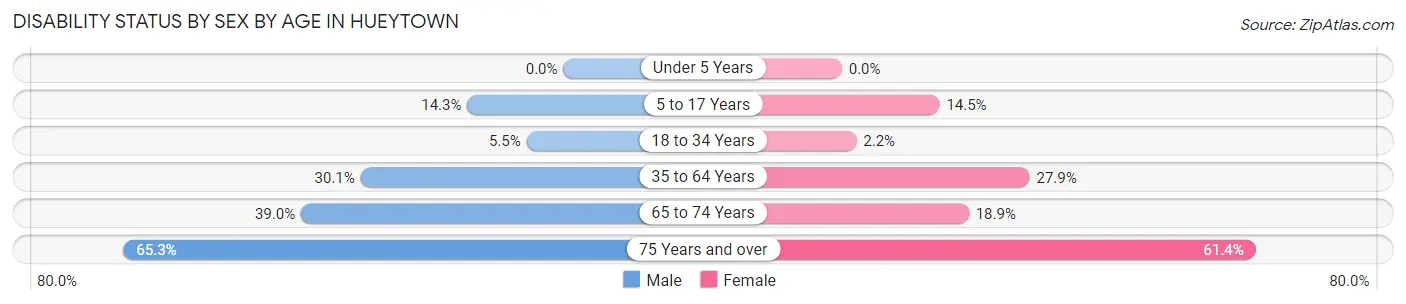
| Age Bracket | Male | Female |
| Under 5 Years | 0 (0.0%) | 0 (0.0%) |
| 5 to 17 Years | 206 (14.3%) | 244 (14.5%) |
| 18 to 34 Years | 106 (5.5%) | 38 (2.2%) |
| 35 to 64 Years | 765 (30.1%) | 887 (27.9%) |
| 65 to 74 Years | 284 (39.0%) | 161 (18.9%) |
| 75 Years and over | 290 (65.3%) | 368 (61.4%) |
Disability Class by Sex by Age in Hueytown
Disability Class: Hearing Difficulty
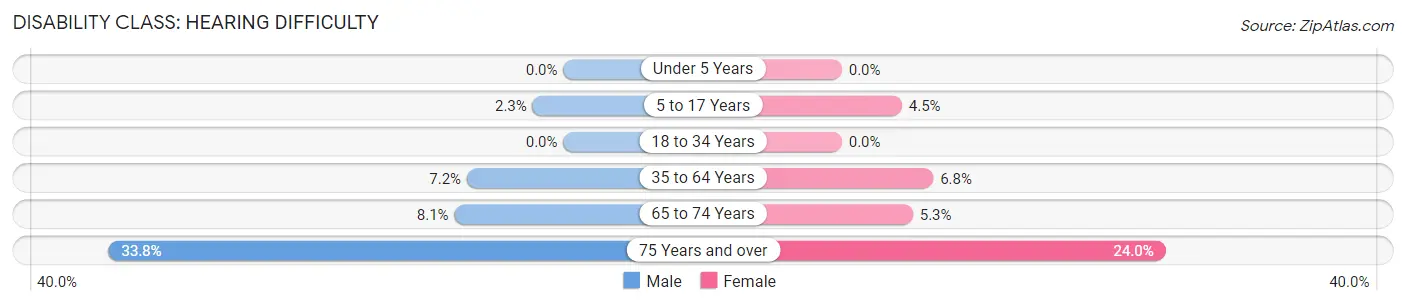
| Age Bracket | Male | Female |
| Under 5 Years | 0 (0.0%) | 0 (0.0%) |
| 5 to 17 Years | 33 (2.3%) | 75 (4.5%) |
| 18 to 34 Years | 0 (0.0%) | 0 (0.0%) |
| 35 to 64 Years | 182 (7.2%) | 216 (6.8%) |
| 65 to 74 Years | 59 (8.1%) | 45 (5.3%) |
| 75 Years and over | 150 (33.8%) | 144 (24.0%) |
Disability Class: Vision Difficulty
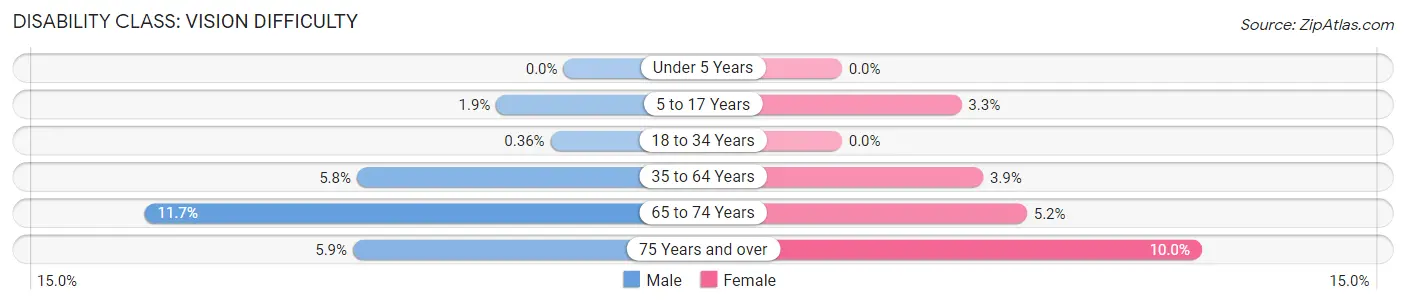
| Age Bracket | Male | Female |
| Under 5 Years | 0 (0.0%) | 0 (0.0%) |
| 5 to 17 Years | 27 (1.9%) | 56 (3.3%) |
| 18 to 34 Years | 7 (0.4%) | 0 (0.0%) |
| 35 to 64 Years | 146 (5.8%) | 125 (3.9%) |
| 65 to 74 Years | 85 (11.7%) | 44 (5.1%) |
| 75 Years and over | 26 (5.9%) | 60 (10.0%) |
Disability Class: Cognitive Difficulty
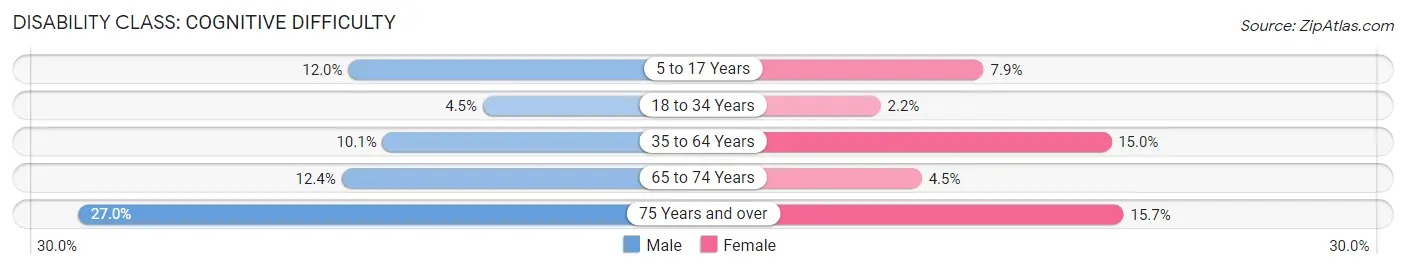
| Age Bracket | Male | Female |
| 5 to 17 Years | 173 (12.0%) | 133 (7.9%) |
| 18 to 34 Years | 87 (4.5%) | 38 (2.2%) |
| 35 to 64 Years | 256 (10.1%) | 477 (15.0%) |
| 65 to 74 Years | 90 (12.3%) | 38 (4.4%) |
| 75 Years and over | 120 (27.0%) | 94 (15.7%) |
Disability Class: Ambulatory Difficulty
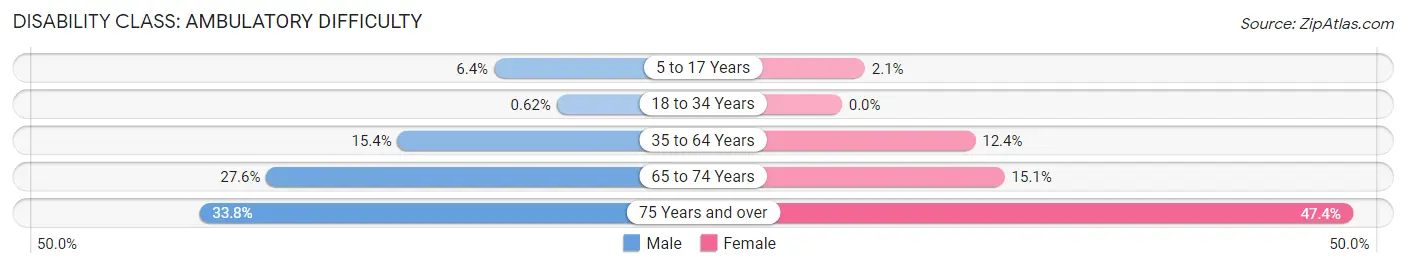
| Age Bracket | Male | Female |
| 5 to 17 Years | 93 (6.4%) | 36 (2.1%) |
| 18 to 34 Years | 12 (0.6%) | 0 (0.0%) |
| 35 to 64 Years | 391 (15.4%) | 394 (12.4%) |
| 65 to 74 Years | 201 (27.6%) | 129 (15.1%) |
| 75 Years and over | 150 (33.8%) | 284 (47.4%) |
Disability Class: Self-Care Difficulty
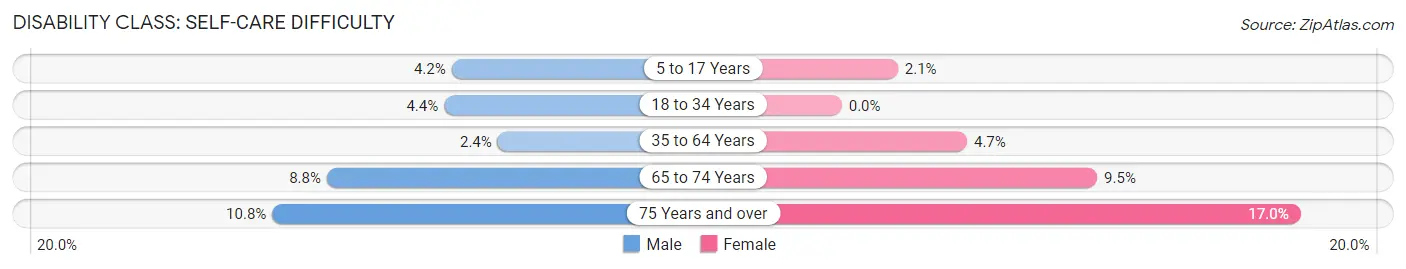
| Age Bracket | Male | Female |
| 5 to 17 Years | 60 (4.2%) | 35 (2.1%) |
| 18 to 34 Years | 86 (4.4%) | 0 (0.0%) |
| 35 to 64 Years | 62 (2.4%) | 148 (4.6%) |
| 65 to 74 Years | 64 (8.8%) | 81 (9.5%) |
| 75 Years and over | 48 (10.8%) | 102 (17.0%) |
Technology Access in Hueytown
Computing Device Access in Hueytown
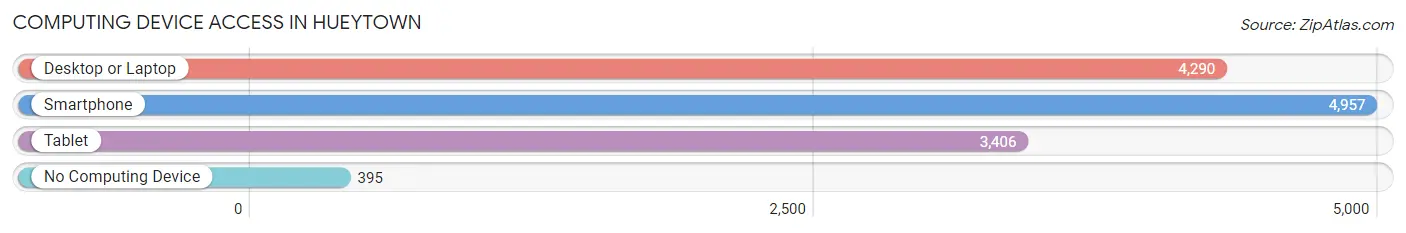
| Device Type | # Households | % Households |
| Desktop or Laptop | 4,290 | 73.9% |
| Smartphone | 4,957 | 85.4% |
| Tablet | 3,406 | 58.7% |
| No Computing Device | 395 | 6.8% |
| Total | 5,803 | 100.0% |
Internet Access in Hueytown
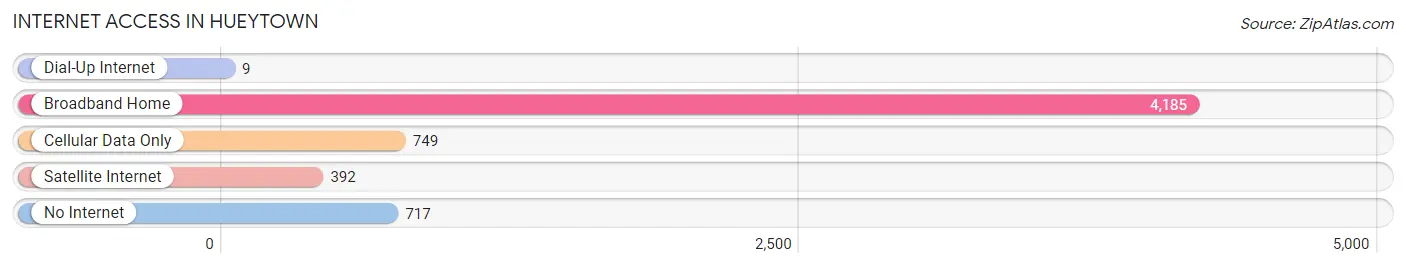
| Internet Type | # Households | % Households |
| Dial-Up Internet | 9 | 0.2% |
| Broadband Home | 4,185 | 72.1% |
| Cellular Data Only | 749 | 12.9% |
| Satellite Internet | 392 | 6.8% |
| No Internet | 717 | 12.4% |
| Total | 5,803 | 100.0% |
Hueytown Summary
Hueytown is a city located in Jefferson County, Alabama, United States. It is part of the Birmingham-Hoover Metropolitan Statistical Area. As of the 2010 census, the population of Hueytown was 16,105.
History
Hueytown was founded in 1887 by the Huey brothers, who were among the first settlers in the area. The brothers, William, John, and Thomas, were from Georgia and had come to Alabama in search of a better life. They purchased land in the area and began to build a small community. The town was named after the brothers and was incorporated in 1901.
The town grew slowly but steadily over the years, and by the 1950s, it had become a thriving community. The town was home to several businesses, including a cotton mill, a sawmill, and a brick factory. The town also had a school, a post office, and a few churches.
In the 1960s, the town began to experience rapid growth due to the influx of people from the nearby cities of Birmingham and Bessemer. This growth was fueled by the construction of Interstate 20/59, which connected Hueytown to the larger cities. The town also benefited from the growth of the steel industry in the area.
Geography
Hueytown is located in central Jefferson County, Alabama, at 33°25'N 86°59'W. It is situated on the western edge of the Birmingham-Hoover Metropolitan Statistical Area. The city is bordered by the cities of Bessemer to the north, Brighton to the east, and Midfield to the south.
The city has a total area of 8.3 square miles, of which 8.2 square miles is land and 0.1 square miles is water. The city is located in the Jones Valley, which is part of the Appalachian Mountains. The city is located at the intersection of Interstate 20/59 and Alabama State Route 150.
Economy
Hueytown's economy is largely based on manufacturing and retail. The city is home to several large manufacturing companies, including U.S. Steel, Vulcan Materials, and Nucor Steel. The city is also home to several retail stores, including Walmart, Target, and Lowe's.
The city is also home to several medical facilities, including the Hueytown Medical Center and the Hueytown Family Health Center. The city is also home to several educational institutions, including the University of Alabama at Birmingham, Jefferson State Community College, and the University of Montevallo.
Demographics
As of the 2010 census, there were 16,105 people, 6,541 households, and 4,541 families residing in the city. The population density was 1,945.3 people per square mile. The racial makeup of the city was 73.3% White, 22.2% African American, 0.3% Native American, 0.7% Asian, 0.1% Pacific Islander, 1.3% from other races, and 2.3% from two or more races. Hispanic or Latino of any race were 3.2% of the population.
The median income for a household in the city was $41,945, and the median income for a family was $50,945. Males had a median income of $37,945 versus $30,945 for females. The per capita income for the city was $20,945. About 11.3% of families and 14.2% of the population were below the poverty line, including 19.2% of those under age 18 and 8.2% of those age 65 or over.
Common Questions
What is Per Capita Income in Hueytown?
Per Capita income in Hueytown is $28,299.
What is the Median Family Income in Hueytown?
Median Family Income in Hueytown is $71,780.
What is the Median Household income in Hueytown?
Median Household Income in Hueytown is $64,176.
What is Income or Wage Gap in Hueytown?
Income or Wage Gap in Hueytown is 20.3%.
Women in Hueytown earn 79.7 cents for every dollar earned by a man.
What is Family Income Deficit in Hueytown?
Family Income Deficit in Hueytown is $12,518.
Families that are below poverty line in Hueytown earn $12,518 less on average than the poverty threshold level.
What is Inequality or Gini Index in Hueytown?
Inequality or Gini Index in Hueytown is 0.37.
What is the Total Population of Hueytown?
Total Population of Hueytown is 16,655.
What is the Total Male Population of Hueytown?
Total Male Population of Hueytown is 7,557.
What is the Total Female Population of Hueytown?
Total Female Population of Hueytown is 9,098.
What is the Ratio of Males per 100 Females in Hueytown?
There are 83.06 Males per 100 Females in Hueytown.
What is the Ratio of Females per 100 Males in Hueytown?
There are 120.39 Females per 100 Males in Hueytown.
What is the Median Population Age in Hueytown?
Median Population Age in Hueytown is 36.1 Years.
What is the Average Family Size in Hueytown
Average Family Size in Hueytown is 3.4 People.
What is the Average Household Size in Hueytown
Average Household Size in Hueytown is 2.8 People.
How Large is the Labor Force in Hueytown?
There are 8,013 People in the Labor Forcein in Hueytown.
What is the Percentage of People in the Labor Force in Hueytown?
62.2% of People are in the Labor Force in Hueytown.
What is the Unemployment Rate in Hueytown?
Unemployment Rate in Hueytown is 7.8%.