Wetumpka, AL Map & Demographics
Wetumpka Map
Wetumpka Overview
$29,330
PER CAPITA INCOME
$62,225
AVG FAMILY INCOME
$54,477
AVG HOUSEHOLD INCOME
10.8%
WAGE / INCOME GAP [ % ]
89.2¢/ $1
WAGE / INCOME GAP [ $ ]
0.41
INEQUALITY / GINI INDEX
7,129
TOTAL POPULATION
3,442
MALE POPULATION
3,687
FEMALE POPULATION
93.36
MALES / 100 FEMALES
107.12
FEMALES / 100 MALES
33.5
MEDIAN AGE
3.0
AVG FAMILY SIZE
2.5
AVG HOUSEHOLD SIZE
3,070
LABOR FORCE [ PEOPLE ]
55.6%
PERCENT IN LABOR FORCE
5.4%
UNEMPLOYMENT RATE
Wetumpka Area Codes
Income in Wetumpka
Income Overview in Wetumpka
Per Capita Income in Wetumpka is $29,330, while median incomes of families and households are $62,225 and $54,477 respectively.
| Characteristic | Number | Measure |
| Per Capita Income | 7,129 | $29,330 |
| Median Family Income | 1,703 | $62,225 |
| Mean Family Income | 1,703 | $92,168 |
| Median Household Income | 2,402 | $54,477 |
| Mean Household Income | 2,402 | $82,182 |
| Income Deficit | 1,703 | $0 |
| Wage / Income Gap (%) | 7,129 | 10.82% |
| Wage / Income Gap ($) | 7,129 | 89.18¢ per $1 |
| Gini / Inequality Index | 7,129 | 0.41 |
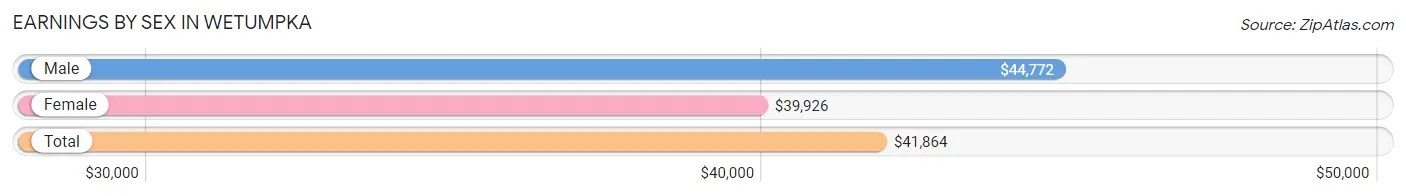
Earnings by Sex in Wetumpka
Average Earnings in Wetumpka are $41,864, $44,772 for men and $39,926 for women, a difference of 10.8%.
| Sex | Number | Average Earnings |
| Male | 1,449 (45.4%) | $44,772 |
| Female | 1,740 (54.6%) | $39,926 |
| Total | 3,189 (100.0%) | $41,864 |
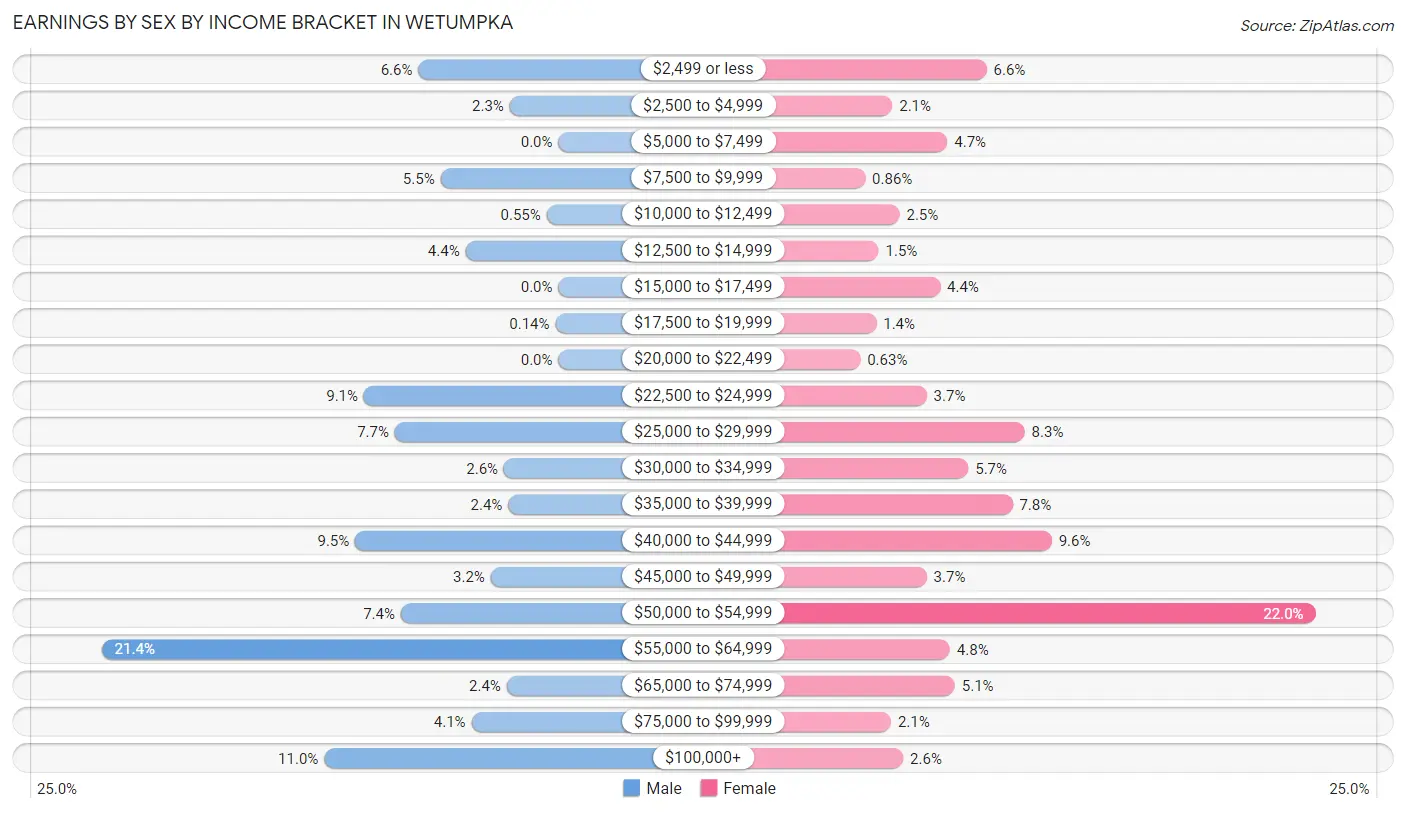
Earnings by Sex by Income Bracket in Wetumpka
The most common earnings brackets in Wetumpka are $55,000 to $64,999 for men (310 | 21.4%) and $50,000 to $54,999 for women (382 | 22.0%).
| Income | Male | Female |
| $2,499 or less | 95 (6.6%) | 114 (6.6%) |
| $2,500 to $4,999 | 33 (2.3%) | 37 (2.1%) |
| $5,000 to $7,499 | 0 (0.0%) | 82 (4.7%) |
| $7,500 to $9,999 | 80 (5.5%) | 15 (0.9%) |
| $10,000 to $12,499 | 8 (0.5%) | 43 (2.5%) |
| $12,500 to $14,999 | 63 (4.3%) | 26 (1.5%) |
| $15,000 to $17,499 | 0 (0.0%) | 76 (4.4%) |
| $17,500 to $19,999 | 2 (0.1%) | 24 (1.4%) |
| $20,000 to $22,499 | 0 (0.0%) | 11 (0.6%) |
| $22,500 to $24,999 | 132 (9.1%) | 65 (3.7%) |
| $25,000 to $29,999 | 111 (7.7%) | 145 (8.3%) |
| $30,000 to $34,999 | 37 (2.5%) | 99 (5.7%) |
| $35,000 to $39,999 | 34 (2.4%) | 135 (7.8%) |
| $40,000 to $44,999 | 138 (9.5%) | 167 (9.6%) |
| $45,000 to $49,999 | 46 (3.2%) | 65 (3.7%) |
| $50,000 to $54,999 | 107 (7.4%) | 382 (22.0%) |
| $55,000 to $64,999 | 310 (21.4%) | 84 (4.8%) |
| $65,000 to $74,999 | 35 (2.4%) | 88 (5.1%) |
| $75,000 to $99,999 | 59 (4.1%) | 36 (2.1%) |
| $100,000+ | 159 (11.0%) | 46 (2.6%) |
| Total | 1,449 (100.0%) | 1,740 (100.0%) |
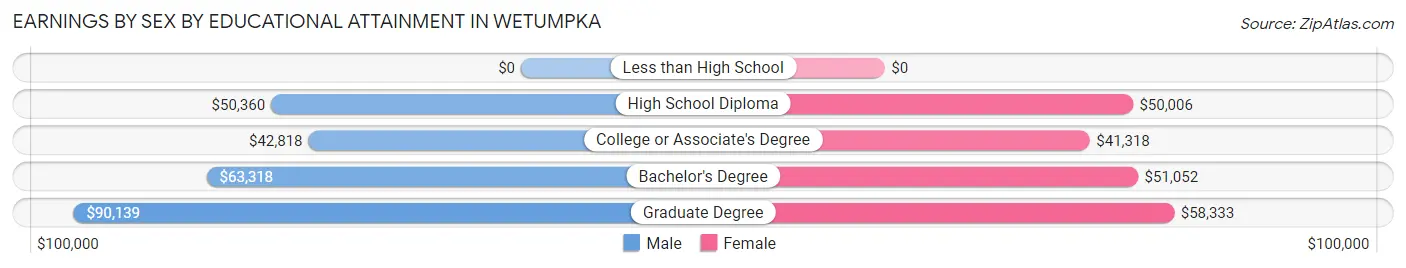
Earnings by Sex by Educational Attainment in Wetumpka
Average earnings in Wetumpka are $51,094 for men and $41,766 for women, a difference of 18.3%. Men with an educational attainment of graduate degree enjoy the highest average annual earnings of $90,139, while those with college or associate's degree education earn the least with $42,818. Women with an educational attainment of graduate degree earn the most with the average annual earnings of $58,333, while those with college or associate's degree education have the smallest earnings of $41,318.
| Educational Attainment | Male Income | Female Income |
| Less than High School | - | - |
| High School Diploma | $50,360 | $50,006 |
| College or Associate's Degree | $42,818 | $41,318 |
| Bachelor's Degree | $63,318 | $51,052 |
| Graduate Degree | $90,139 | $58,333 |
| Total | $51,094 | $41,766 |
Family Income in Wetumpka
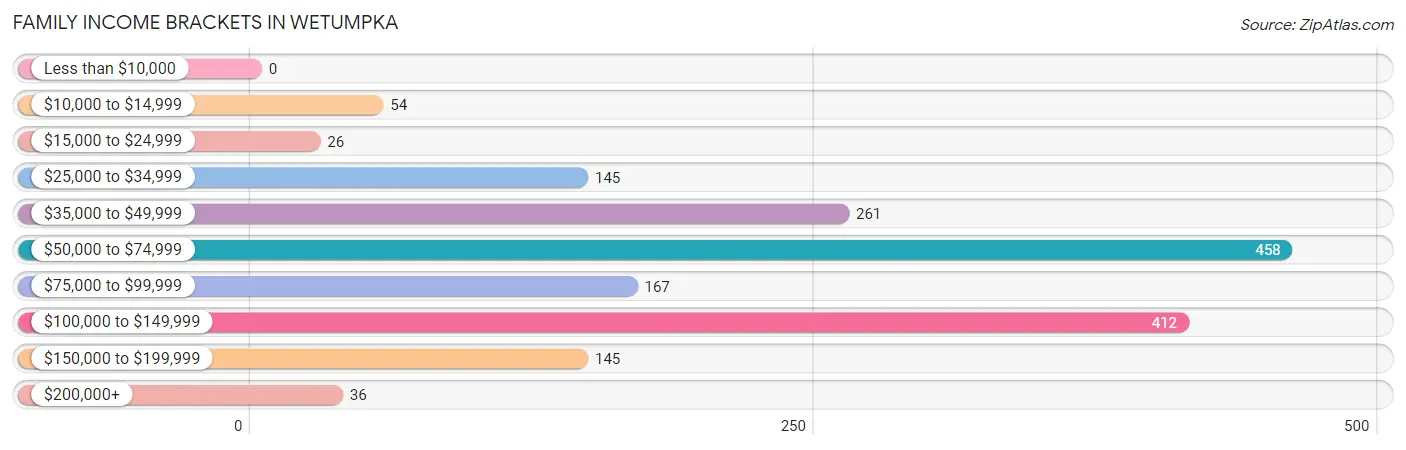
Family Income Brackets in Wetumpka
According to the Wetumpka family income data, there are 458 families falling into the $50,000 to $74,999 income range, which is the most common income bracket and makes up 26.9% of all families.
| Income Bracket | # Families | % Families |
| Less than $10,000 | 0 | 0.0% |
| $10,000 to $14,999 | 54 | 3.2% |
| $15,000 to $24,999 | 26 | 1.5% |
| $25,000 to $34,999 | 145 | 8.5% |
| $35,000 to $49,999 | 261 | 15.3% |
| $50,000 to $74,999 | 458 | 26.9% |
| $75,000 to $99,999 | 167 | 9.8% |
| $100,000 to $149,999 | 412 | 24.2% |
| $150,000 to $199,999 | 145 | 8.5% |
| $200,000+ | 36 | 2.1% |
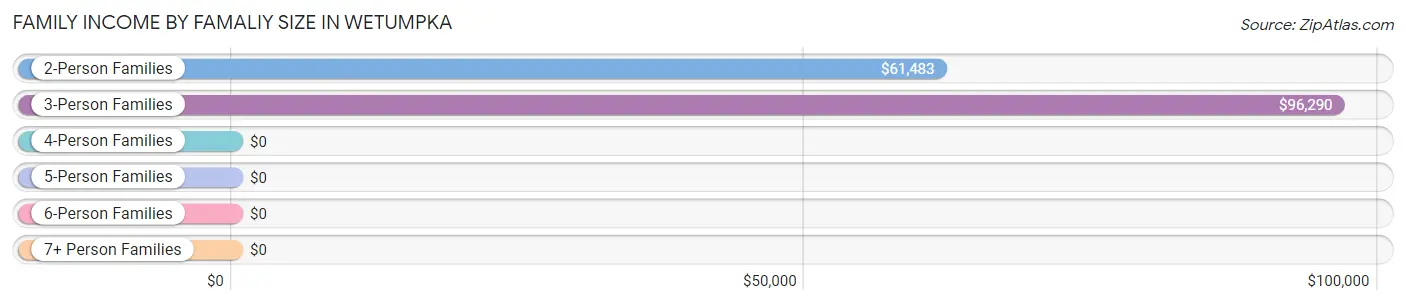
Family Income by Famaliy Size in Wetumpka
3-person families (527 | 30.9%) account for the highest median family income in Wetumpka with $96,290 per family, while 3-person families (527 | 30.9%) have the highest median income of $32,097 per family member.
| Income Bracket | # Families | Median Income |
| 2-Person Families | 854 (50.1%) | $61,483 |
| 3-Person Families | 527 (30.9%) | $96,290 |
| 4-Person Families | 142 (8.3%) | $0 |
| 5-Person Families | 23 (1.3%) | $0 |
| 6-Person Families | 132 (7.7%) | $0 |
| 7+ Person Families | 25 (1.5%) | $0 |
| Total | 1,703 (100.0%) | $62,225 |
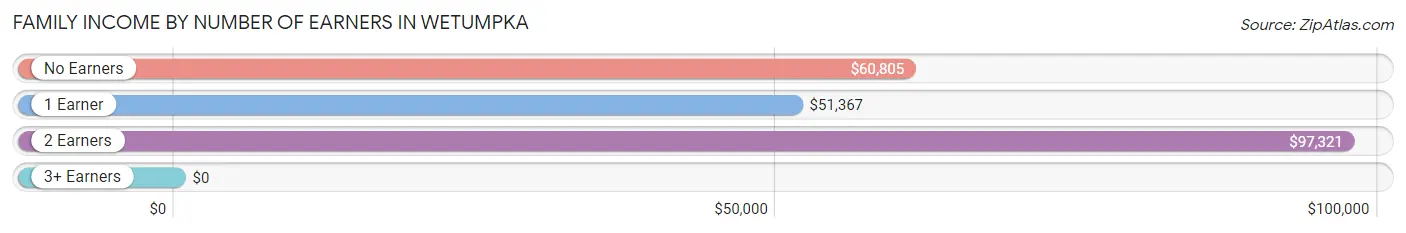
Family Income by Number of Earners in Wetumpka
| Number of Earners | # Families | Median Income |
| No Earners | 160 (9.4%) | $60,805 |
| 1 Earner | 732 (43.0%) | $51,367 |
| 2 Earners | 775 (45.5%) | $97,321 |
| 3+ Earners | 36 (2.1%) | $0 |
| Total | 1,703 (100.0%) | $62,225 |
Household Income in Wetumpka
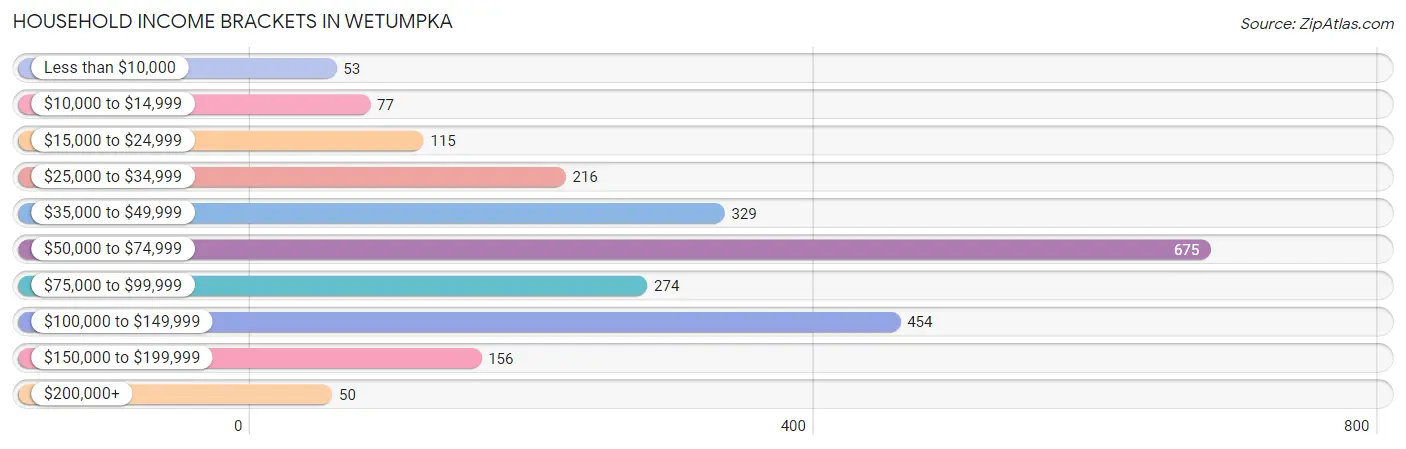
Household Income Brackets in Wetumpka
With 675 households falling in the category, the $50,000 to $74,999 income range is the most frequent in Wetumpka, accounting for 28.1% of all households. In contrast, only 50 households (2.1%) fall into the $200,000+ income bracket, making it the least populous group.
| Income Bracket | # Households | % Households |
| Less than $10,000 | 53 | 2.2% |
| $10,000 to $14,999 | 77 | 3.2% |
| $15,000 to $24,999 | 115 | 4.8% |
| $25,000 to $34,999 | 216 | 9.0% |
| $35,000 to $49,999 | 329 | 13.7% |
| $50,000 to $74,999 | 675 | 28.1% |
| $75,000 to $99,999 | 274 | 11.4% |
| $100,000 to $149,999 | 454 | 18.9% |
| $150,000 to $199,999 | 156 | 6.5% |
| $200,000+ | 50 | 2.1% |
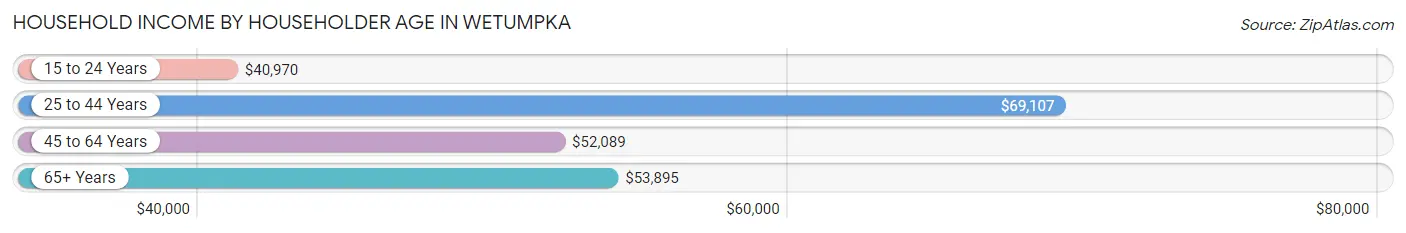
Household Income by Householder Age in Wetumpka
The median household income in Wetumpka is $54,477, with the highest median household income of $69,107 found in the 25 to 44 years age bracket for the primary householder. A total of 1,066 households (44.4%) fall into this category. Meanwhile, the 15 to 24 years age bracket for the primary householder has the lowest median household income of $40,970, with 119 households (5.0%) in this group.
| Income Bracket | # Households | Median Income |
| 15 to 24 Years | 119 (5.0%) | $40,970 |
| 25 to 44 Years | 1,066 (44.4%) | $69,107 |
| 45 to 64 Years | 579 (24.1%) | $52,089 |
| 65+ Years | 638 (26.6%) | $53,895 |
| Total | 2,402 (100.0%) | $54,477 |
Poverty in Wetumpka
Income Below Poverty by Sex and Age in Wetumpka
With 13.4% poverty level for males and 13.1% for females among the residents of Wetumpka, 5 year old males and 12 to 14 year old females are the most vulnerable to poverty, with 47 males (43.9%) and 32 females (34.4%) in their respective age groups living below the poverty level.
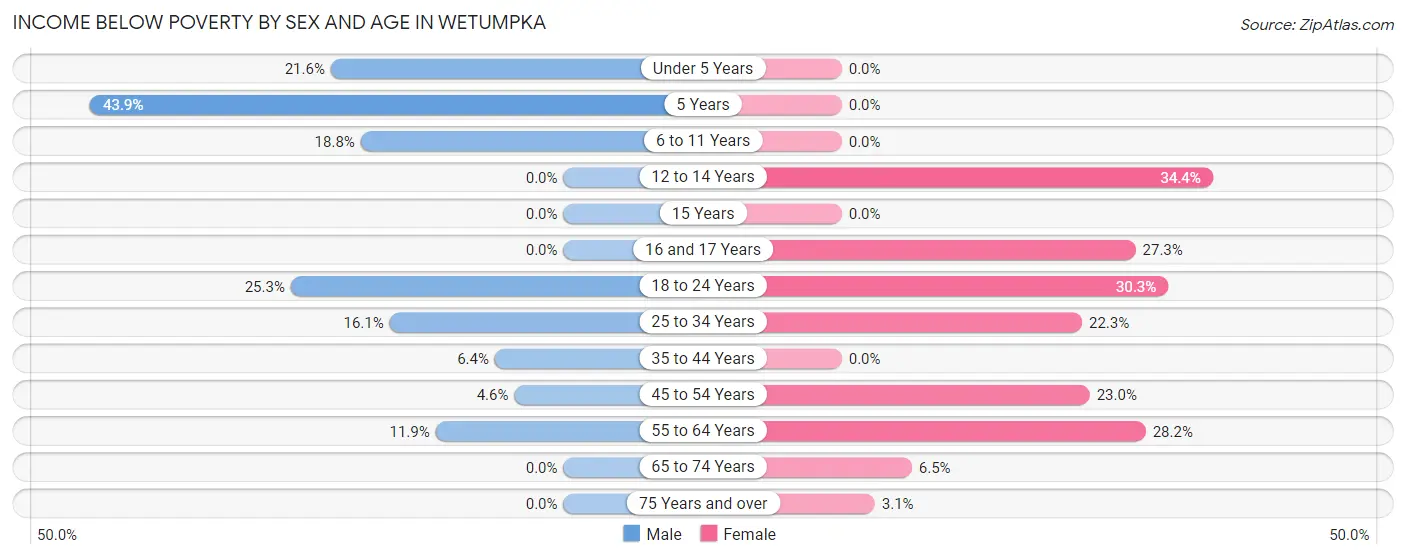
| Age Bracket | Male | Female |
| Under 5 Years | 76 (21.6%) | 0 (0.0%) |
| 5 Years | 47 (43.9%) | 0 (0.0%) |
| 6 to 11 Years | 38 (18.8%) | 0 (0.0%) |
| 12 to 14 Years | 0 (0.0%) | 32 (34.4%) |
| 15 Years | 0 (0.0%) | 0 (0.0%) |
| 16 and 17 Years | 0 (0.0%) | 15 (27.3%) |
| 18 to 24 Years | 63 (25.3%) | 76 (30.3%) |
| 25 to 34 Years | 101 (16.1%) | 130 (22.3%) |
| 35 to 44 Years | 22 (6.4%) | 0 (0.0%) |
| 45 to 54 Years | 10 (4.5%) | 78 (23.0%) |
| 55 to 64 Years | 28 (11.9%) | 55 (28.2%) |
| 65 to 74 Years | 0 (0.0%) | 13 (6.5%) |
| 75 Years and over | 0 (0.0%) | 11 (3.1%) |
| Total | 385 (13.4%) | 410 (13.1%) |
Income Above Poverty by Sex and Age in Wetumpka
According to the poverty statistics in Wetumpka, males aged 12 to 14 years and females aged under 5 years are the age groups that are most secure financially, with 100.0% of males and 100.0% of females in these age groups living above the poverty line.
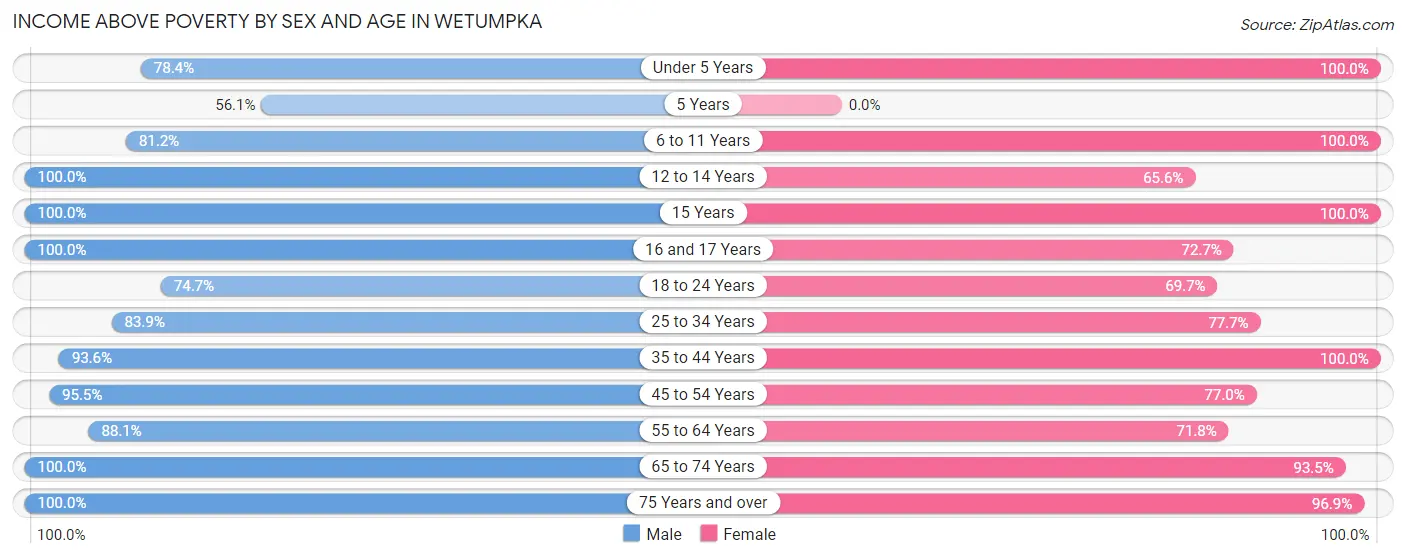
| Age Bracket | Male | Female |
| Under 5 Years | 276 (78.4%) | 124 (100.0%) |
| 5 Years | 60 (56.1%) | 0 (0.0%) |
| 6 to 11 Years | 164 (81.2%) | 401 (100.0%) |
| 12 to 14 Years | 96 (100.0%) | 61 (65.6%) |
| 15 Years | 120 (100.0%) | 20 (100.0%) |
| 16 and 17 Years | 38 (100.0%) | 40 (72.7%) |
| 18 to 24 Years | 186 (74.7%) | 175 (69.7%) |
| 25 to 34 Years | 525 (83.9%) | 453 (77.7%) |
| 35 to 44 Years | 324 (93.6%) | 522 (100.0%) |
| 45 to 54 Years | 210 (95.5%) | 261 (77.0%) |
| 55 to 64 Years | 208 (88.1%) | 140 (71.8%) |
| 65 to 74 Years | 196 (100.0%) | 187 (93.5%) |
| 75 Years and over | 85 (100.0%) | 347 (96.9%) |
| Total | 2,488 (86.6%) | 2,731 (87.0%) |
Income Below Poverty Among Married-Couple Families in Wetumpka
The poverty statistics for married-couple families in Wetumpka show that 5.8% or 63 of the total 1,089 families live below the poverty line. Families with 1 or 2 children have the highest poverty rate of 16.4%, comprising of 63 families. On the other hand, families with no children have the lowest poverty rate of 0.0%, which includes 0 families.
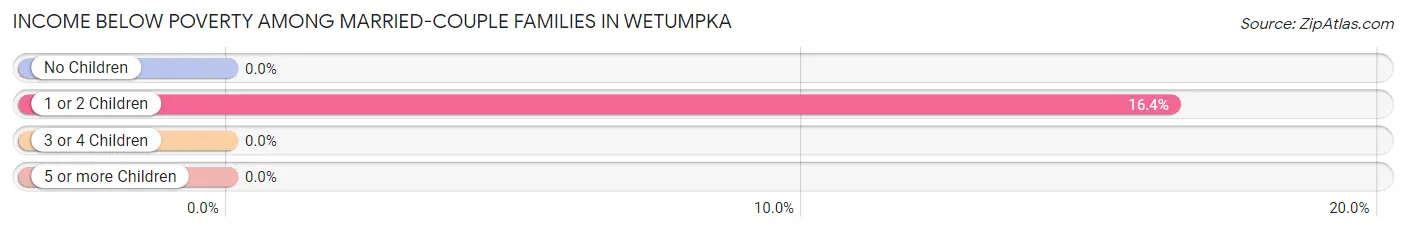
| Children | Above Poverty | Below Poverty |
| No Children | 557 (100.0%) | 0 (0.0%) |
| 1 or 2 Children | 321 (83.6%) | 63 (16.4%) |
| 3 or 4 Children | 148 (100.0%) | 0 (0.0%) |
| 5 or more Children | 0 (0.0%) | 0 (0.0%) |
| Total | 1,026 (94.2%) | 63 (5.8%) |
Income Below Poverty Among Single-Parent Households in Wetumpka
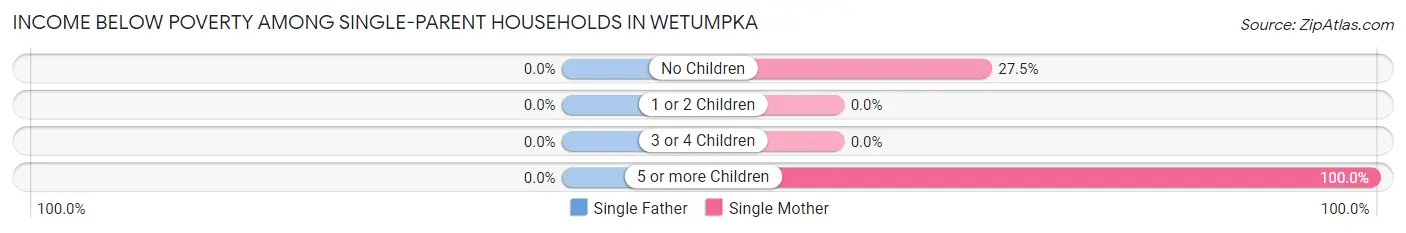
| Children | Single Father | Single Mother |
| No Children | 0 (0.0%) | 55 (27.5%) |
| 1 or 2 Children | 0 (0.0%) | 0 (0.0%) |
| 3 or 4 Children | 0 (0.0%) | 0 (0.0%) |
| 5 or more Children | 0 (0.0%) | 25 (100.0%) |
| Total | 0 (0.0%) | 80 (15.2%) |
Income Below Poverty Among Married-Couple vs Single-Parent Households in Wetumpka
The poverty data for Wetumpka shows that 63 of the married-couple family households (5.8%) and 80 of the single-parent households (13.0%) are living below the poverty level. Within the married-couple family households, those with 1 or 2 children have the highest poverty rate, with 63 households (16.4%) falling below the poverty line. Among the single-parent households, those with 5 or more children have the highest poverty rate, with 25 household (100.0%) living below poverty.
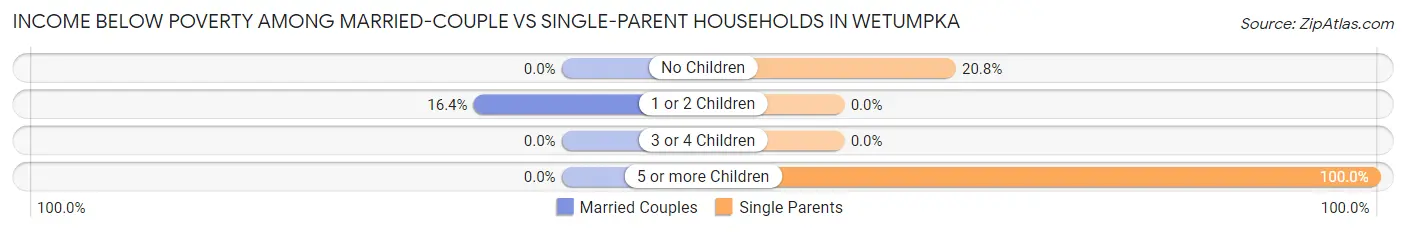
| Children | Married-Couple Families | Single-Parent Households |
| No Children | 0 (0.0%) | 55 (20.7%) |
| 1 or 2 Children | 63 (16.4%) | 0 (0.0%) |
| 3 or 4 Children | 0 (0.0%) | 0 (0.0%) |
| 5 or more Children | 0 (0.0%) | 25 (100.0%) |
| Total | 63 (5.8%) | 80 (13.0%) |
Race in Wetumpka
The most populous races in Wetumpka are White / Caucasian (4,548 | 63.8%), Black / African American (2,175 | 30.5%), and Two or more Races (226 | 3.2%).
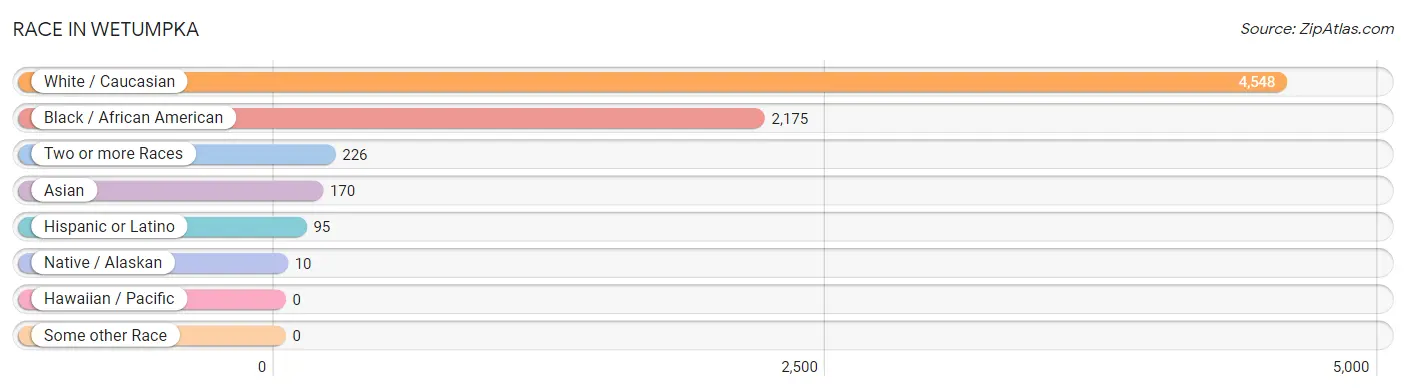
| Race | # Population | % Population |
| Asian | 170 | 2.4% |
| Black / African American | 2,175 | 30.5% |
| Hawaiian / Pacific | 0 | 0.0% |
| Hispanic or Latino | 95 | 1.3% |
| Native / Alaskan | 10 | 0.1% |
| White / Caucasian | 4,548 | 63.8% |
| Two or more Races | 226 | 3.2% |
| Some other Race | 0 | 0.0% |
| Total | 7,129 | 100.0% |
Ancestry in Wetumpka
The most populous ancestries reported in Wetumpka are American (1,216 | 17.1%), English (690 | 9.7%), Irish (690 | 9.7%), German (329 | 4.6%), and Scotch-Irish (182 | 2.5%), together accounting for 43.6% of all Wetumpka residents.
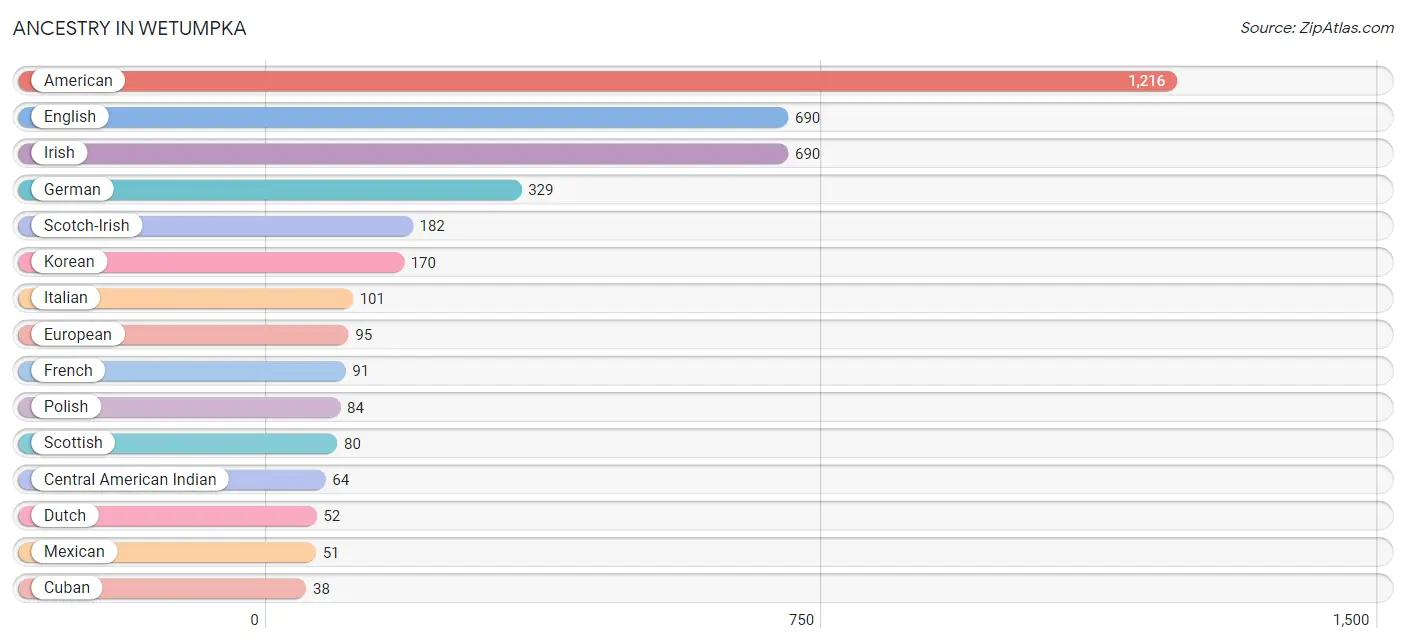
| Ancestry | # Population | % Population |
| African | 18 | 0.3% |
| American | 1,216 | 17.1% |
| Blackfeet | 4 | 0.1% |
| British | 14 | 0.2% |
| Central American Indian | 64 | 0.9% |
| Cherokee | 35 | 0.5% |
| Cuban | 38 | 0.5% |
| Danish | 6 | 0.1% |
| Dutch | 52 | 0.7% |
| English | 690 | 9.7% |
| European | 95 | 1.3% |
| French | 91 | 1.3% |
| German | 329 | 4.6% |
| Greek | 6 | 0.1% |
| Irish | 690 | 9.7% |
| Italian | 101 | 1.4% |
| Korean | 170 | 2.4% |
| Mexican | 51 | 0.7% |
| Norwegian | 12 | 0.2% |
| Polish | 84 | 1.2% |
| Puerto Rican | 6 | 0.1% |
| Russian | 1 | 0.0% |
| Scotch-Irish | 182 | 2.5% |
| Scottish | 80 | 1.1% |
| Seminole | 6 | 0.1% |
| Subsaharan African | 18 | 0.3% |
| Swiss | 1 | 0.0% |
| Welsh | 22 | 0.3% | View All 28 Rows |
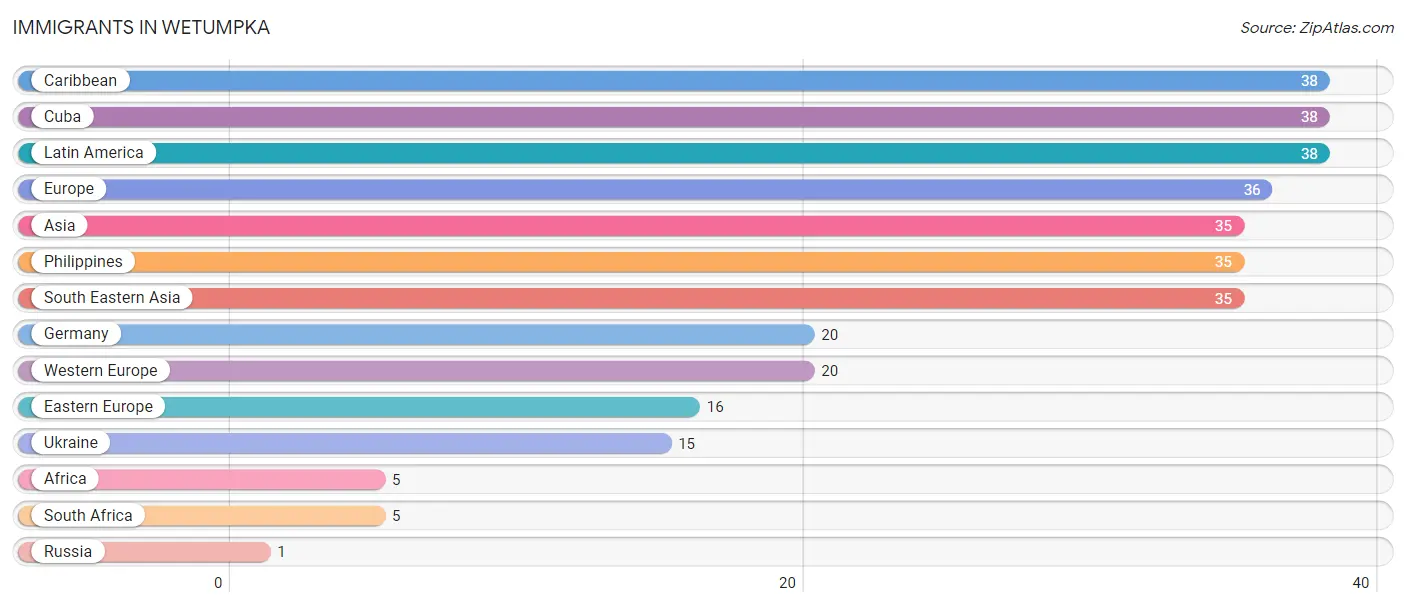
Immigrants in Wetumpka
The most numerous immigrant groups reported in Wetumpka came from Caribbean (38 | 0.5%), Cuba (38 | 0.5%), Latin America (38 | 0.5%), Europe (36 | 0.5%), and Asia (35 | 0.5%), together accounting for 2.6% of all Wetumpka residents.
| Immigration Origin | # Population | % Population |
| Africa | 5 | 0.1% |
| Asia | 35 | 0.5% |
| Caribbean | 38 | 0.5% |
| Cuba | 38 | 0.5% |
| Eastern Europe | 16 | 0.2% |
| Europe | 36 | 0.5% |
| Germany | 20 | 0.3% |
| Latin America | 38 | 0.5% |
| Philippines | 35 | 0.5% |
| Russia | 1 | 0.0% |
| South Africa | 5 | 0.1% |
| South Eastern Asia | 35 | 0.5% |
| Ukraine | 15 | 0.2% |
| Western Europe | 20 | 0.3% | View All 14 Rows |
Sex and Age in Wetumpka
Sex and Age in Wetumpka
The most populous age groups in Wetumpka are 25 to 29 Years (462 | 13.4%) for men and 25 to 29 Years (469 | 12.7%) for women.
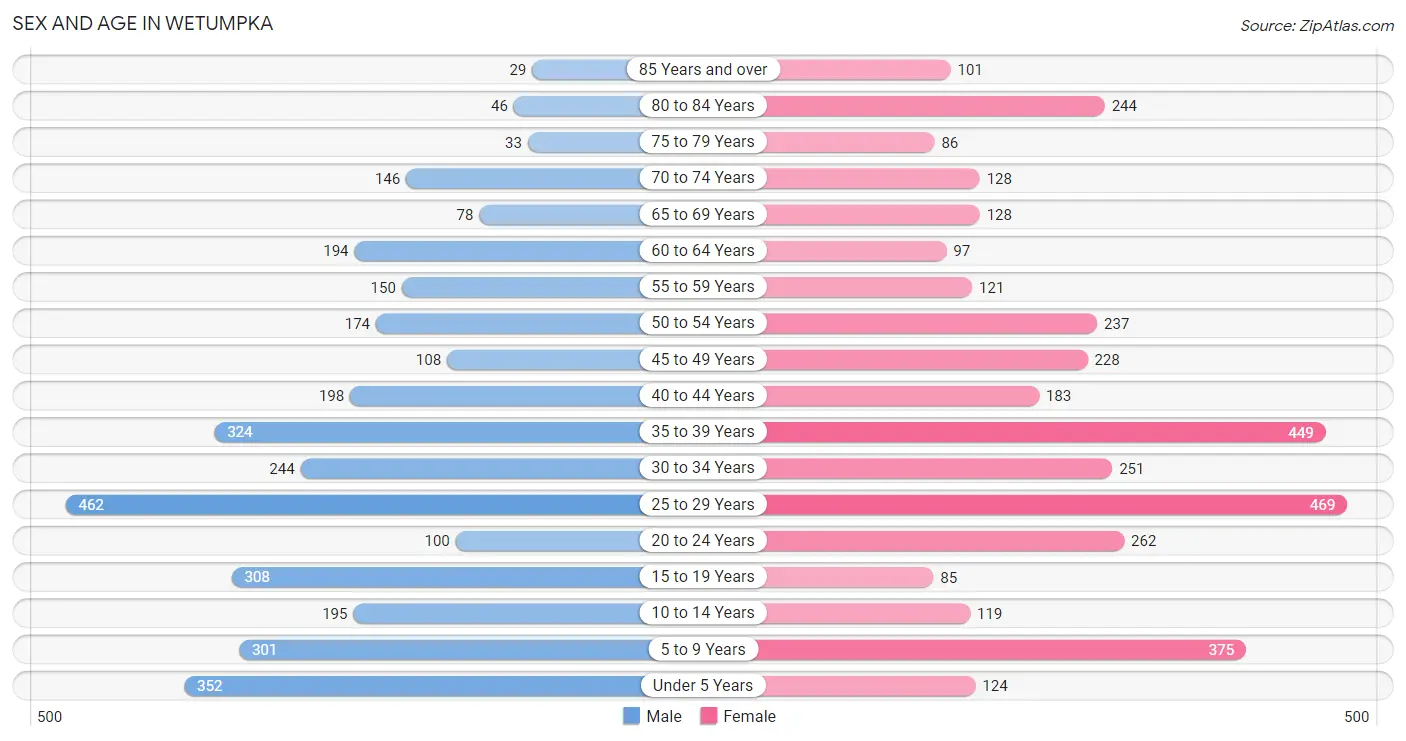
| Age Bracket | Male | Female |
| Under 5 Years | 352 (10.2%) | 124 (3.4%) |
| 5 to 9 Years | 301 (8.7%) | 375 (10.2%) |
| 10 to 14 Years | 195 (5.7%) | 119 (3.2%) |
| 15 to 19 Years | 308 (8.9%) | 85 (2.3%) |
| 20 to 24 Years | 100 (2.9%) | 262 (7.1%) |
| 25 to 29 Years | 462 (13.4%) | 469 (12.7%) |
| 30 to 34 Years | 244 (7.1%) | 251 (6.8%) |
| 35 to 39 Years | 324 (9.4%) | 449 (12.2%) |
| 40 to 44 Years | 198 (5.8%) | 183 (5.0%) |
| 45 to 49 Years | 108 (3.1%) | 228 (6.2%) |
| 50 to 54 Years | 174 (5.1%) | 237 (6.4%) |
| 55 to 59 Years | 150 (4.4%) | 121 (3.3%) |
| 60 to 64 Years | 194 (5.6%) | 97 (2.6%) |
| 65 to 69 Years | 78 (2.3%) | 128 (3.5%) |
| 70 to 74 Years | 146 (4.2%) | 128 (3.5%) |
| 75 to 79 Years | 33 (1.0%) | 86 (2.3%) |
| 80 to 84 Years | 46 (1.3%) | 244 (6.6%) |
| 85 Years and over | 29 (0.8%) | 101 (2.7%) |
| Total | 3,442 (100.0%) | 3,687 (100.0%) |
Families and Households in Wetumpka
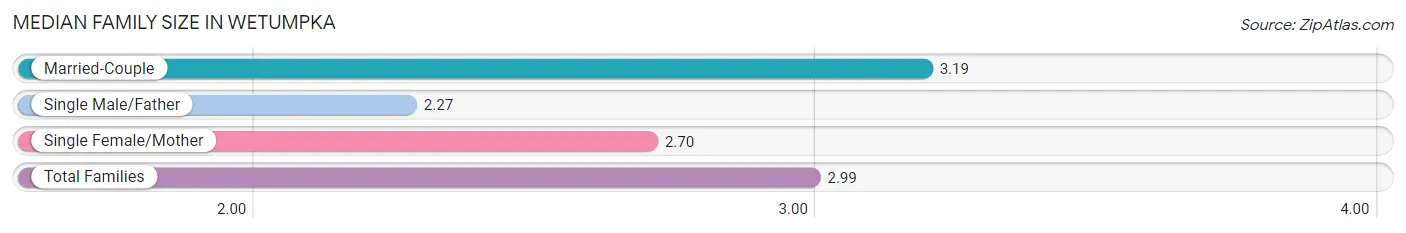
Median Family Size in Wetumpka
The median family size in Wetumpka is 2.99 persons per family, with married-couple families (1,089 | 63.9%) accounting for the largest median family size of 3.19 persons per family. On the other hand, single male/father families (89 | 5.2%) represent the smallest median family size with 2.27 persons per family.
| Family Type | # Families | Family Size |
| Married-Couple | 1,089 (63.9%) | 3.19 |
| Single Male/Father | 89 (5.2%) | 2.27 |
| Single Female/Mother | 525 (30.8%) | 2.70 |
| Total Families | 1,703 (100.0%) | 2.99 |
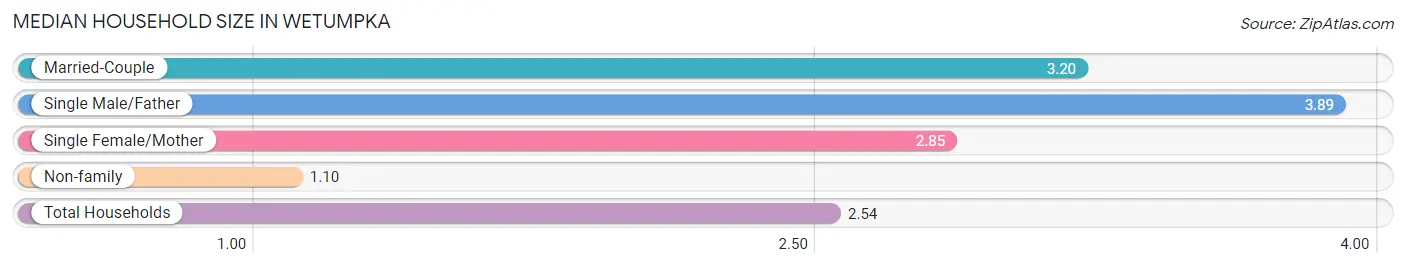
Median Household Size in Wetumpka
The median household size in Wetumpka is 2.54 persons per household, with single male/father households (89 | 3.7%) accounting for the largest median household size of 3.89 persons per household. non-family households (699 | 29.1%) represent the smallest median household size with 1.10 persons per household.
| Household Type | # Households | Household Size |
| Married-Couple | 1,089 (45.3%) | 3.20 |
| Single Male/Father | 89 (3.7%) | 3.89 |
| Single Female/Mother | 525 (21.9%) | 2.85 |
| Non-family | 699 (29.1%) | 1.10 |
| Total Households | 2,402 (100.0%) | 2.54 |
Household Size by Marriage Status in Wetumpka
Out of a total of 2,402 households in Wetumpka, 1,703 (70.9%) are family households, while 699 (29.1%) are nonfamily households. The most numerous type of family households are 2-person households, comprising 782, and the most common type of nonfamily households are 1-person households, comprising 631.

| Household Size | Family Households | Nonfamily Households |
| 1-Person Households | - | 631 (26.3%) |
| 2-Person Households | 782 (32.6%) | 68 (2.8%) |
| 3-Person Households | 553 (23.0%) | 0 (0.0%) |
| 4-Person Households | 151 (6.3%) | 0 (0.0%) |
| 5-Person Households | 60 (2.5%) | 0 (0.0%) |
| 6-Person Households | 132 (5.5%) | 0 (0.0%) |
| 7+ Person Households | 25 (1.0%) | 0 (0.0%) |
| Total | 1,703 (70.9%) | 699 (29.1%) |
Female Fertility in Wetumpka
Fertility by Age in Wetumpka
Average fertility rate in Wetumpka is 92.0 births per 1,000 women. Women in the age bracket of 20 to 34 years have the highest fertility rate with 183.0 births per 1,000 women. Women in the age bracket of 20 to 34 years acount for 100.0% of all women with births.
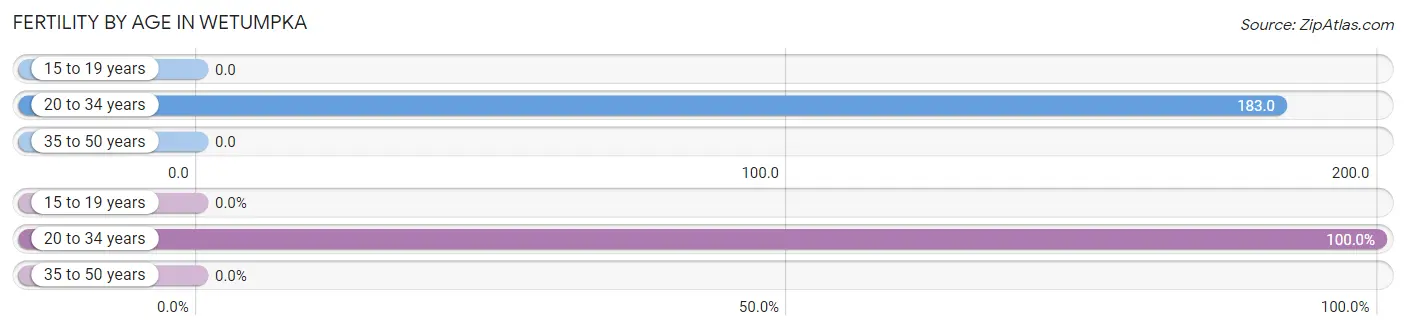
| Age Bracket | Women with Births | Births / 1,000 Women |
| 15 to 19 years | 0 (0.0%) | 0.0 |
| 20 to 34 years | 180 (100.0%) | 183.0 |
| 35 to 50 years | 0 (0.0%) | 0.0 |
| Total | 180 (100.0%) | 92.0 |
Fertility by Age by Marriage Status in Wetumpka
47.8% of women with births (180) in Wetumpka are married. The highest percentage of unmarried women with births falls into 20 to 34 years age bracket with 52.2% of them unmarried at the time of birth, while the lowest percentage of unmarried women with births belong to 20 to 34 years age bracket with 52.2% of them unmarried.
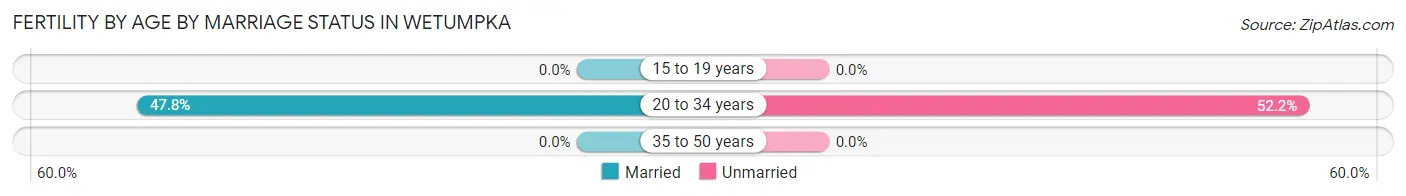
| Age Bracket | Married | Unmarried |
| 15 to 19 years | 0 (0.0%) | 0 (0.0%) |
| 20 to 34 years | 86 (47.8%) | 94 (52.2%) |
| 35 to 50 years | 0 (0.0%) | 0 (0.0%) |
| Total | 86 (47.8%) | 94 (52.2%) |
Fertility by Education in Wetumpka
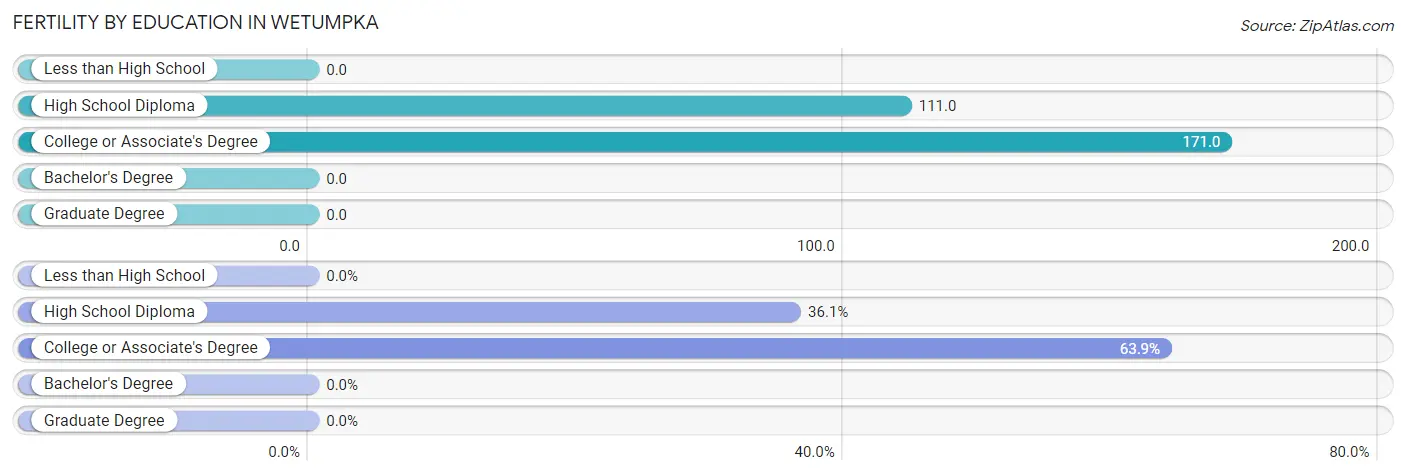
| Educational Attainment | Women with Births | Births / 1,000 Women |
| Less than High School | 0 (0.0%) | 0.0 |
| High School Diploma | 65 (36.1%) | 111.0 |
| College or Associate's Degree | 115 (63.9%) | 171.0 |
| Bachelor's Degree | 0 (0.0%) | 0.0 |
| Graduate Degree | 0 (0.0%) | 0.0 |
| Total | 180 (100.0%) | 92.0 |
Fertility by Education by Marriage Status in Wetumpka
52.2% of women with births in Wetumpka are unmarried. Women with the educational attainment of high school diploma are most likely to be married with 100.0% of them married at childbirth, while women with the educational attainment of college or associate's degree are least likely to be married with 81.7% of them unmarried at childbirth.
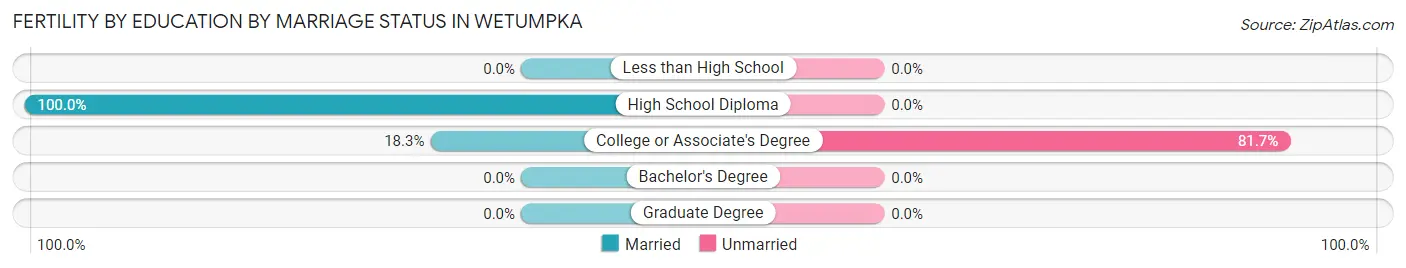
| Educational Attainment | Married | Unmarried |
| Less than High School | 0 (0.0%) | 0 (0.0%) |
| High School Diploma | 65 (100.0%) | 0 (0.0%) |
| College or Associate's Degree | 21 (18.3%) | 94 (81.7%) |
| Bachelor's Degree | 0 (0.0%) | 0 (0.0%) |
| Graduate Degree | 0 (0.0%) | 0 (0.0%) |
| Total | 86 (47.8%) | 94 (52.2%) |
Employment Characteristics in Wetumpka
Employment by Class of Employer in Wetumpka
Among the 2,773 employed individuals in Wetumpka, private company employees (1,914 | 69.0%), local government employees (238 | 8.6%), and not-for-profit organizations (193 | 7.0%) make up the most common classes of employment.
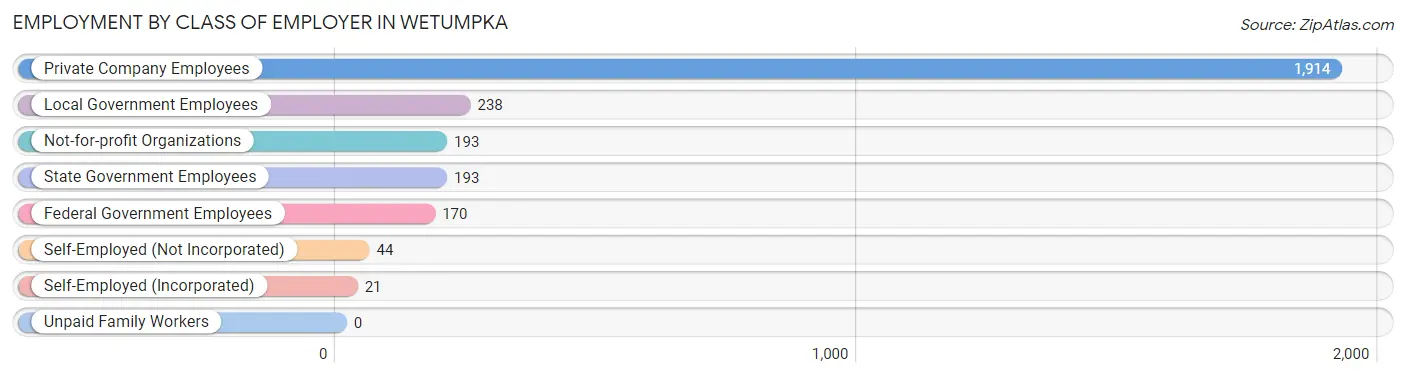
| Employer Class | # Employees | % Employees |
| Private Company Employees | 1,914 | 69.0% |
| Self-Employed (Incorporated) | 21 | 0.8% |
| Self-Employed (Not Incorporated) | 44 | 1.6% |
| Not-for-profit Organizations | 193 | 7.0% |
| Local Government Employees | 238 | 8.6% |
| State Government Employees | 193 | 7.0% |
| Federal Government Employees | 170 | 6.1% |
| Unpaid Family Workers | 0 | 0.0% |
| Total | 2,773 | 100.0% |
Employment Status by Age in Wetumpka
According to the labor force statistics for Wetumpka, out of the total population over 16 years of age (5,521), 55.6% or 3,070 individuals are in the labor force, with 5.4% or 166 of them unemployed. The age group with the highest labor force participation rate is 20 to 24 years, with 87.6% or 317 individuals in the labor force. Within the labor force, the 30 to 34 years age range has the highest percentage of unemployed individuals, with 19.8% or 63 of them being unemployed.
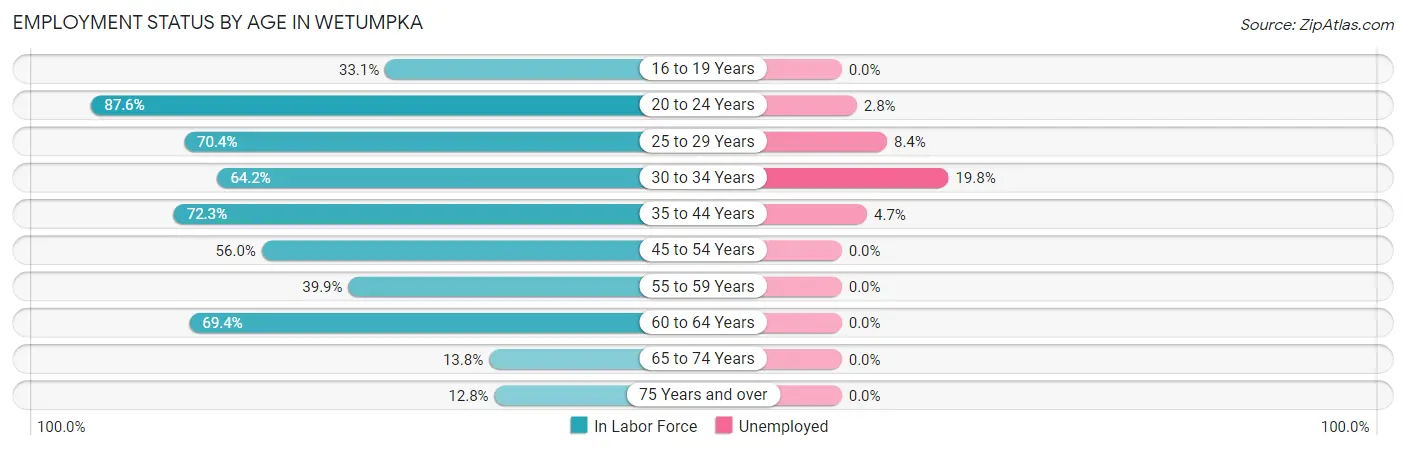
| Age Bracket | In Labor Force | Unemployed |
| 16 to 19 Years | 83 (33.1%) | 0 (0.0%) |
| 20 to 24 Years | 317 (87.6%) | 9 (2.8%) |
| 25 to 29 Years | 655 (70.4%) | 55 (8.4%) |
| 30 to 34 Years | 318 (64.2%) | 63 (19.8%) |
| 35 to 44 Years | 834 (72.3%) | 39 (4.7%) |
| 45 to 54 Years | 418 (56.0%) | 0 (0.0%) |
| 55 to 59 Years | 108 (39.9%) | 0 (0.0%) |
| 60 to 64 Years | 202 (69.4%) | 0 (0.0%) |
| 65 to 74 Years | 66 (13.8%) | 0 (0.0%) |
| 75 Years and over | 69 (12.8%) | 0 (0.0%) |
| Total | 3,070 (55.6%) | 166 (5.4%) |
Employment Status by Educational Attainment in Wetumpka
According to labor force statistics for Wetumpka, 65.2% of individuals (2,536) out of the total population between 25 and 64 years of age (3,889) are in the labor force, with 6.2% or 157 of them being unemployed. The group with the highest labor force participation rate are those with the educational attainment of bachelor's degree or higher, with 79.6% or 596 individuals in the labor force. Within the labor force, individuals with high school diploma education have the highest percentage of unemployment, with 11.8% or 102 of them being unemployed.
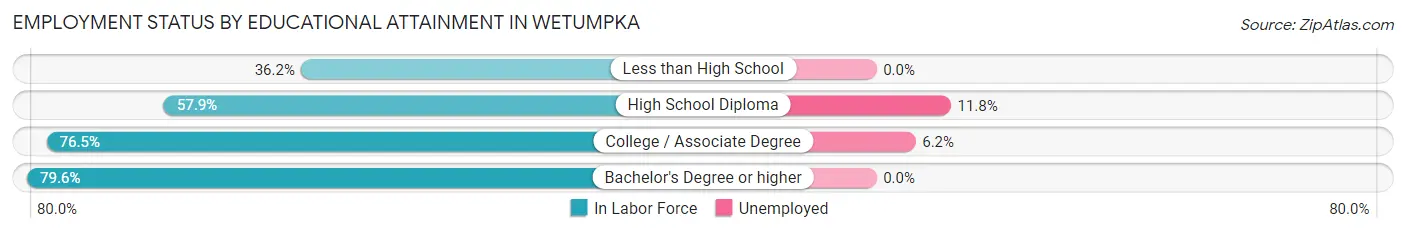
| Educational Attainment | In Labor Force | Unemployed |
| Less than High School | 165 (36.2%) | 0 (0.0%) |
| High School Diploma | 868 (57.9%) | 177 (11.8%) |
| College / Associate Degree | 907 (76.5%) | 73 (6.2%) |
| Bachelor's Degree or higher | 596 (79.6%) | 0 (0.0%) |
| Total | 2,536 (65.2%) | 241 (6.2%) |
Employment Occupations by Sex in Wetumpka
Management, Business, Science and Arts Occupations
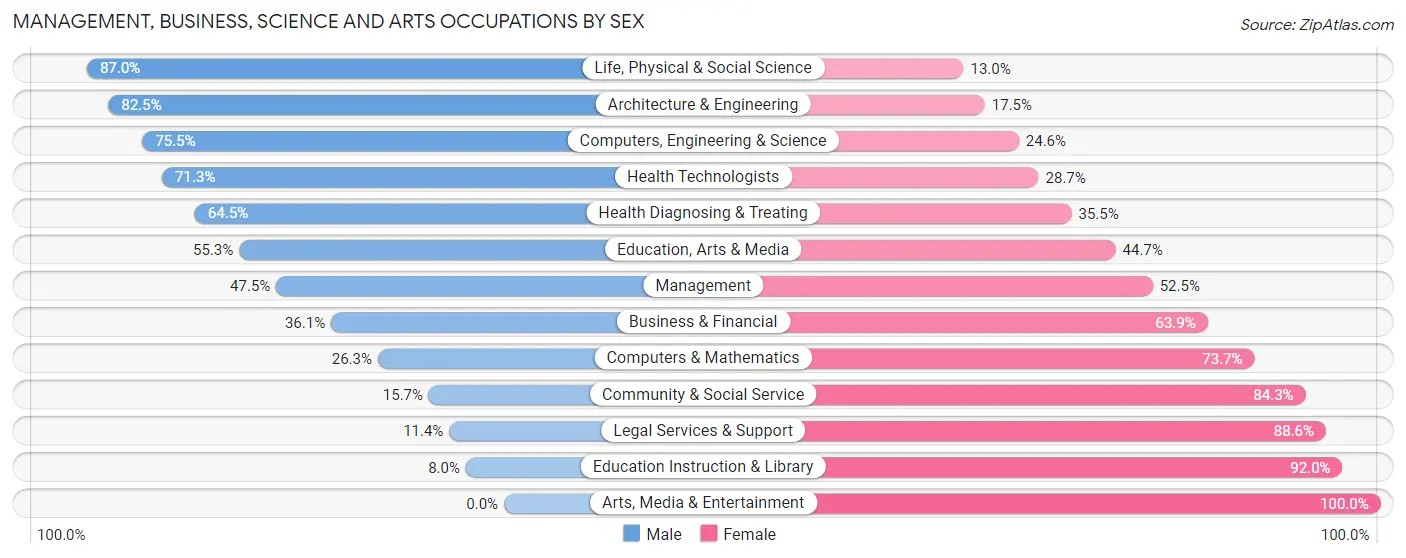
The most common Management, Business, Science and Arts occupations in Wetumpka are Community & Social Service (268 | 9.3%), Business & Financial (230 | 8.0%), Computers, Engineering & Science (224 | 7.8%), Health Diagnosing & Treating (166 | 5.8%), and Health Technologists (150 | 5.2%).
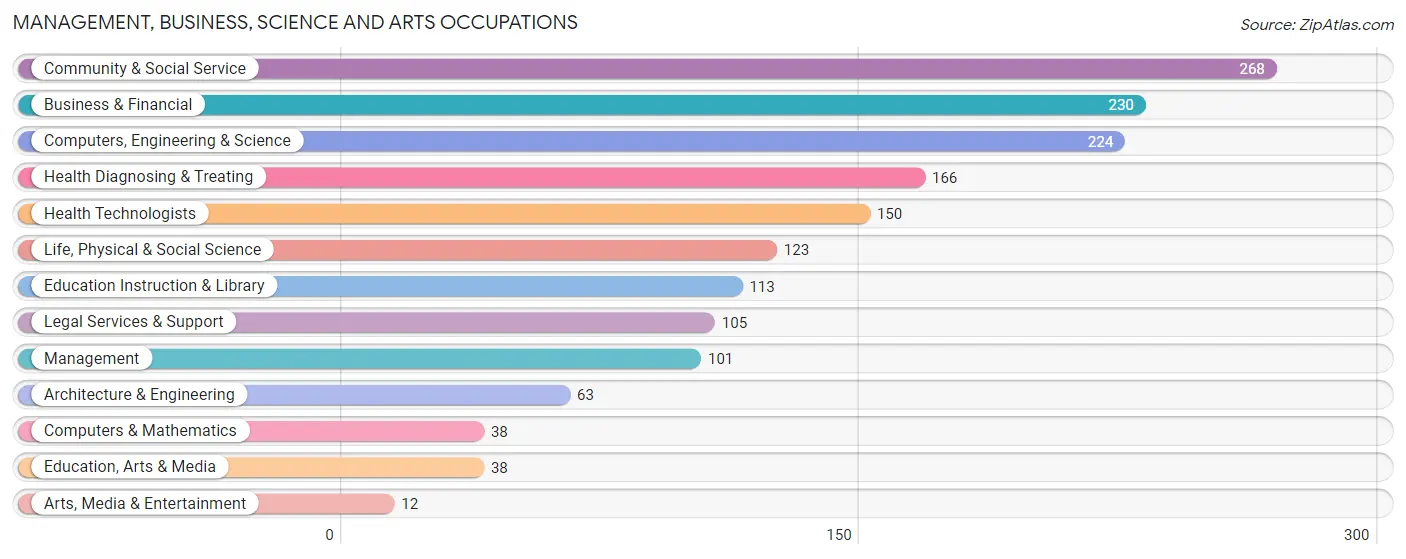
Management, Business, Science and Arts Occupations by Sex
Within the Management, Business, Science and Arts occupations in Wetumpka, the most male-oriented occupations are Life, Physical & Social Science (87.0%), Architecture & Engineering (82.5%), and Computers, Engineering & Science (75.4%), while the most female-oriented occupations are Arts, Media & Entertainment (100.0%), Education Instruction & Library (92.0%), and Legal Services & Support (88.6%).
| Occupation | Male | Female |
| Management | 48 (47.5%) | 53 (52.5%) |
| Business & Financial | 83 (36.1%) | 147 (63.9%) |
| Computers, Engineering & Science | 169 (75.4%) | 55 (24.5%) |
| Computers & Mathematics | 10 (26.3%) | 28 (73.7%) |
| Architecture & Engineering | 52 (82.5%) | 11 (17.5%) |
| Life, Physical & Social Science | 107 (87.0%) | 16 (13.0%) |
| Community & Social Service | 42 (15.7%) | 226 (84.3%) |
| Education, Arts & Media | 21 (55.3%) | 17 (44.7%) |
| Legal Services & Support | 12 (11.4%) | 93 (88.6%) |
| Education Instruction & Library | 9 (8.0%) | 104 (92.0%) |
| Arts, Media & Entertainment | 0 (0.0%) | 12 (100.0%) |
| Health Diagnosing & Treating | 107 (64.5%) | 59 (35.5%) |
| Health Technologists | 107 (71.3%) | 43 (28.7%) |
| Total (Category) | 449 (45.4%) | 540 (54.6%) |
| Total (Overall) | 1,331 (46.1%) | 1,554 (53.9%) |
Services Occupations
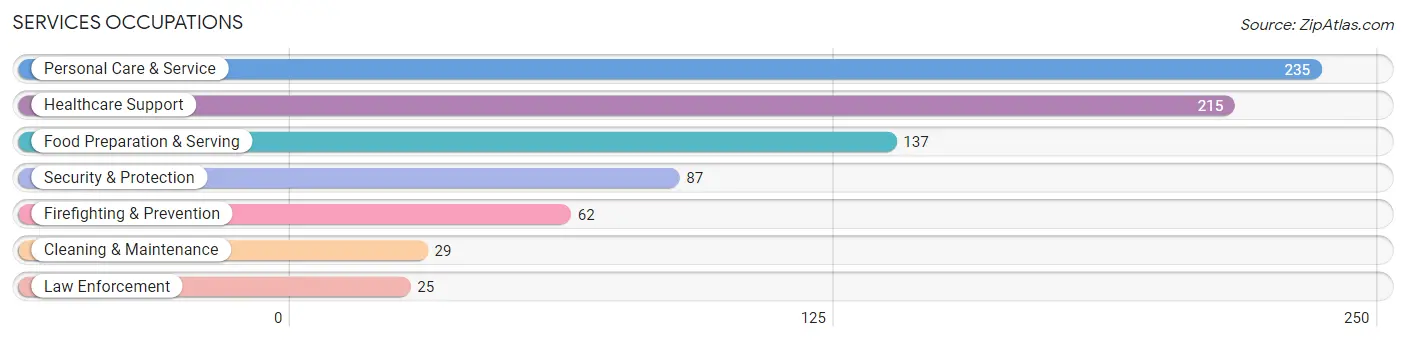
The most common Services occupations in Wetumpka are Personal Care & Service (235 | 8.2%), Healthcare Support (215 | 7.4%), Food Preparation & Serving (137 | 4.8%), Security & Protection (87 | 3.0%), and Firefighting & Prevention (62 | 2.1%).
Services Occupations by Sex
Within the Services occupations in Wetumpka, the most male-oriented occupations are Security & Protection (100.0%), Firefighting & Prevention (100.0%), and Law Enforcement (100.0%), while the most female-oriented occupations are Cleaning & Maintenance (100.0%), Personal Care & Service (96.2%), and Healthcare Support (27.4%).
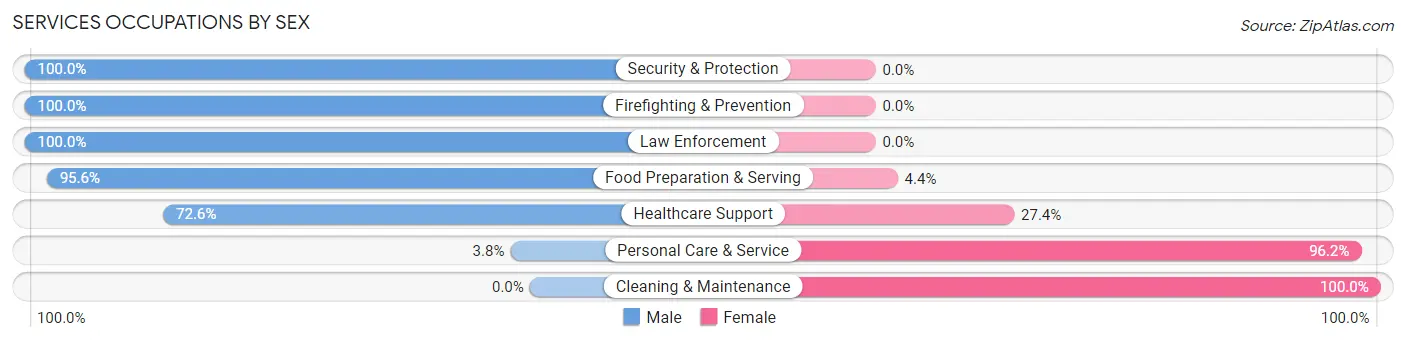
| Occupation | Male | Female |
| Healthcare Support | 156 (72.6%) | 59 (27.4%) |
| Security & Protection | 87 (100.0%) | 0 (0.0%) |
| Firefighting & Prevention | 62 (100.0%) | 0 (0.0%) |
| Law Enforcement | 25 (100.0%) | 0 (0.0%) |
| Food Preparation & Serving | 131 (95.6%) | 6 (4.4%) |
| Cleaning & Maintenance | 0 (0.0%) | 29 (100.0%) |
| Personal Care & Service | 9 (3.8%) | 226 (96.2%) |
| Total (Category) | 383 (54.5%) | 320 (45.5%) |
| Total (Overall) | 1,331 (46.1%) | 1,554 (53.9%) |
Sales and Office Occupations
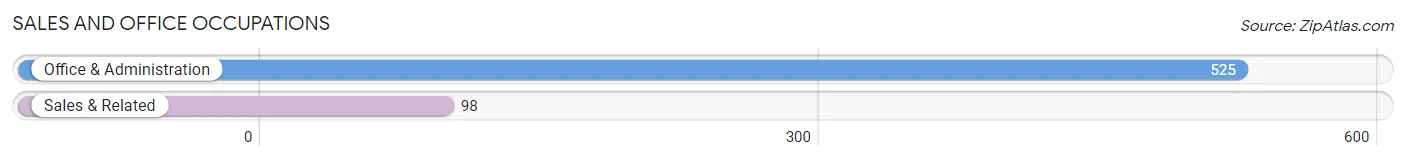
The most common Sales and Office occupations in Wetumpka are Office & Administration (525 | 18.2%), and Sales & Related (98 | 3.4%).
Sales and Office Occupations by Sex
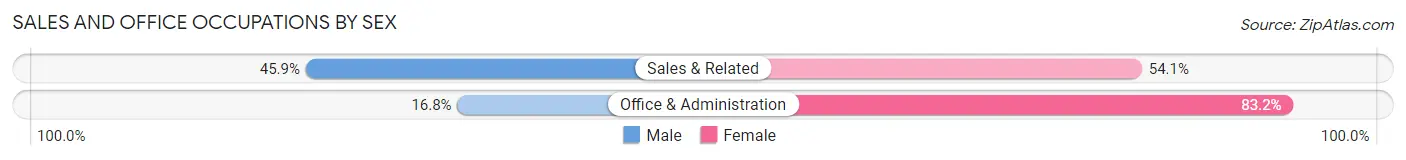
| Occupation | Male | Female |
| Sales & Related | 45 (45.9%) | 53 (54.1%) |
| Office & Administration | 88 (16.8%) | 437 (83.2%) |
| Total (Category) | 133 (21.3%) | 490 (78.6%) |
| Total (Overall) | 1,331 (46.1%) | 1,554 (53.9%) |
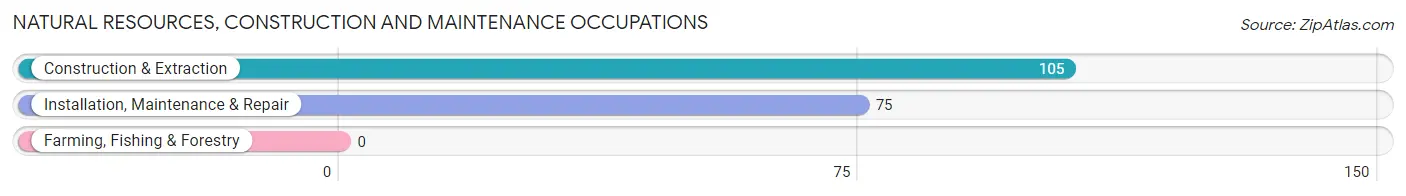
Natural Resources, Construction and Maintenance Occupations
The most common Natural Resources, Construction and Maintenance occupations in Wetumpka are Construction & Extraction (105 | 3.6%), and Installation, Maintenance & Repair (75 | 2.6%).
Natural Resources, Construction and Maintenance Occupations by Sex
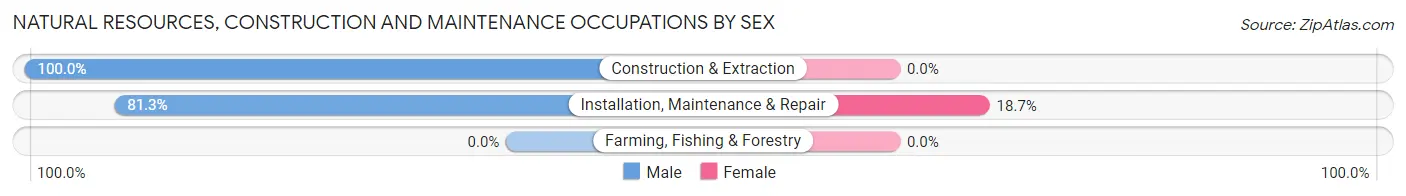
| Occupation | Male | Female |
| Farming, Fishing & Forestry | 0 (0.0%) | 0 (0.0%) |
| Construction & Extraction | 105 (100.0%) | 0 (0.0%) |
| Installation, Maintenance & Repair | 61 (81.3%) | 14 (18.7%) |
| Total (Category) | 166 (92.2%) | 14 (7.8%) |
| Total (Overall) | 1,331 (46.1%) | 1,554 (53.9%) |
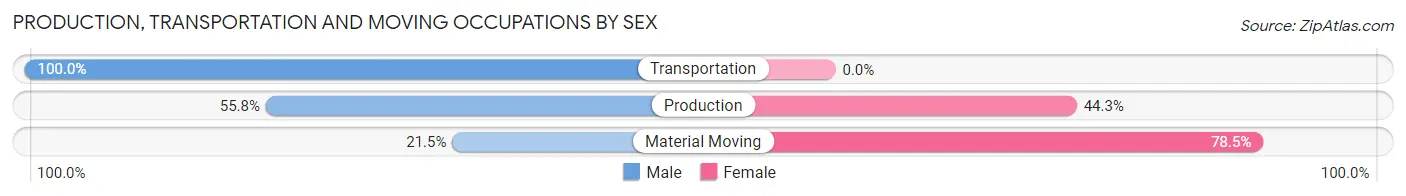
Production, Transportation and Moving Occupations
The most common Production, Transportation and Moving occupations in Wetumpka are Production (174 | 6.0%), Material Moving (144 | 5.0%), and Transportation (72 | 2.5%).
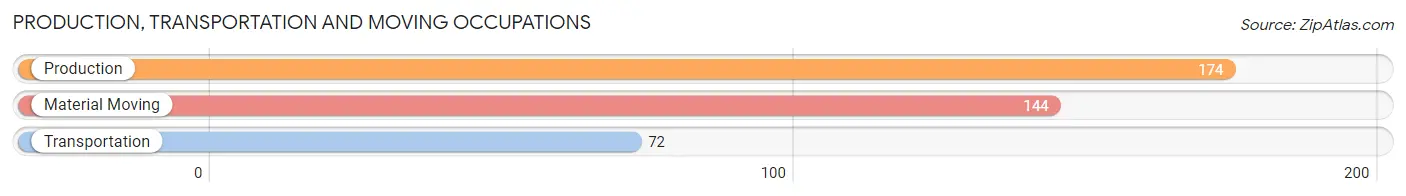
Production, Transportation and Moving Occupations by Sex
| Occupation | Male | Female |
| Production | 97 (55.7%) | 77 (44.3%) |
| Transportation | 72 (100.0%) | 0 (0.0%) |
| Material Moving | 31 (21.5%) | 113 (78.5%) |
| Total (Category) | 200 (51.3%) | 190 (48.7%) |
| Total (Overall) | 1,331 (46.1%) | 1,554 (53.9%) |
Employment Industries by Sex in Wetumpka
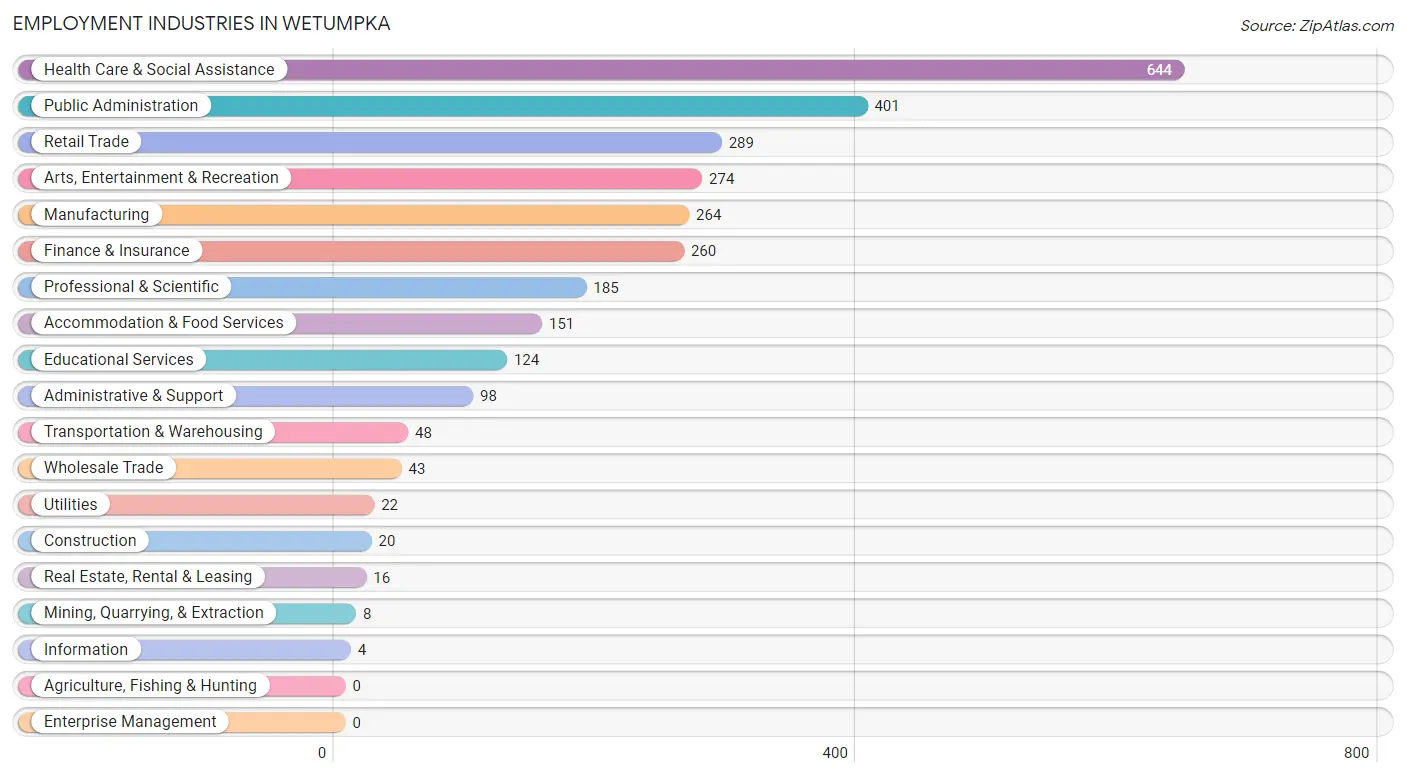
Employment Industries in Wetumpka
The major employment industries in Wetumpka include Health Care & Social Assistance (644 | 22.3%), Public Administration (401 | 13.9%), Retail Trade (289 | 10.0%), Arts, Entertainment & Recreation (274 | 9.5%), and Manufacturing (264 | 9.1%).
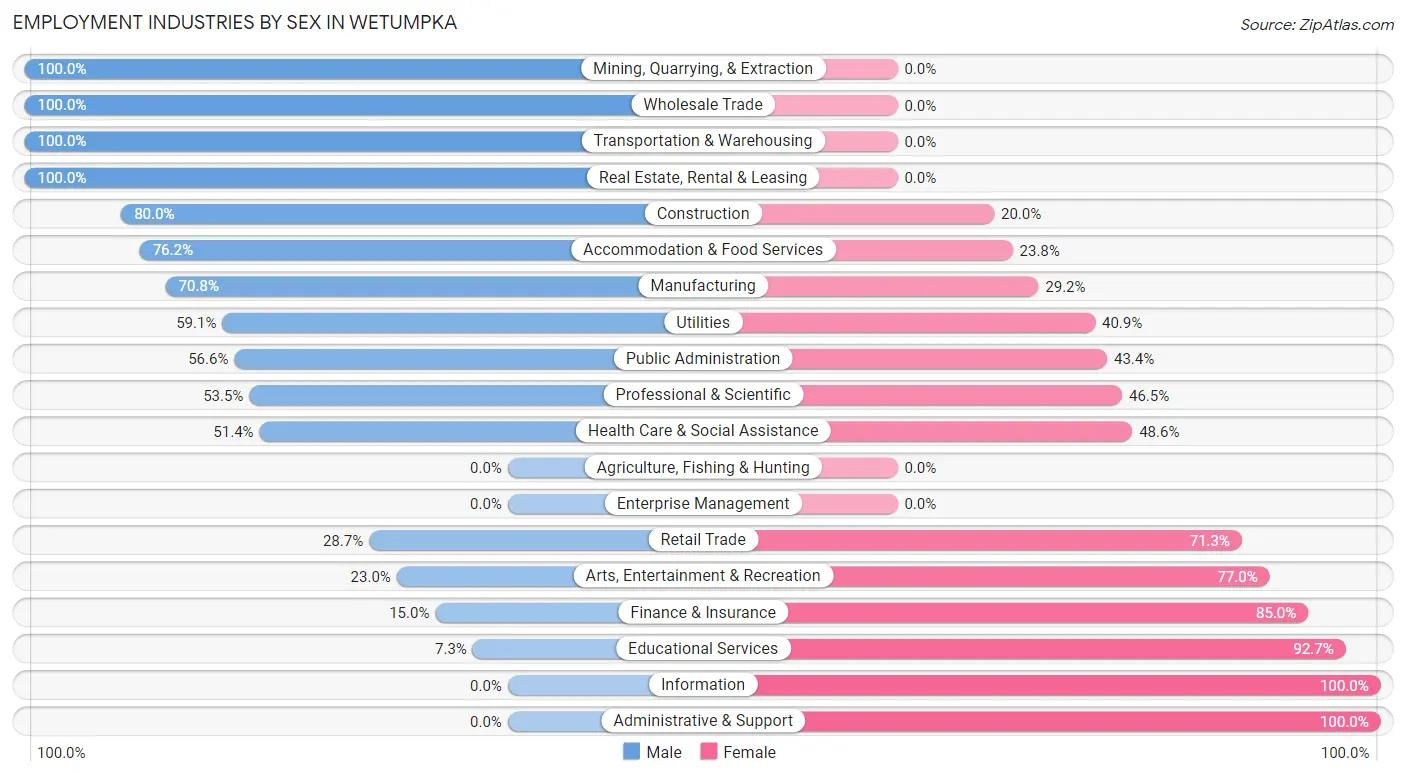
Employment Industries by Sex in Wetumpka
The Wetumpka industries that see more men than women are Mining, Quarrying, & Extraction (100.0%), Wholesale Trade (100.0%), and Transportation & Warehousing (100.0%), whereas the industries that tend to have a higher number of women are Information (100.0%), Administrative & Support (100.0%), and Educational Services (92.7%).
| Industry | Male | Female |
| Agriculture, Fishing & Hunting | 0 (0.0%) | 0 (0.0%) |
| Mining, Quarrying, & Extraction | 8 (100.0%) | 0 (0.0%) |
| Construction | 16 (80.0%) | 4 (20.0%) |
| Manufacturing | 187 (70.8%) | 77 (29.2%) |
| Wholesale Trade | 43 (100.0%) | 0 (0.0%) |
| Retail Trade | 83 (28.7%) | 206 (71.3%) |
| Transportation & Warehousing | 48 (100.0%) | 0 (0.0%) |
| Utilities | 13 (59.1%) | 9 (40.9%) |
| Information | 0 (0.0%) | 4 (100.0%) |
| Finance & Insurance | 39 (15.0%) | 221 (85.0%) |
| Real Estate, Rental & Leasing | 16 (100.0%) | 0 (0.0%) |
| Professional & Scientific | 99 (53.5%) | 86 (46.5%) |
| Enterprise Management | 0 (0.0%) | 0 (0.0%) |
| Administrative & Support | 0 (0.0%) | 98 (100.0%) |
| Educational Services | 9 (7.3%) | 115 (92.7%) |
| Health Care & Social Assistance | 331 (51.4%) | 313 (48.6%) |
| Arts, Entertainment & Recreation | 63 (23.0%) | 211 (77.0%) |
| Accommodation & Food Services | 115 (76.2%) | 36 (23.8%) |
| Public Administration | 227 (56.6%) | 174 (43.4%) |
| Total | 1,331 (46.1%) | 1,554 (53.9%) |
Education in Wetumpka
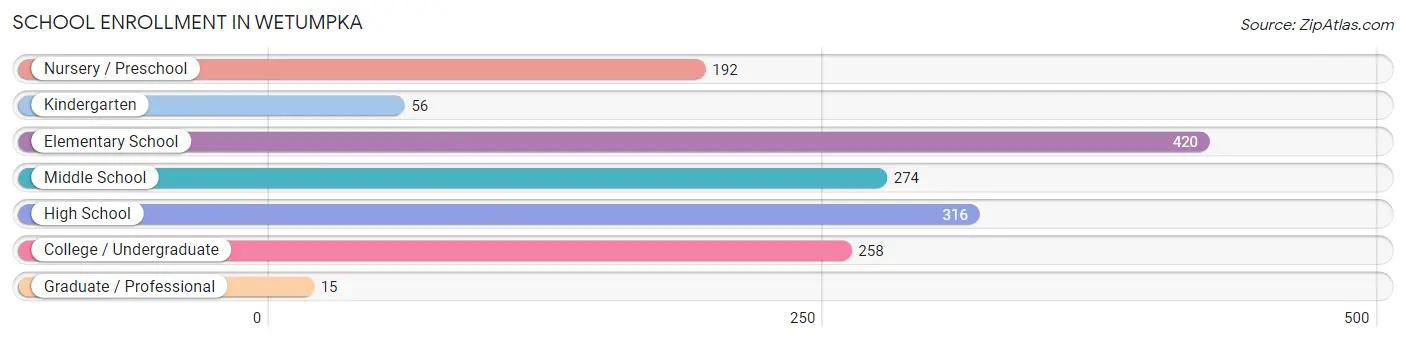
School Enrollment in Wetumpka
The most common levels of schooling among the 1,531 students in Wetumpka are elementary school (420 | 27.4%), high school (316 | 20.6%), and middle school (274 | 17.9%).
| School Level | # Students | % Students |
| Nursery / Preschool | 192 | 12.5% |
| Kindergarten | 56 | 3.7% |
| Elementary School | 420 | 27.4% |
| Middle School | 274 | 17.9% |
| High School | 316 | 20.6% |
| College / Undergraduate | 258 | 16.9% |
| Graduate / Professional | 15 | 1.0% |
| Total | 1,531 | 100.0% |
School Enrollment by Age by Funding Source in Wetumpka
Out of a total of 1,531 students who are enrolled in schools in Wetumpka, 204 (13.3%) attend a private institution, while the remaining 1,327 (86.7%) are enrolled in public schools. The age group of 3 to 4 year olds has the highest likelihood of being enrolled in private schools, with 114 (80.8% in the age bracket) enrolled. Conversely, the age group of 10 to 14 year olds has the lowest likelihood of being enrolled in a private school, with 302 (100.0% in the age bracket) attending a public institution.
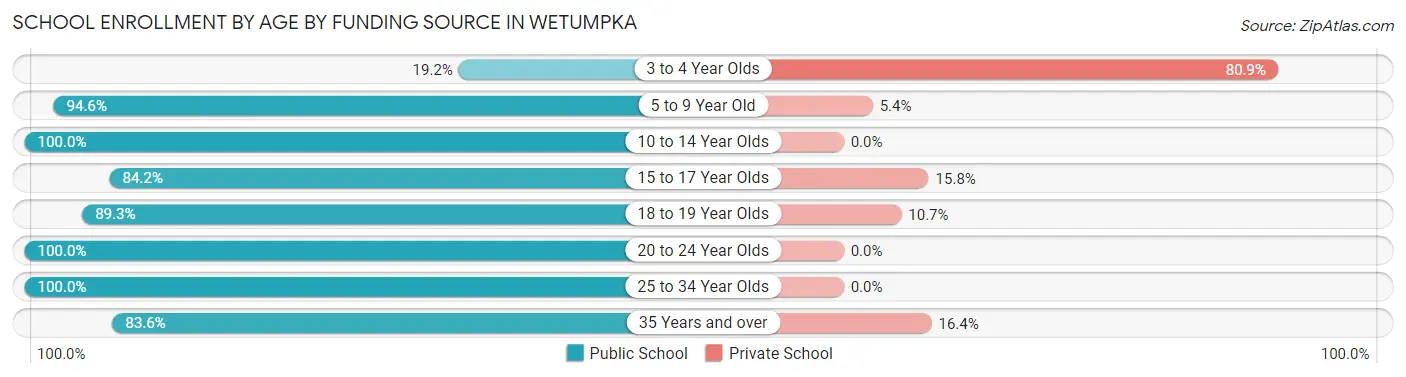
| Age Bracket | Public School | Private School |
| 3 to 4 Year Olds | 27 (19.2%) | 114 (80.8%) |
| 5 to 9 Year Old | 472 (94.6%) | 27 (5.4%) |
| 10 to 14 Year Olds | 302 (100.0%) | 0 (0.0%) |
| 15 to 17 Year Olds | 202 (84.2%) | 38 (15.8%) |
| 18 to 19 Year Olds | 133 (89.3%) | 16 (10.7%) |
| 20 to 24 Year Olds | 13 (100.0%) | 0 (0.0%) |
| 25 to 34 Year Olds | 132 (100.0%) | 0 (0.0%) |
| 35 Years and over | 46 (83.6%) | 9 (16.4%) |
| Total | 1,327 (86.7%) | 204 (13.3%) |
Educational Attainment by Field of Study in Wetumpka
Business (264 | 23.8%), bio, nature & agricultural (160 | 14.4%), science & technology (107 | 9.7%), education (101 | 9.1%), and communications (91 | 8.2%) are the most common fields of study among 1,109 individuals in Wetumpka who have obtained a bachelor's degree or higher.
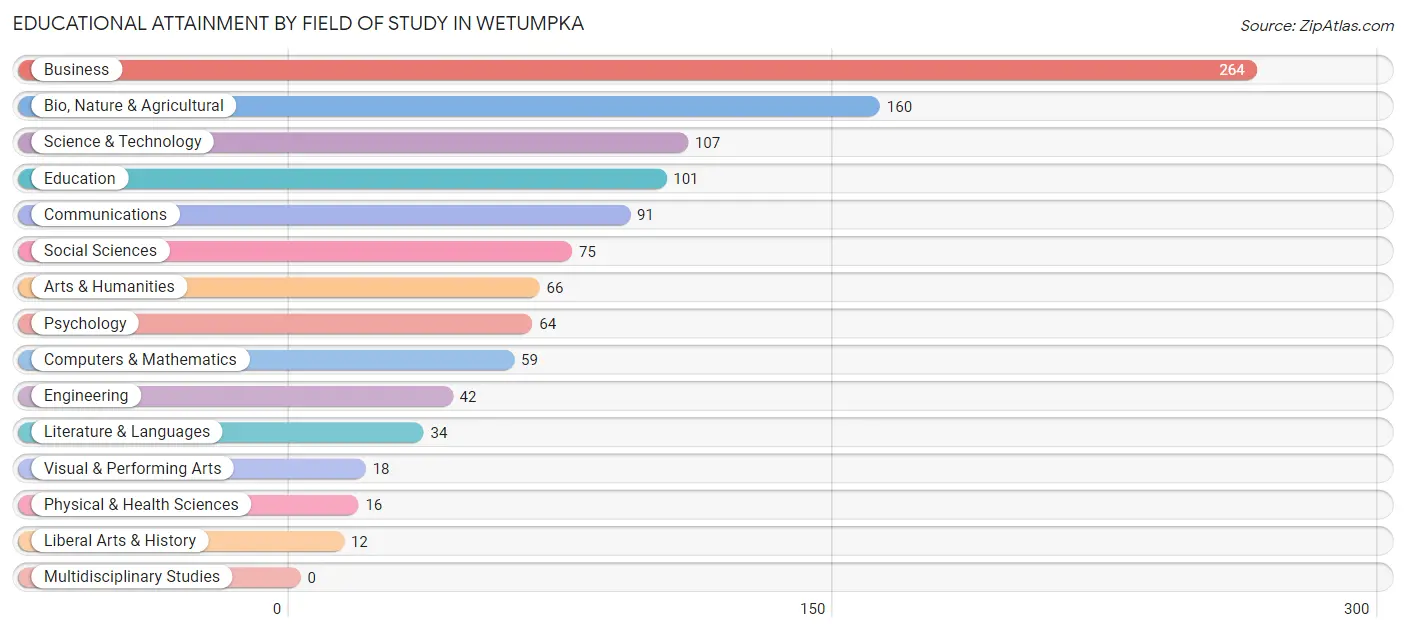
| Field of Study | # Graduates | % Graduates |
| Computers & Mathematics | 59 | 5.3% |
| Bio, Nature & Agricultural | 160 | 14.4% |
| Physical & Health Sciences | 16 | 1.4% |
| Psychology | 64 | 5.8% |
| Social Sciences | 75 | 6.8% |
| Engineering | 42 | 3.8% |
| Multidisciplinary Studies | 0 | 0.0% |
| Science & Technology | 107 | 9.7% |
| Business | 264 | 23.8% |
| Education | 101 | 9.1% |
| Literature & Languages | 34 | 3.1% |
| Liberal Arts & History | 12 | 1.1% |
| Visual & Performing Arts | 18 | 1.6% |
| Communications | 91 | 8.2% |
| Arts & Humanities | 66 | 5.9% |
| Total | 1,109 | 100.0% |
Transportation & Commute in Wetumpka
Vehicle Availability by Sex in Wetumpka
The most prevalent vehicle ownership categories in Wetumpka are males with 2 vehicles (675, accounting for 51.4%) and females with 2 vehicles (569, making up 46.3%).
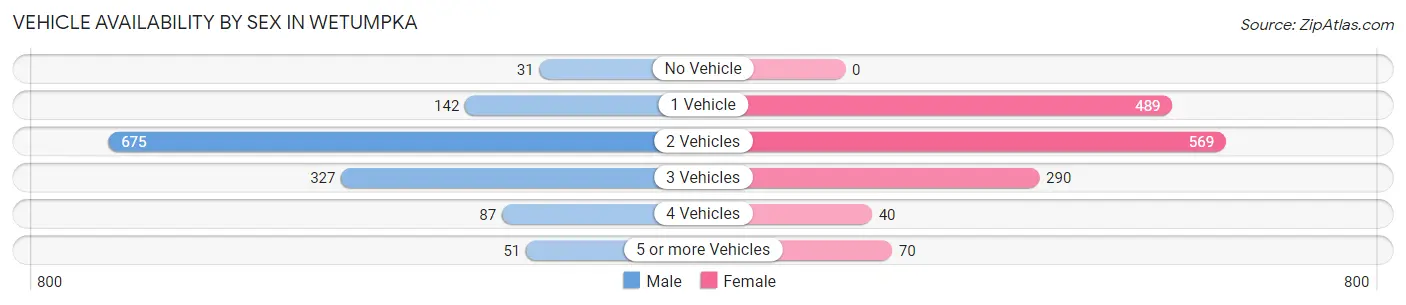
| Vehicles Available | Male | Female |
| No Vehicle | 31 (2.4%) | 0 (0.0%) |
| 1 Vehicle | 142 (10.8%) | 489 (33.5%) |
| 2 Vehicles | 675 (51.4%) | 569 (39.0%) |
| 3 Vehicles | 327 (24.9%) | 290 (19.9%) |
| 4 Vehicles | 87 (6.6%) | 40 (2.7%) |
| 5 or more Vehicles | 51 (3.9%) | 70 (4.8%) |
| Total | 1,313 (100.0%) | 1,458 (100.0%) |
Commute Time in Wetumpka
The most frequently occuring commute durations in Wetumpka are 30 to 34 minutes (778 commuters, 30.2%), 5 to 9 minutes (345 commuters, 13.4%), and 15 to 19 minutes (302 commuters, 11.7%).
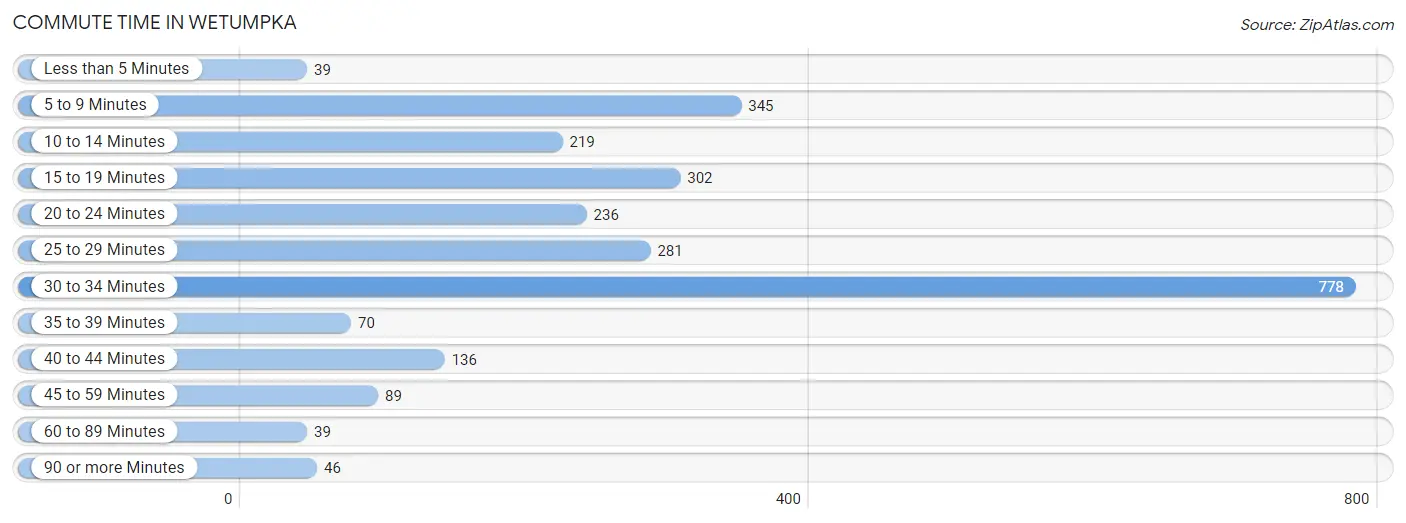
| Commute Time | # Commuters | % Commuters |
| Less than 5 Minutes | 39 | 1.5% |
| 5 to 9 Minutes | 345 | 13.4% |
| 10 to 14 Minutes | 219 | 8.5% |
| 15 to 19 Minutes | 302 | 11.7% |
| 20 to 24 Minutes | 236 | 9.1% |
| 25 to 29 Minutes | 281 | 10.9% |
| 30 to 34 Minutes | 778 | 30.2% |
| 35 to 39 Minutes | 70 | 2.7% |
| 40 to 44 Minutes | 136 | 5.3% |
| 45 to 59 Minutes | 89 | 3.5% |
| 60 to 89 Minutes | 39 | 1.5% |
| 90 or more Minutes | 46 | 1.8% |
Commute Time by Sex in Wetumpka
The most common commute times in Wetumpka are 30 to 34 minutes (450 commuters, 36.2%) for males and 30 to 34 minutes (328 commuters, 24.5%) for females.
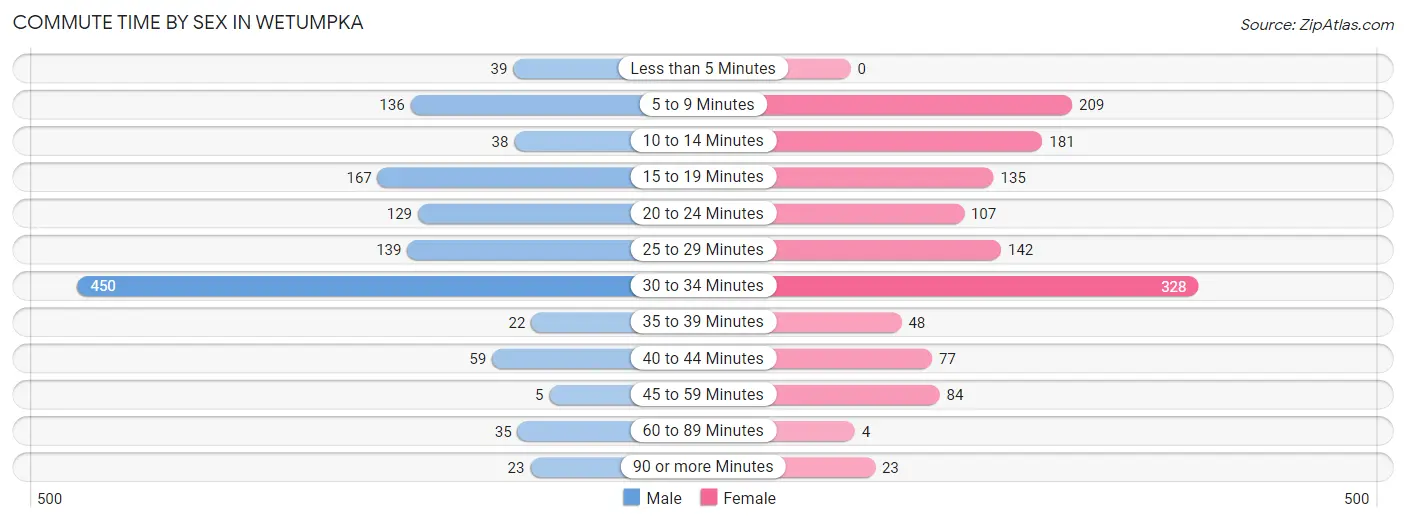
| Commute Time | Male | Female |
| Less than 5 Minutes | 39 (3.1%) | 0 (0.0%) |
| 5 to 9 Minutes | 136 (11.0%) | 209 (15.6%) |
| 10 to 14 Minutes | 38 (3.1%) | 181 (13.5%) |
| 15 to 19 Minutes | 167 (13.5%) | 135 (10.1%) |
| 20 to 24 Minutes | 129 (10.4%) | 107 (8.0%) |
| 25 to 29 Minutes | 139 (11.2%) | 142 (10.6%) |
| 30 to 34 Minutes | 450 (36.2%) | 328 (24.5%) |
| 35 to 39 Minutes | 22 (1.8%) | 48 (3.6%) |
| 40 to 44 Minutes | 59 (4.8%) | 77 (5.8%) |
| 45 to 59 Minutes | 5 (0.4%) | 84 (6.3%) |
| 60 to 89 Minutes | 35 (2.8%) | 4 (0.3%) |
| 90 or more Minutes | 23 (1.8%) | 23 (1.7%) |
Time of Departure to Work by Sex in Wetumpka
The most frequent times of departure to work in Wetumpka are 7:00 AM to 7:29 AM (436, 35.1%) for males and 7:00 AM to 7:29 AM (431, 32.2%) for females.
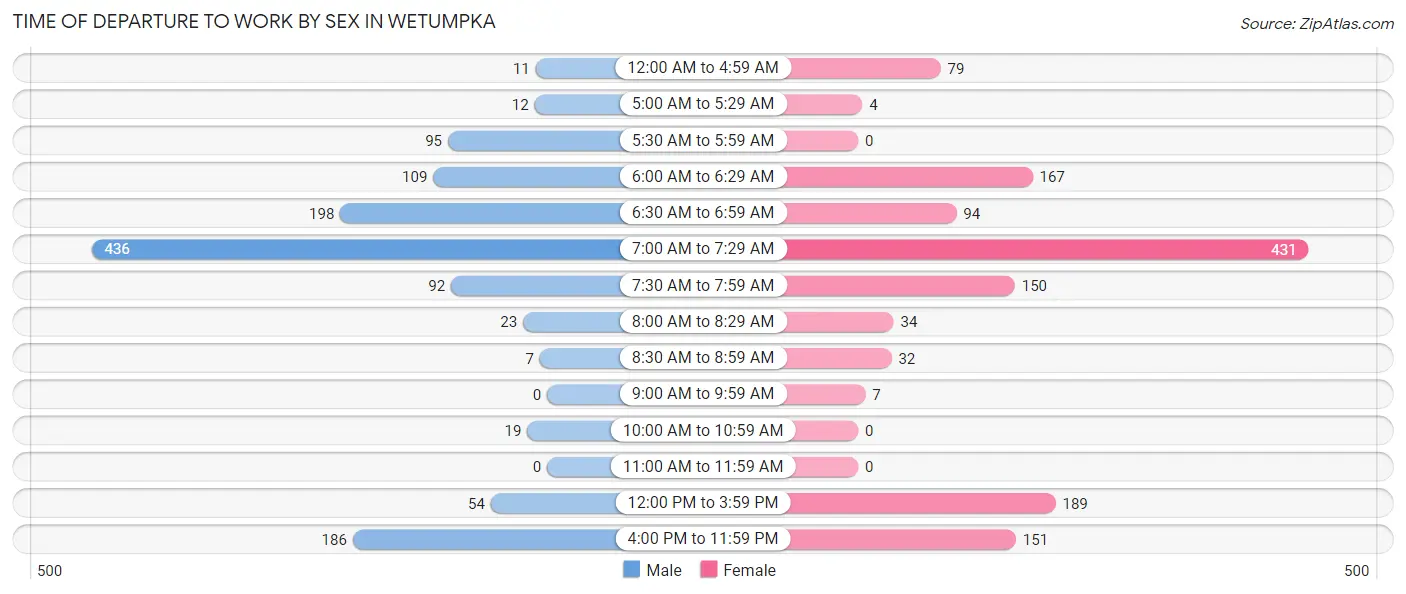
| Time of Departure | Male | Female |
| 12:00 AM to 4:59 AM | 11 (0.9%) | 79 (5.9%) |
| 5:00 AM to 5:29 AM | 12 (1.0%) | 4 (0.3%) |
| 5:30 AM to 5:59 AM | 95 (7.6%) | 0 (0.0%) |
| 6:00 AM to 6:29 AM | 109 (8.8%) | 167 (12.5%) |
| 6:30 AM to 6:59 AM | 198 (15.9%) | 94 (7.0%) |
| 7:00 AM to 7:29 AM | 436 (35.1%) | 431 (32.2%) |
| 7:30 AM to 7:59 AM | 92 (7.4%) | 150 (11.2%) |
| 8:00 AM to 8:29 AM | 23 (1.8%) | 34 (2.5%) |
| 8:30 AM to 8:59 AM | 7 (0.6%) | 32 (2.4%) |
| 9:00 AM to 9:59 AM | 0 (0.0%) | 7 (0.5%) |
| 10:00 AM to 10:59 AM | 19 (1.5%) | 0 (0.0%) |
| 11:00 AM to 11:59 AM | 0 (0.0%) | 0 (0.0%) |
| 12:00 PM to 3:59 PM | 54 (4.3%) | 189 (14.1%) |
| 4:00 PM to 11:59 PM | 186 (15.0%) | 151 (11.3%) |
| Total | 1,242 (100.0%) | 1,338 (100.0%) |
Housing Occupancy in Wetumpka
Occupancy by Ownership in Wetumpka
Of the total 2,402 dwellings in Wetumpka, owner-occupied units account for 1,514 (63.0%), while renter-occupied units make up 888 (37.0%).
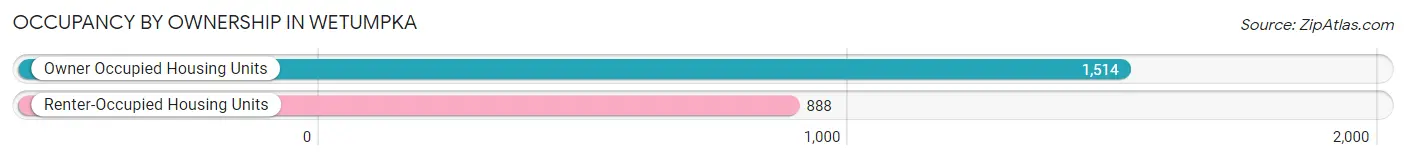
| Occupancy | # Housing Units | % Housing Units |
| Owner Occupied Housing Units | 1,514 | 63.0% |
| Renter-Occupied Housing Units | 888 | 37.0% |
| Total Occupied Housing Units | 2,402 | 100.0% |
Occupancy by Household Size in Wetumpka
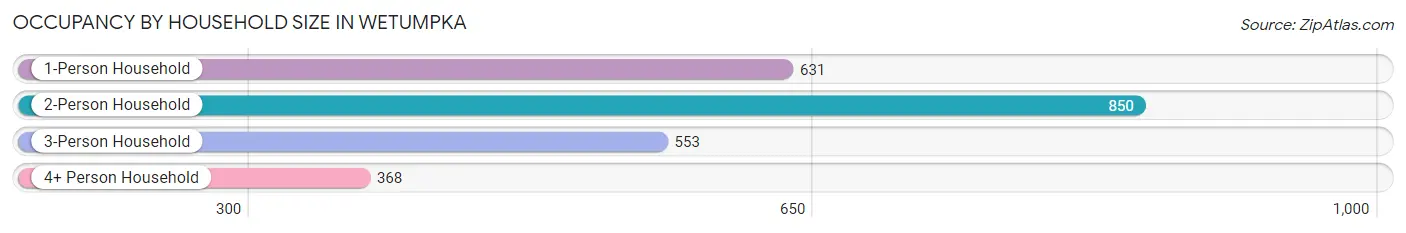
| Household Size | # Housing Units | % Housing Units |
| 1-Person Household | 631 | 26.3% |
| 2-Person Household | 850 | 35.4% |
| 3-Person Household | 553 | 23.0% |
| 4+ Person Household | 368 | 15.3% |
| Total Housing Units | 2,402 | 100.0% |
Occupancy by Ownership by Household Size in Wetumpka
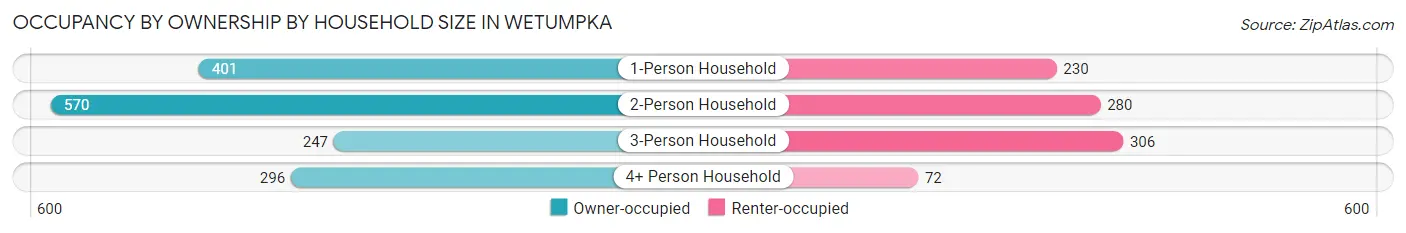
| Household Size | Owner-occupied | Renter-occupied |
| 1-Person Household | 401 (63.5%) | 230 (36.4%) |
| 2-Person Household | 570 (67.1%) | 280 (32.9%) |
| 3-Person Household | 247 (44.7%) | 306 (55.3%) |
| 4+ Person Household | 296 (80.4%) | 72 (19.6%) |
| Total Housing Units | 1,514 (63.0%) | 888 (37.0%) |
Occupancy by Educational Attainment in Wetumpka
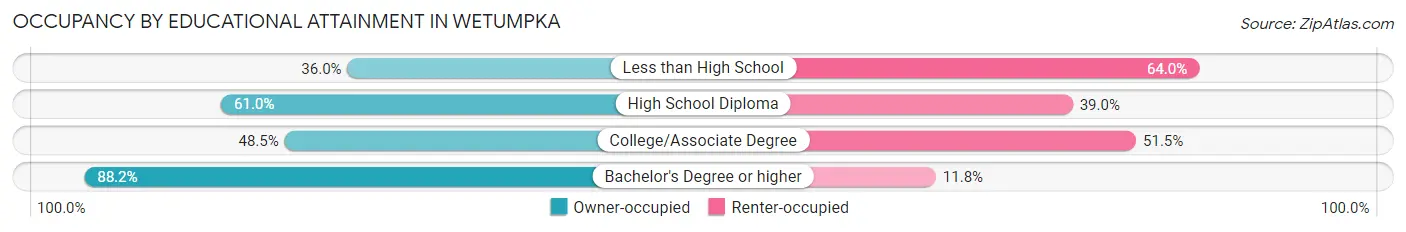
| Household Size | Owner-occupied | Renter-occupied |
| Less than High School | 63 (36.0%) | 112 (64.0%) |
| High School Diploma | 487 (61.0%) | 311 (39.0%) |
| College/Associate Degree | 361 (48.5%) | 384 (51.5%) |
| Bachelor's Degree or higher | 603 (88.2%) | 81 (11.8%) |
Occupancy by Age of Householder in Wetumpka
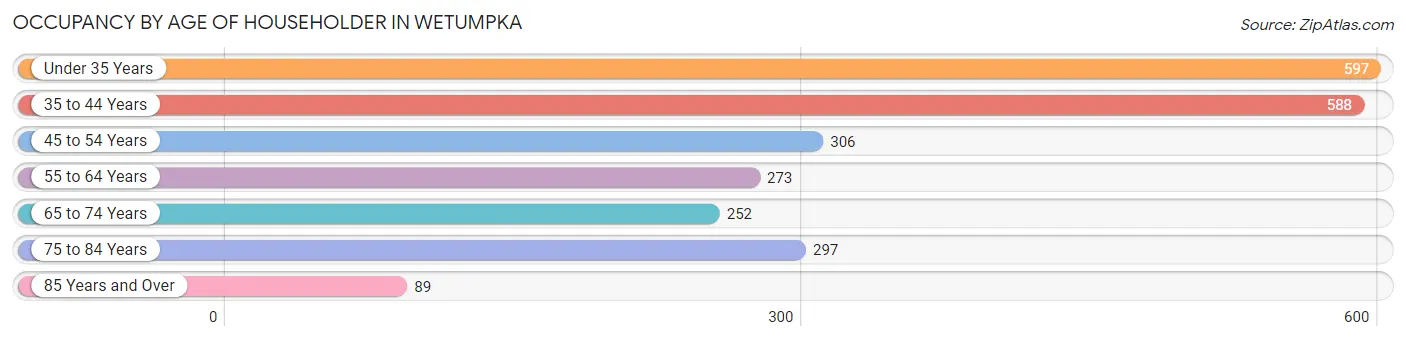
| Age Bracket | # Households | % Households |
| Under 35 Years | 597 | 24.8% |
| 35 to 44 Years | 588 | 24.5% |
| 45 to 54 Years | 306 | 12.7% |
| 55 to 64 Years | 273 | 11.4% |
| 65 to 74 Years | 252 | 10.5% |
| 75 to 84 Years | 297 | 12.4% |
| 85 Years and Over | 89 | 3.7% |
| Total | 2,402 | 100.0% |
Housing Finances in Wetumpka
Median Income by Occupancy in Wetumpka
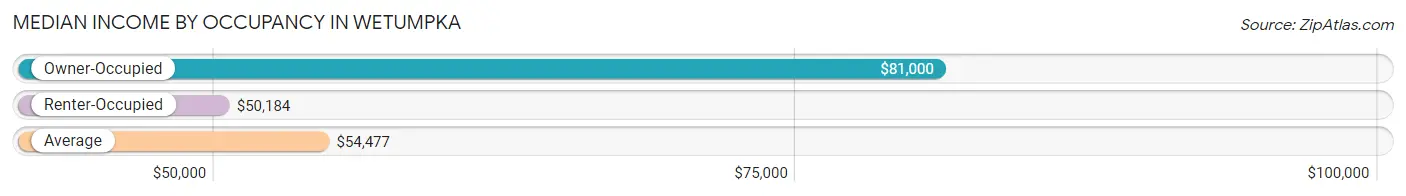
| Occupancy Type | # Households | Median Income |
| Owner-Occupied | 1,514 (63.0%) | $81,000 |
| Renter-Occupied | 888 (37.0%) | $50,184 |
| Average | 2,402 (100.0%) | $54,477 |
Occupancy by Householder Income Bracket in Wetumpka
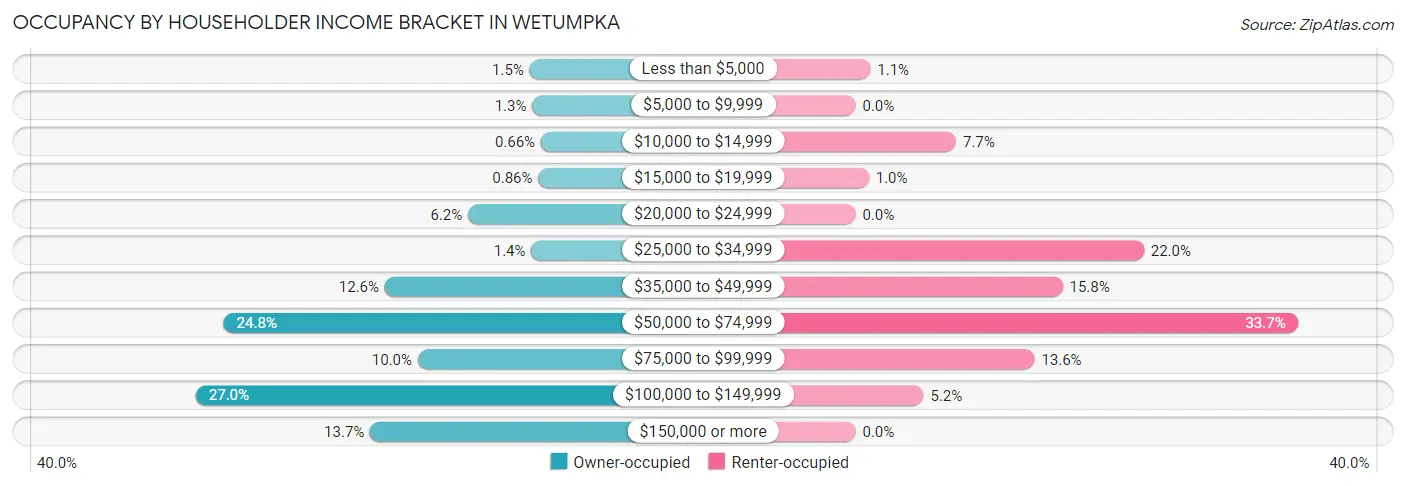
| Income Bracket | Owner-occupied | Renter-occupied |
| Less than $5,000 | 23 (1.5%) | 10 (1.1%) |
| $5,000 to $9,999 | 20 (1.3%) | 0 (0.0%) |
| $10,000 to $14,999 | 10 (0.7%) | 68 (7.7%) |
| $15,000 to $19,999 | 13 (0.9%) | 9 (1.0%) |
| $20,000 to $24,999 | 94 (6.2%) | 0 (0.0%) |
| $25,000 to $34,999 | 21 (1.4%) | 195 (22.0%) |
| $35,000 to $49,999 | 190 (12.6%) | 140 (15.8%) |
| $50,000 to $74,999 | 376 (24.8%) | 299 (33.7%) |
| $75,000 to $99,999 | 152 (10.0%) | 121 (13.6%) |
| $100,000 to $149,999 | 408 (27.0%) | 46 (5.2%) |
| $150,000 or more | 207 (13.7%) | 0 (0.0%) |
| Total | 1,514 (100.0%) | 888 (100.0%) |
Monthly Housing Cost Tiers in Wetumpka
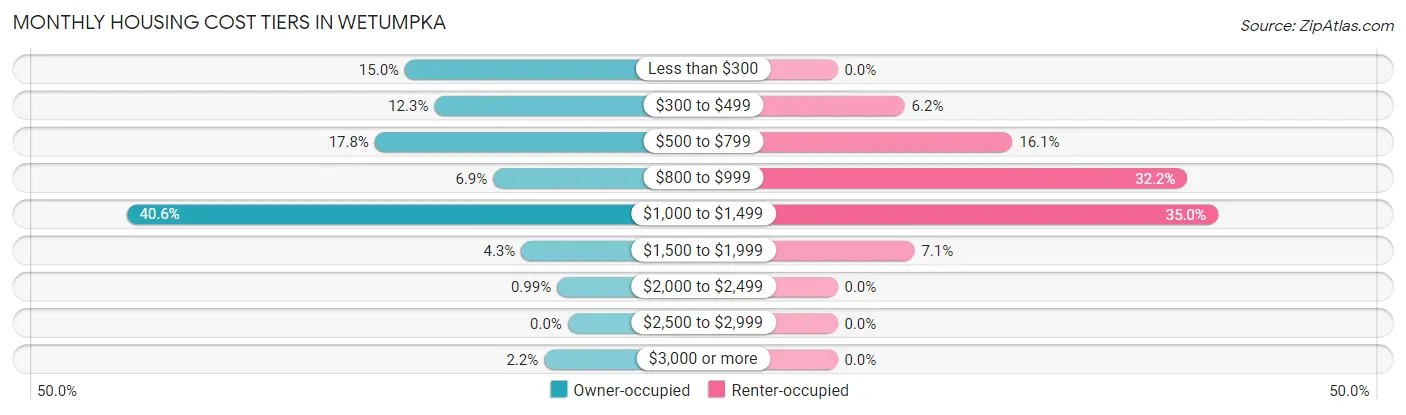
| Monthly Cost | Owner-occupied | Renter-occupied |
| Less than $300 | 227 (15.0%) | 0 (0.0%) |
| $300 to $499 | 186 (12.3%) | 55 (6.2%) |
| $500 to $799 | 269 (17.8%) | 143 (16.1%) |
| $800 to $999 | 104 (6.9%) | 286 (32.2%) |
| $1,000 to $1,499 | 615 (40.6%) | 311 (35.0%) |
| $1,500 to $1,999 | 65 (4.3%) | 63 (7.1%) |
| $2,000 to $2,499 | 15 (1.0%) | 0 (0.0%) |
| $2,500 to $2,999 | 0 (0.0%) | 0 (0.0%) |
| $3,000 or more | 33 (2.2%) | 0 (0.0%) |
| Total | 1,514 (100.0%) | 888 (100.0%) |
Physical Housing Characteristics in Wetumpka
Housing Structures in Wetumpka
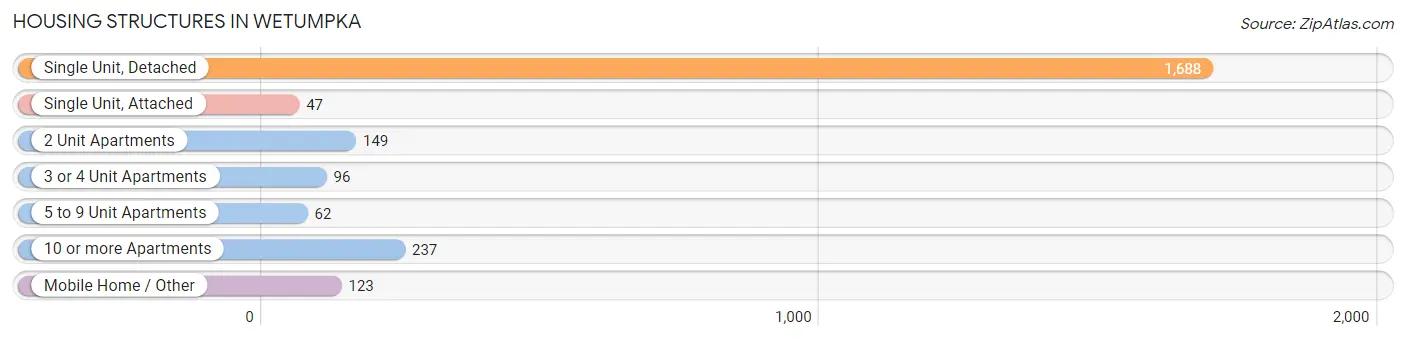
| Structure Type | # Housing Units | % Housing Units |
| Single Unit, Detached | 1,688 | 70.3% |
| Single Unit, Attached | 47 | 2.0% |
| 2 Unit Apartments | 149 | 6.2% |
| 3 or 4 Unit Apartments | 96 | 4.0% |
| 5 to 9 Unit Apartments | 62 | 2.6% |
| 10 or more Apartments | 237 | 9.9% |
| Mobile Home / Other | 123 | 5.1% |
| Total | 2,402 | 100.0% |
Housing Structures by Occupancy in Wetumpka
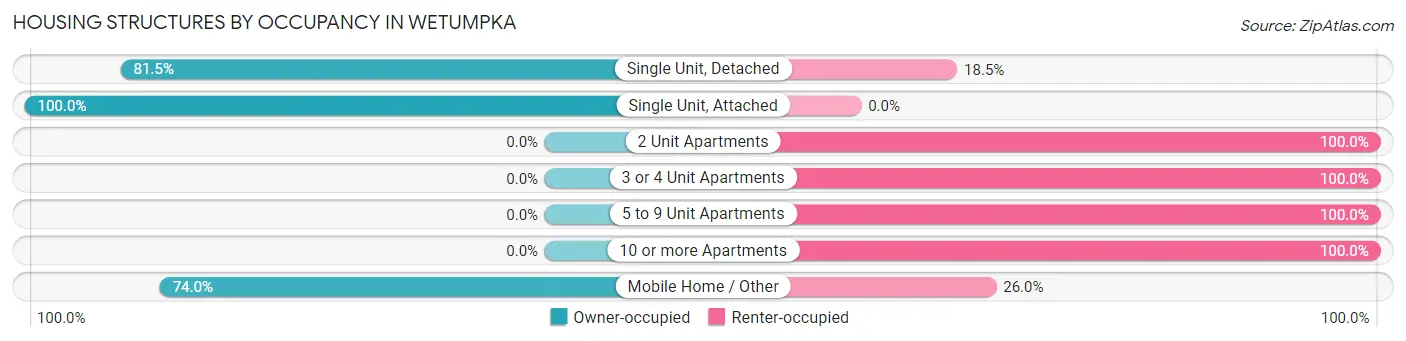
| Structure Type | Owner-occupied | Renter-occupied |
| Single Unit, Detached | 1,376 (81.5%) | 312 (18.5%) |
| Single Unit, Attached | 47 (100.0%) | 0 (0.0%) |
| 2 Unit Apartments | 0 (0.0%) | 149 (100.0%) |
| 3 or 4 Unit Apartments | 0 (0.0%) | 96 (100.0%) |
| 5 to 9 Unit Apartments | 0 (0.0%) | 62 (100.0%) |
| 10 or more Apartments | 0 (0.0%) | 237 (100.0%) |
| Mobile Home / Other | 91 (74.0%) | 32 (26.0%) |
| Total | 1,514 (63.0%) | 888 (37.0%) |
Housing Structures by Number of Rooms in Wetumpka
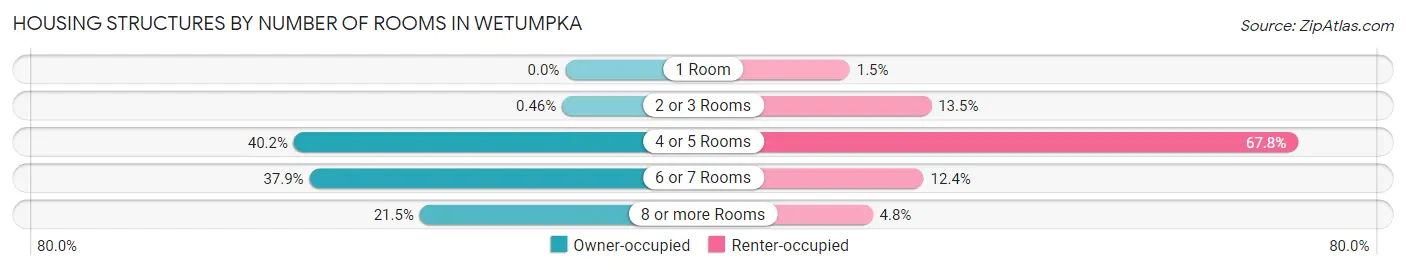
| Number of Rooms | Owner-occupied | Renter-occupied |
| 1 Room | 0 (0.0%) | 13 (1.5%) |
| 2 or 3 Rooms | 7 (0.5%) | 120 (13.5%) |
| 4 or 5 Rooms | 608 (40.2%) | 602 (67.8%) |
| 6 or 7 Rooms | 573 (37.9%) | 110 (12.4%) |
| 8 or more Rooms | 326 (21.5%) | 43 (4.8%) |
| Total | 1,514 (100.0%) | 888 (100.0%) |
Housing Structure by Heating Type in Wetumpka
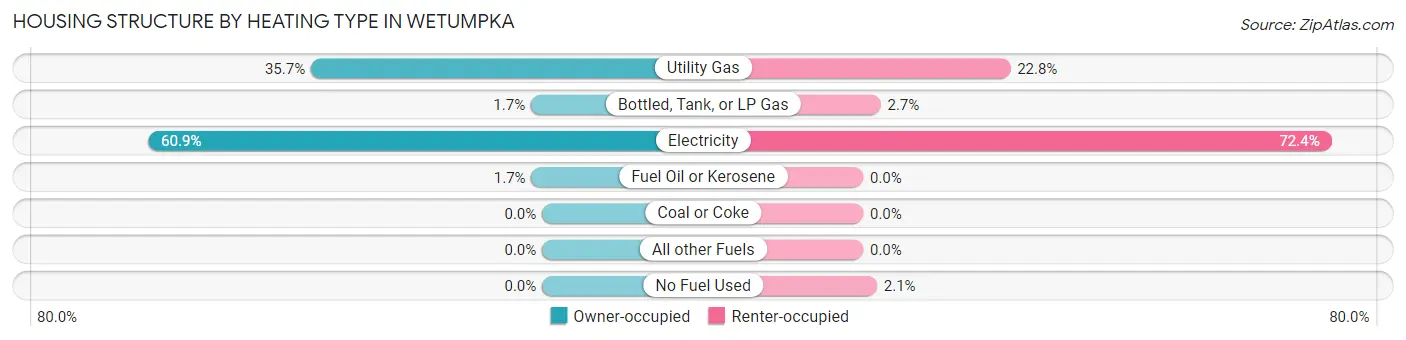
| Heating Type | Owner-occupied | Renter-occupied |
| Utility Gas | 541 (35.7%) | 202 (22.8%) |
| Bottled, Tank, or LP Gas | 26 (1.7%) | 24 (2.7%) |
| Electricity | 922 (60.9%) | 643 (72.4%) |
| Fuel Oil or Kerosene | 25 (1.7%) | 0 (0.0%) |
| Coal or Coke | 0 (0.0%) | 0 (0.0%) |
| All other Fuels | 0 (0.0%) | 0 (0.0%) |
| No Fuel Used | 0 (0.0%) | 19 (2.1%) |
| Total | 1,514 (100.0%) | 888 (100.0%) |
Household Vehicle Usage in Wetumpka
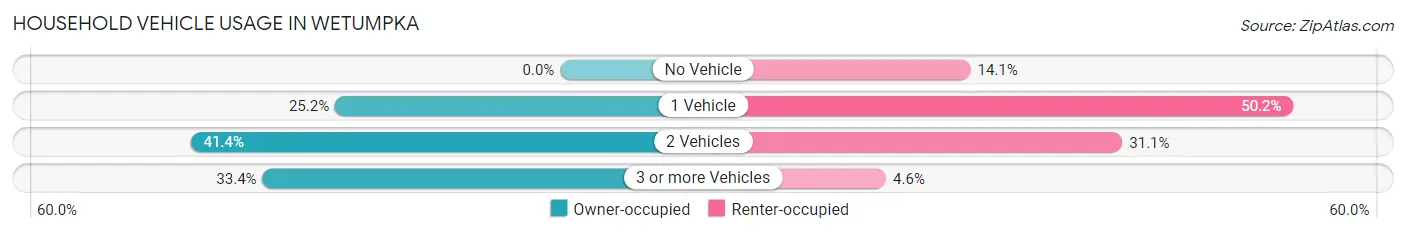
| Vehicles per Household | Owner-occupied | Renter-occupied |
| No Vehicle | 0 (0.0%) | 125 (14.1%) |
| 1 Vehicle | 382 (25.2%) | 446 (50.2%) |
| 2 Vehicles | 627 (41.4%) | 276 (31.1%) |
| 3 or more Vehicles | 505 (33.4%) | 41 (4.6%) |
| Total | 1,514 (100.0%) | 888 (100.0%) |
Real Estate & Mortgages in Wetumpka
Real Estate and Mortgage Overview in Wetumpka
| Characteristic | Without Mortgage | With Mortgage |
| Housing Units | 540 | 974 |
| Median Property Value | $174,800 | $169,400 |
| Median Household Income | $55,789 | $168 |
| Monthly Housing Costs | $335 | $33 |
| Real Estate Taxes | $495 | $147 |
Property Value by Mortgage Status in Wetumpka
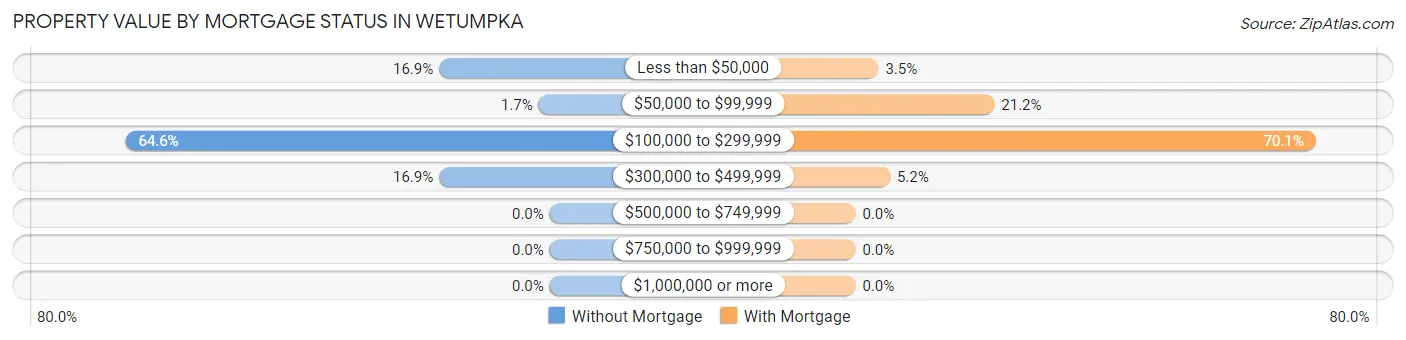
| Property Value | Without Mortgage | With Mortgage |
| Less than $50,000 | 91 (16.9%) | 34 (3.5%) |
| $50,000 to $99,999 | 9 (1.7%) | 206 (21.1%) |
| $100,000 to $299,999 | 349 (64.6%) | 683 (70.1%) |
| $300,000 to $499,999 | 91 (16.9%) | 51 (5.2%) |
| $500,000 to $749,999 | 0 (0.0%) | 0 (0.0%) |
| $750,000 to $999,999 | 0 (0.0%) | 0 (0.0%) |
| $1,000,000 or more | 0 (0.0%) | 0 (0.0%) |
| Total | 540 (100.0%) | 974 (100.0%) |
Household Income by Mortgage Status in Wetumpka
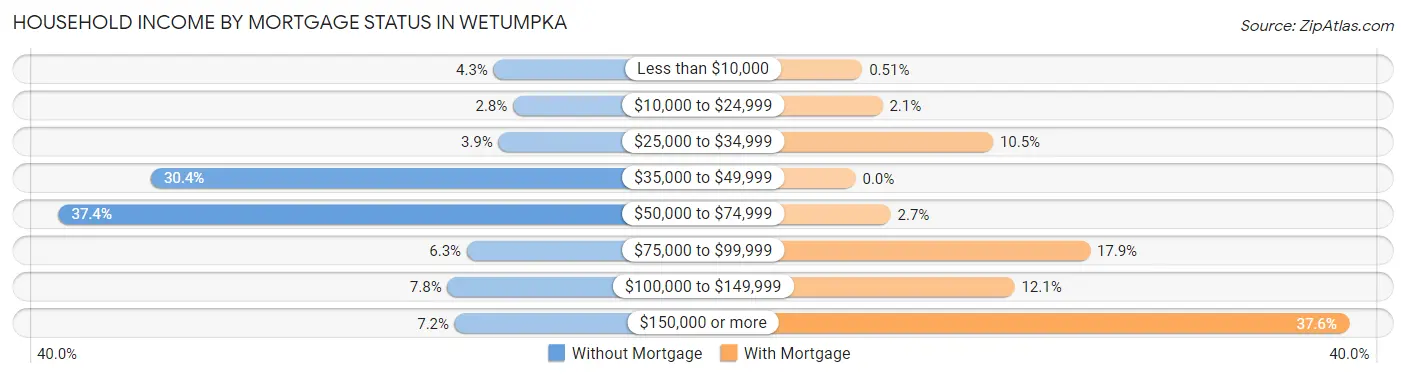
| Household Income | Without Mortgage | With Mortgage |
| Less than $10,000 | 23 (4.3%) | 5 (0.5%) |
| $10,000 to $24,999 | 15 (2.8%) | 20 (2.1%) |
| $25,000 to $34,999 | 21 (3.9%) | 102 (10.5%) |
| $35,000 to $49,999 | 164 (30.4%) | 0 (0.0%) |
| $50,000 to $74,999 | 202 (37.4%) | 26 (2.7%) |
| $75,000 to $99,999 | 34 (6.3%) | 174 (17.9%) |
| $100,000 to $149,999 | 42 (7.8%) | 118 (12.1%) |
| $150,000 or more | 39 (7.2%) | 366 (37.6%) |
| Total | 540 (100.0%) | 974 (100.0%) |
Property Value to Household Income Ratio in Wetumpka
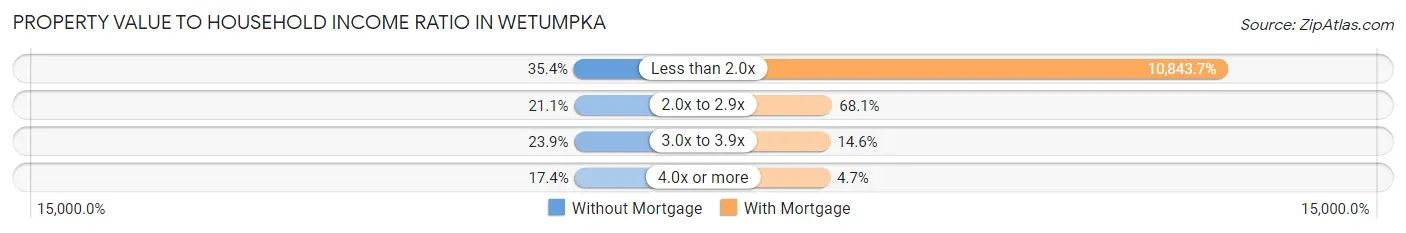
| Value-to-Income Ratio | Without Mortgage | With Mortgage |
| Less than 2.0x | 191 (35.4%) | 105,618 (10,843.7%) |
| 2.0x to 2.9x | 114 (21.1%) | 663 (68.1%) |
| 3.0x to 3.9x | 129 (23.9%) | 142 (14.6%) |
| 4.0x or more | 94 (17.4%) | 46 (4.7%) |
| Total | 540 (100.0%) | 974 (100.0%) |
Real Estate Taxes by Mortgage Status in Wetumpka
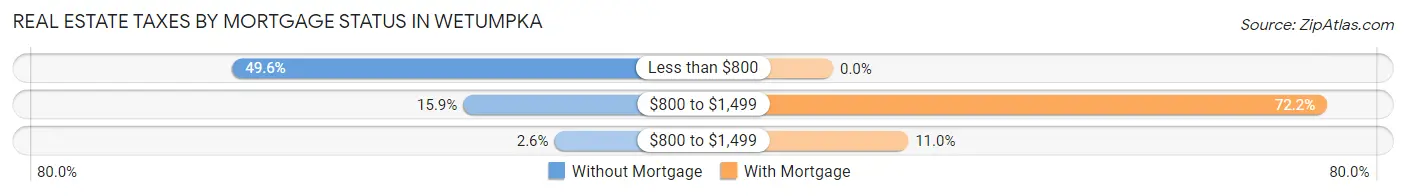
| Property Taxes | Without Mortgage | With Mortgage |
| Less than $800 | 268 (49.6%) | 0 (0.0%) |
| $800 to $1,499 | 86 (15.9%) | 703 (72.2%) |
| $800 to $1,499 | 14 (2.6%) | 107 (11.0%) |
| Total | 540 (100.0%) | 974 (100.0%) |
Health & Disability in Wetumpka
Health Insurance Coverage by Age in Wetumpka
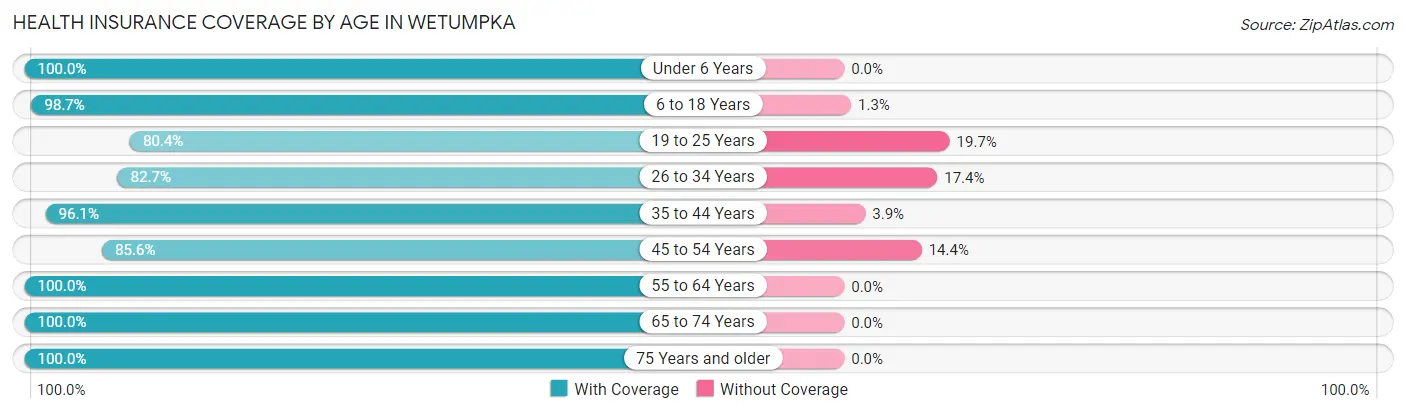
| Age Bracket | With Coverage | Without Coverage |
| Under 6 Years | 583 (100.0%) | 0 (0.0%) |
| 6 to 18 Years | 1,164 (98.7%) | 15 (1.3%) |
| 19 to 25 Years | 364 (80.3%) | 89 (19.7%) |
| 26 to 34 Years | 986 (82.7%) | 207 (17.3%) |
| 35 to 44 Years | 834 (96.1%) | 34 (3.9%) |
| 45 to 54 Years | 462 (85.6%) | 78 (14.4%) |
| 55 to 64 Years | 431 (100.0%) | 0 (0.0%) |
| 65 to 74 Years | 396 (100.0%) | 0 (0.0%) |
| 75 Years and older | 443 (100.0%) | 0 (0.0%) |
| Total | 5,663 (93.0%) | 423 (7.0%) |
Health Insurance Coverage by Citizenship Status in Wetumpka
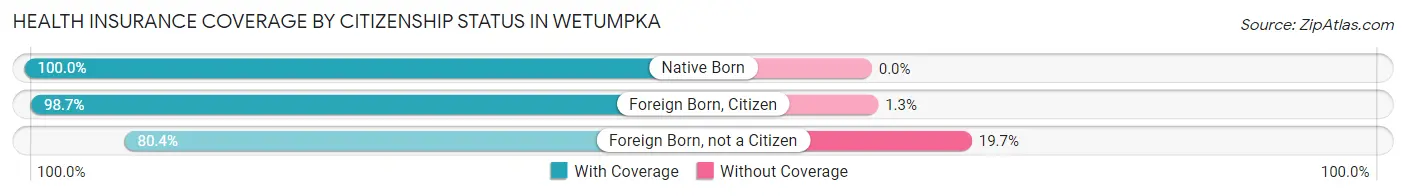
| Citizenship Status | With Coverage | Without Coverage |
| Native Born | 583 (100.0%) | 0 (0.0%) |
| Foreign Born, Citizen | 1,164 (98.7%) | 15 (1.3%) |
| Foreign Born, not a Citizen | 364 (80.3%) | 89 (19.7%) |
Health Insurance Coverage by Household Income in Wetumpka
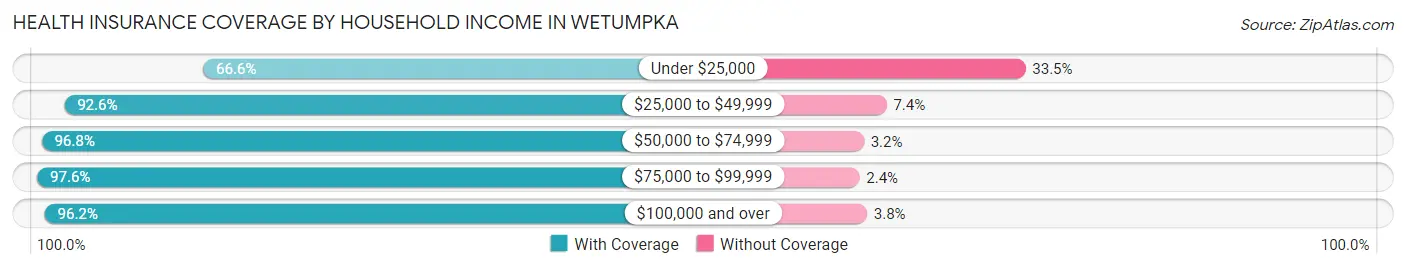
| Household Income | With Coverage | Without Coverage |
| Under $25,000 | 372 (66.5%) | 187 (33.5%) |
| $25,000 to $49,999 | 1,158 (92.6%) | 93 (7.4%) |
| $50,000 to $74,999 | 1,342 (96.8%) | 44 (3.2%) |
| $75,000 to $99,999 | 662 (97.6%) | 16 (2.4%) |
| $100,000 and over | 2,126 (96.2%) | 83 (3.8%) |
Public vs Private Health Insurance Coverage by Age in Wetumpka
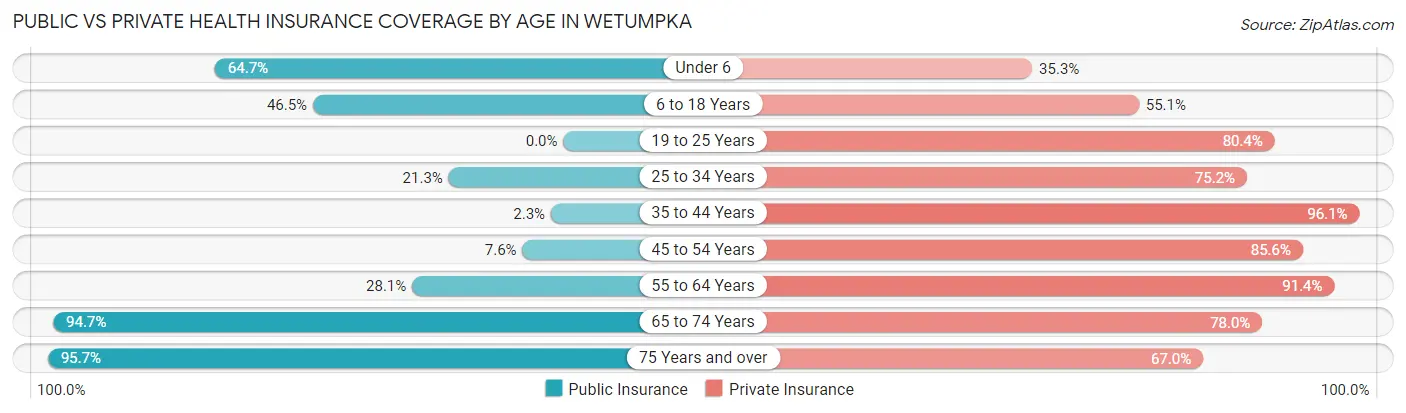
| Age Bracket | Public Insurance | Private Insurance |
| Under 6 | 377 (64.7%) | 206 (35.3%) |
| 6 to 18 Years | 548 (46.5%) | 650 (55.1%) |
| 19 to 25 Years | 0 (0.0%) | 364 (80.3%) |
| 25 to 34 Years | 254 (21.3%) | 897 (75.2%) |
| 35 to 44 Years | 20 (2.3%) | 834 (96.1%) |
| 45 to 54 Years | 41 (7.6%) | 462 (85.6%) |
| 55 to 64 Years | 121 (28.1%) | 394 (91.4%) |
| 65 to 74 Years | 375 (94.7%) | 309 (78.0%) |
| 75 Years and over | 424 (95.7%) | 297 (67.0%) |
| Total | 2,160 (35.5%) | 4,413 (72.5%) |
Disability Status by Sex by Age in Wetumpka
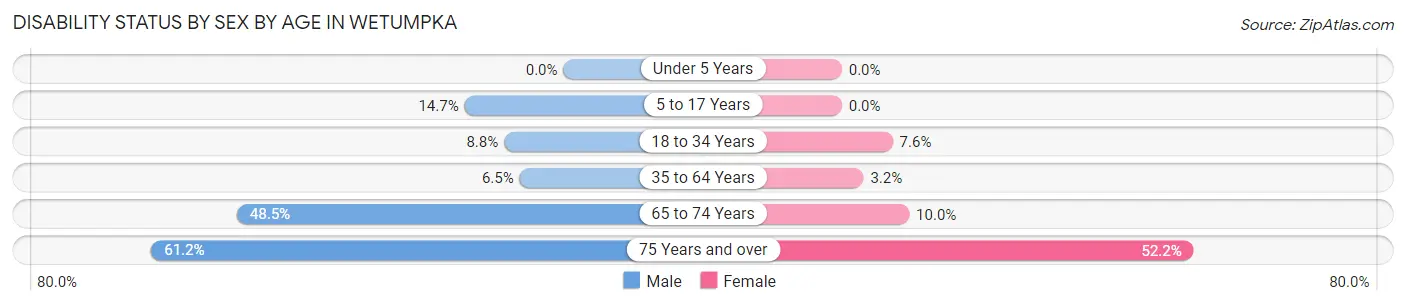
| Age Bracket | Male | Female |
| Under 5 Years | 0 (0.0%) | 0 (0.0%) |
| 5 to 17 Years | 96 (14.7%) | 0 (0.0%) |
| 18 to 34 Years | 77 (8.8%) | 63 (7.5%) |
| 35 to 64 Years | 51 (6.5%) | 34 (3.2%) |
| 65 to 74 Years | 95 (48.5%) | 20 (10.0%) |
| 75 Years and over | 52 (61.2%) | 187 (52.2%) |
Disability Class by Sex by Age in Wetumpka
Disability Class: Hearing Difficulty
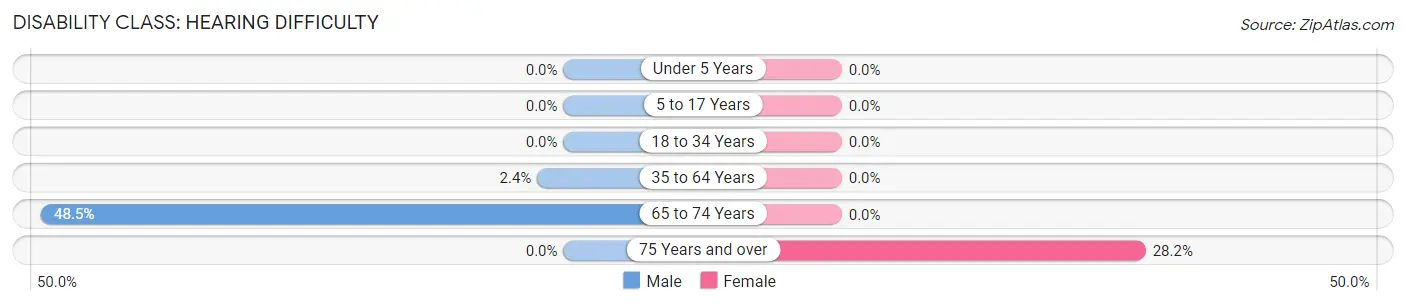
| Age Bracket | Male | Female |
| Under 5 Years | 0 (0.0%) | 0 (0.0%) |
| 5 to 17 Years | 0 (0.0%) | 0 (0.0%) |
| 18 to 34 Years | 0 (0.0%) | 0 (0.0%) |
| 35 to 64 Years | 19 (2.4%) | 0 (0.0%) |
| 65 to 74 Years | 95 (48.5%) | 0 (0.0%) |
| 75 Years and over | 0 (0.0%) | 101 (28.2%) |
Disability Class: Vision Difficulty
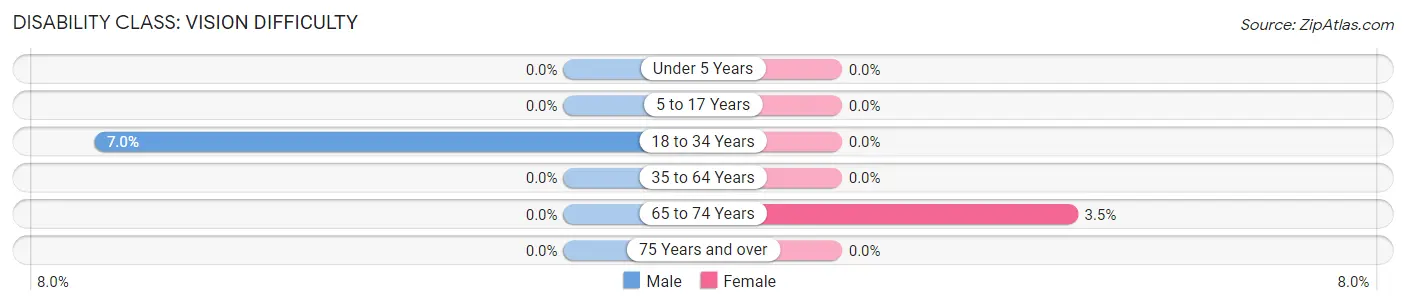
| Age Bracket | Male | Female |
| Under 5 Years | 0 (0.0%) | 0 (0.0%) |
| 5 to 17 Years | 0 (0.0%) | 0 (0.0%) |
| 18 to 34 Years | 61 (7.0%) | 0 (0.0%) |
| 35 to 64 Years | 0 (0.0%) | 0 (0.0%) |
| 65 to 74 Years | 0 (0.0%) | 7 (3.5%) |
| 75 Years and over | 0 (0.0%) | 0 (0.0%) |
Disability Class: Cognitive Difficulty
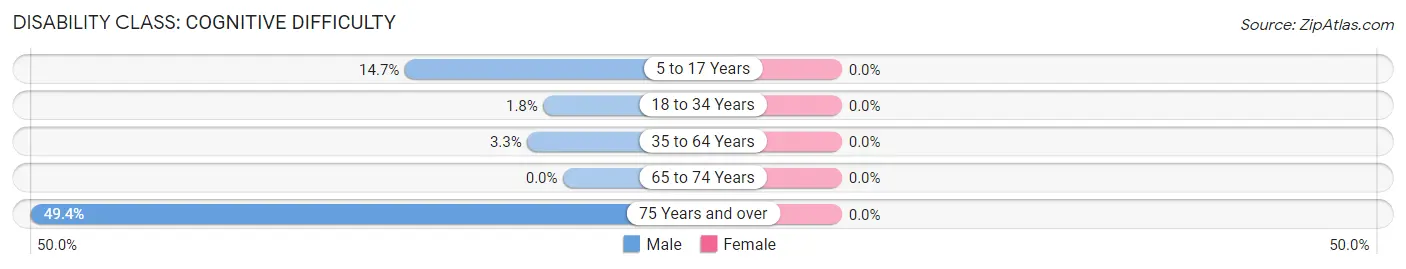
| Age Bracket | Male | Female |
| 5 to 17 Years | 96 (14.7%) | 0 (0.0%) |
| 18 to 34 Years | 16 (1.8%) | 0 (0.0%) |
| 35 to 64 Years | 26 (3.3%) | 0 (0.0%) |
| 65 to 74 Years | 0 (0.0%) | 0 (0.0%) |
| 75 Years and over | 42 (49.4%) | 0 (0.0%) |
Disability Class: Ambulatory Difficulty
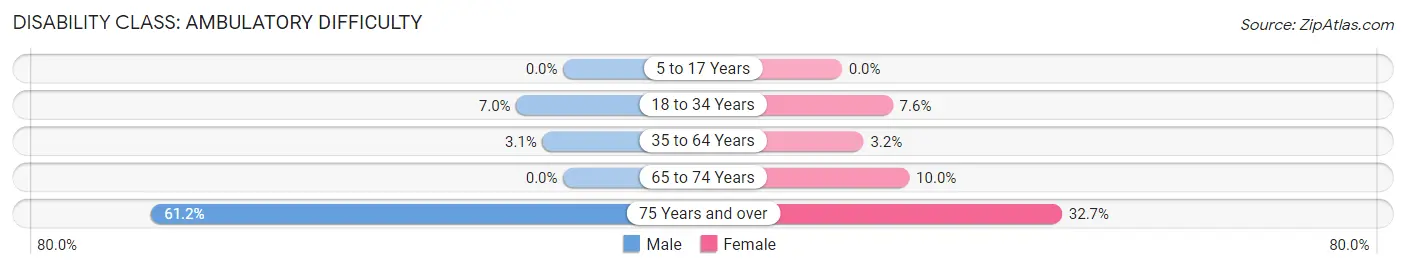
| Age Bracket | Male | Female |
| 5 to 17 Years | 0 (0.0%) | 0 (0.0%) |
| 18 to 34 Years | 61 (7.0%) | 63 (7.5%) |
| 35 to 64 Years | 24 (3.1%) | 34 (3.2%) |
| 65 to 74 Years | 0 (0.0%) | 20 (10.0%) |
| 75 Years and over | 52 (61.2%) | 117 (32.7%) |
Disability Class: Self-Care Difficulty
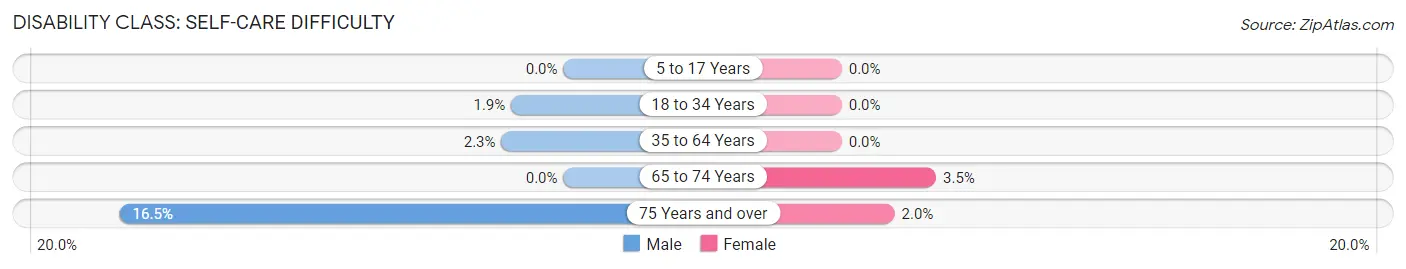
| Age Bracket | Male | Female |
| 5 to 17 Years | 0 (0.0%) | 0 (0.0%) |
| 18 to 34 Years | 17 (1.9%) | 0 (0.0%) |
| 35 to 64 Years | 18 (2.3%) | 0 (0.0%) |
| 65 to 74 Years | 0 (0.0%) | 7 (3.5%) |
| 75 Years and over | 14 (16.5%) | 7 (2.0%) |
Technology Access in Wetumpka
Computing Device Access in Wetumpka
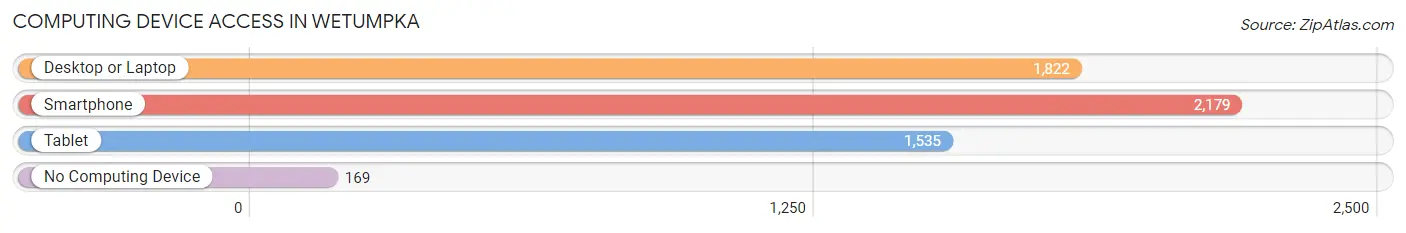
| Device Type | # Households | % Households |
| Desktop or Laptop | 1,822 | 75.8% |
| Smartphone | 2,179 | 90.7% |
| Tablet | 1,535 | 63.9% |
| No Computing Device | 169 | 7.0% |
| Total | 2,402 | 100.0% |
Internet Access in Wetumpka
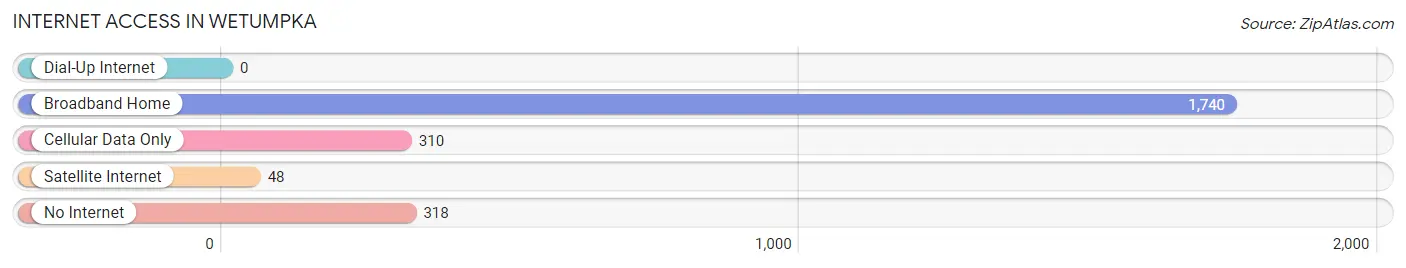
| Internet Type | # Households | % Households |
| Dial-Up Internet | 0 | 0.0% |
| Broadband Home | 1,740 | 72.4% |
| Cellular Data Only | 310 | 12.9% |
| Satellite Internet | 48 | 2.0% |
| No Internet | 318 | 13.2% |
| Total | 2,402 | 100.0% |
Wetumpka Summary
Wetumpka, Alabama is a city located in Elmore County, Alabama, United States. It is situated on the banks of the Coosa River, about 8 miles northeast of Montgomery. The population of Wetumpka was estimated to be 6,719 in 2019.
History
The area that is now Wetumpka was originally inhabited by the Creek Indians. The name Wetumpka is derived from the Creek Indian words "we-wau," meaning "rumbling waters," and "tum-cau," meaning "big town." The Creek Indians were forcibly removed from the area in the 1830s as part of the Indian Removal Act.
The first European settlers arrived in the area in the early 1800s. The town of Wetumpka was officially founded in 1834 and incorporated in 1838. The town was named after the Creek Indian village of Wetumpka, which was located nearby.
The town quickly grew and became a center of commerce and industry. The first cotton mill was built in 1845, and the first railroad line was completed in 1851. The town was also home to several other industries, including a sawmill, a gristmill, and a brickyard.
In the late 1800s, Wetumpka became a popular tourist destination. The town was home to several resorts, including the Wetumpka Hotel, which was built in 1887. The hotel was destroyed by a fire in 1895, but was rebuilt and reopened in 1897.
Geography
Wetumpka is located in central Alabama, about 8 miles northeast of Montgomery. The city is situated on the banks of the Coosa River, which flows through the city. The city is located in the foothills of the Appalachian Mountains.
The city has a total area of 8.3 square miles, of which 8.2 square miles is land and 0.1 square miles is water. The city is located at an elevation of about 300 feet above sea level.
Economy
The economy of Wetumpka is largely based on manufacturing and tourism. The city is home to several manufacturing companies, including a paper mill, a textile mill, and a furniture factory. The city is also home to several tourist attractions, including the Wetumpka Crater, the Wetumpka Depot, and the Coosa River.
Demographics
As of the 2019 census, the population of Wetumpka was estimated to be 6,719. The racial makeup of the city was 68.3% White, 28.2% African American, 0.7% Native American, 0.7% Asian, 0.2% Pacific Islander, 0.7% from other races, and 1.2% from two or more races. Hispanic or Latino of any race were 2.2% of the population.
The median household income in Wetumpka was $41,945 in 2019. The per capita income for the city was $20,945. About 17.3% of the population was below the poverty line.
Common Questions
What is Per Capita Income in Wetumpka?
Per Capita income in Wetumpka is $29,330.
What is the Median Family Income in Wetumpka?
Median Family Income in Wetumpka is $62,225.
What is the Median Household income in Wetumpka?
Median Household Income in Wetumpka is $54,477.
What is Income or Wage Gap in Wetumpka?
Income or Wage Gap in Wetumpka is 10.8%.
Women in Wetumpka earn 89.2 cents for every dollar earned by a man.
What is Inequality or Gini Index in Wetumpka?
Inequality or Gini Index in Wetumpka is 0.41.
What is the Total Population of Wetumpka?
Total Population of Wetumpka is 7,129.
What is the Total Male Population of Wetumpka?
Total Male Population of Wetumpka is 3,442.
What is the Total Female Population of Wetumpka?
Total Female Population of Wetumpka is 3,687.
What is the Ratio of Males per 100 Females in Wetumpka?
There are 93.36 Males per 100 Females in Wetumpka.
What is the Ratio of Females per 100 Males in Wetumpka?
There are 107.12 Females per 100 Males in Wetumpka.
What is the Median Population Age in Wetumpka?
Median Population Age in Wetumpka is 33.5 Years.
What is the Average Family Size in Wetumpka
Average Family Size in Wetumpka is 3.0 People.
What is the Average Household Size in Wetumpka
Average Household Size in Wetumpka is 2.5 People.
How Large is the Labor Force in Wetumpka?
There are 3,070 People in the Labor Forcein in Wetumpka.
What is the Percentage of People in the Labor Force in Wetumpka?
55.6% of People are in the Labor Force in Wetumpka.
What is the Unemployment Rate in Wetumpka?
Unemployment Rate in Wetumpka is 5.4%.