Springville, AL Map & Demographics
Springville Map
Springville Overview
$33,611
PER CAPITA INCOME
$92,813
AVG FAMILY INCOME
$62,386
AVG HOUSEHOLD INCOME
48.9%
WAGE / INCOME GAP [ % ]
51.1¢/ $1
WAGE / INCOME GAP [ $ ]
0.34
INEQUALITY / GINI INDEX
4,824
TOTAL POPULATION
2,144
MALE POPULATION
2,680
FEMALE POPULATION
80.00
MALES / 100 FEMALES
125.00
FEMALES / 100 MALES
49.8
MEDIAN AGE
3.0
AVG FAMILY SIZE
2.6
AVG HOUSEHOLD SIZE
2,137
LABOR FORCE [ PEOPLE ]
53.9%
PERCENT IN LABOR FORCE
1.5%
UNEMPLOYMENT RATE
Springville Zip Codes
Springville Area Codes
Income in Springville
Income Overview in Springville
Per Capita Income in Springville is $33,611, while median incomes of families and households are $92,813 and $62,386 respectively.
| Characteristic | Number | Measure |
| Per Capita Income | 4,824 | $33,611 |
| Median Family Income | 1,480 | $92,813 |
| Mean Family Income | 1,480 | $96,984 |
| Median Household Income | 1,871 | $62,386 |
| Mean Household Income | 1,871 | $85,985 |
| Income Deficit | 1,480 | $0 |
| Wage / Income Gap (%) | 4,824 | 48.93% |
| Wage / Income Gap ($) | 4,824 | 51.07¢ per $1 |
| Gini / Inequality Index | 4,824 | 0.34 |
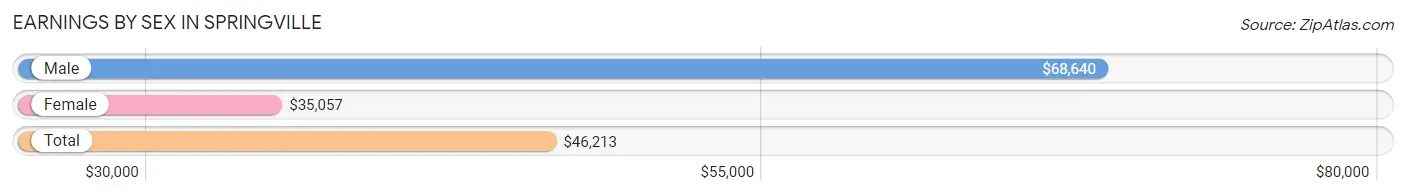
Earnings by Sex in Springville
Average Earnings in Springville are $46,213, $68,640 for men and $35,057 for women, a difference of 48.9%.
| Sex | Number | Average Earnings |
| Male | 1,016 (44.3%) | $68,640 |
| Female | 1,277 (55.7%) | $35,057 |
| Total | 2,293 (100.0%) | $46,213 |
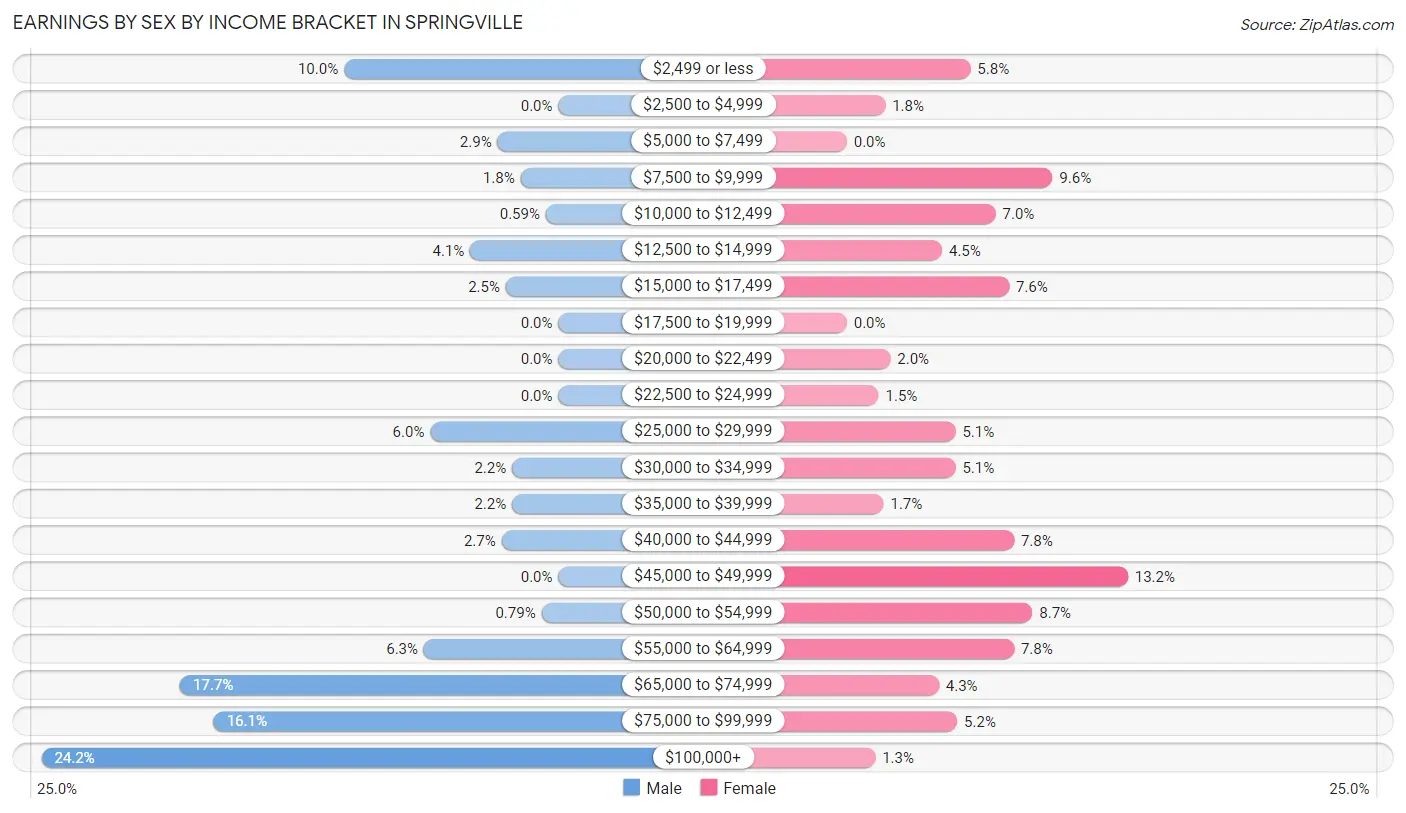
Earnings by Sex by Income Bracket in Springville
The most common earnings brackets in Springville are $100,000+ for men (246 | 24.2%) and $45,000 to $49,999 for women (168 | 13.2%).
| Income | Male | Female |
| $2,499 or less | 102 (10.0%) | 74 (5.8%) |
| $2,500 to $4,999 | 0 (0.0%) | 23 (1.8%) |
| $5,000 to $7,499 | 29 (2.9%) | 0 (0.0%) |
| $7,500 to $9,999 | 18 (1.8%) | 123 (9.6%) |
| $10,000 to $12,499 | 6 (0.6%) | 89 (7.0%) |
| $12,500 to $14,999 | 42 (4.1%) | 57 (4.5%) |
| $15,000 to $17,499 | 25 (2.5%) | 97 (7.6%) |
| $17,500 to $19,999 | 0 (0.0%) | 0 (0.0%) |
| $20,000 to $22,499 | 0 (0.0%) | 26 (2.0%) |
| $22,500 to $24,999 | 0 (0.0%) | 19 (1.5%) |
| $25,000 to $29,999 | 61 (6.0%) | 65 (5.1%) |
| $30,000 to $34,999 | 22 (2.2%) | 65 (5.1%) |
| $35,000 to $39,999 | 22 (2.2%) | 22 (1.7%) |
| $40,000 to $44,999 | 27 (2.7%) | 100 (7.8%) |
| $45,000 to $49,999 | 0 (0.0%) | 168 (13.2%) |
| $50,000 to $54,999 | 8 (0.8%) | 111 (8.7%) |
| $55,000 to $64,999 | 64 (6.3%) | 100 (7.8%) |
| $65,000 to $74,999 | 180 (17.7%) | 55 (4.3%) |
| $75,000 to $99,999 | 164 (16.1%) | 66 (5.2%) |
| $100,000+ | 246 (24.2%) | 17 (1.3%) |
| Total | 1,016 (100.0%) | 1,277 (100.0%) |
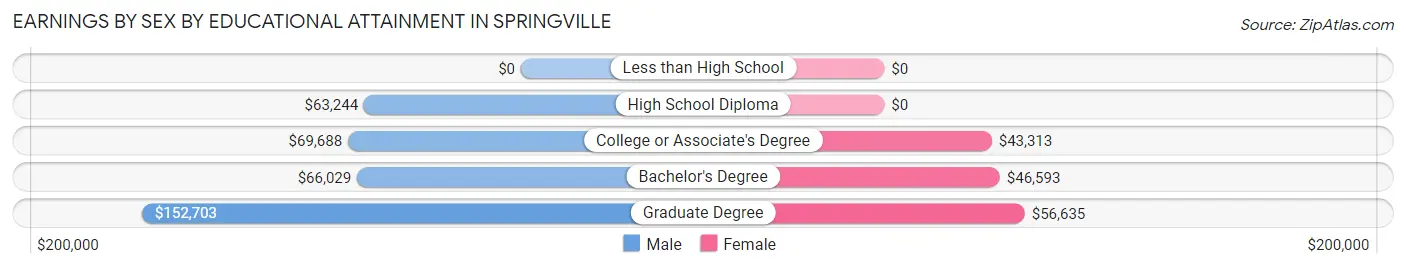
Earnings by Sex by Educational Attainment in Springville
Average earnings in Springville are $70,824 for men and $43,777 for women, a difference of 38.2%. Men with an educational attainment of graduate degree enjoy the highest average annual earnings of $152,703, while those with high school diploma education earn the least with $63,244. Women with an educational attainment of graduate degree earn the most with the average annual earnings of $56,635, while those with college or associate's degree education have the smallest earnings of $43,313.
| Educational Attainment | Male Income | Female Income |
| Less than High School | - | - |
| High School Diploma | $63,244 | $0 |
| College or Associate's Degree | $69,688 | $43,313 |
| Bachelor's Degree | $66,029 | $46,593 |
| Graduate Degree | $152,703 | $56,635 |
| Total | $70,824 | $43,777 |
Family Income in Springville
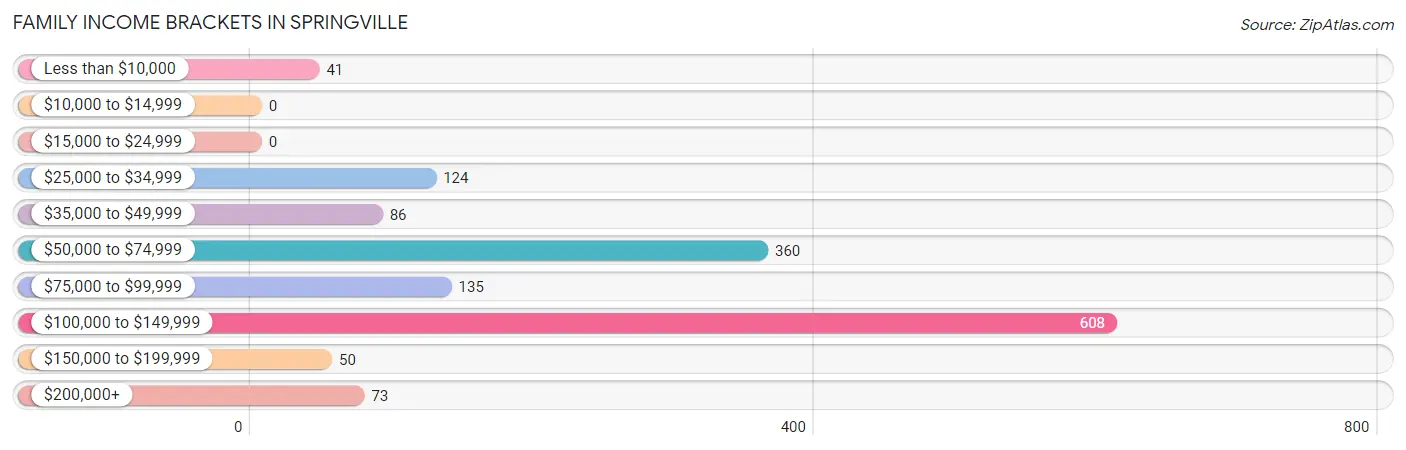
Family Income Brackets in Springville
According to the Springville family income data, there are 608 families falling into the $100,000 to $149,999 income range, which is the most common income bracket and makes up 41.1% of all families.
| Income Bracket | # Families | % Families |
| Less than $10,000 | 41 | 2.8% |
| $10,000 to $14,999 | 0 | 0.0% |
| $15,000 to $24,999 | 0 | 0.0% |
| $25,000 to $34,999 | 124 | 8.4% |
| $35,000 to $49,999 | 86 | 5.8% |
| $50,000 to $74,999 | 360 | 24.3% |
| $75,000 to $99,999 | 135 | 9.1% |
| $100,000 to $149,999 | 608 | 41.1% |
| $150,000 to $199,999 | 50 | 3.4% |
| $200,000+ | 73 | 4.9% |
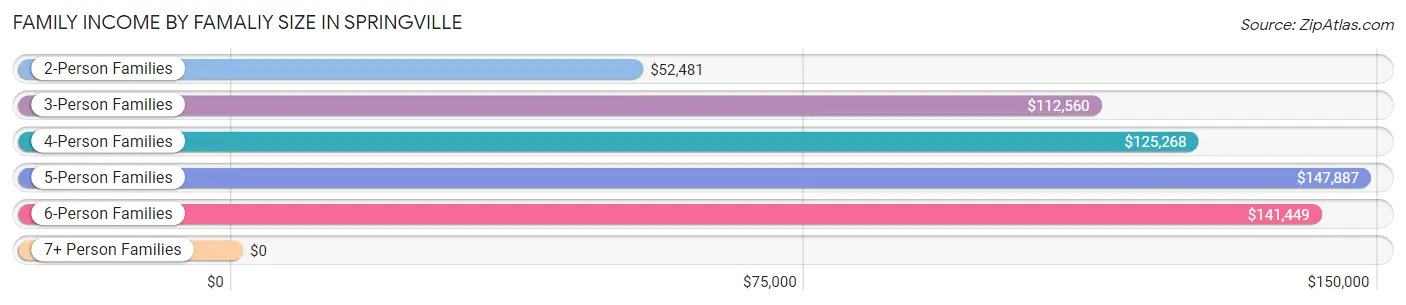
Family Income by Famaliy Size in Springville
5-person families (208 | 14.1%) account for the highest median family income in Springville with $147,887 per family, while 3-person families (169 | 11.4%) have the highest median income of $37,520 per family member.
| Income Bracket | # Families | Median Income |
| 2-Person Families | 821 (55.5%) | $52,481 |
| 3-Person Families | 169 (11.4%) | $112,560 |
| 4-Person Families | 217 (14.7%) | $125,268 |
| 5-Person Families | 208 (14.1%) | $147,887 |
| 6-Person Families | 65 (4.4%) | $141,449 |
| 7+ Person Families | 0 (0.0%) | $0 |
| Total | 1,480 (100.0%) | $92,813 |
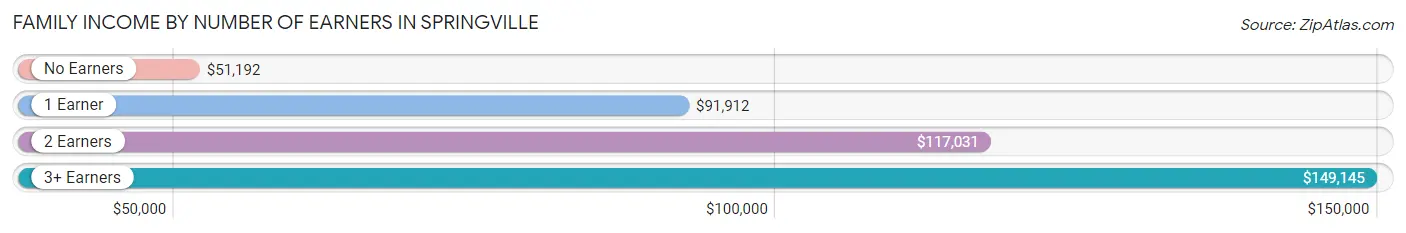
Family Income by Number of Earners in Springville
The median family income in Springville is $92,813, with families comprising 3+ earners (166) having the highest median family income of $149,145, while families with no earners (384) have the lowest median family income of $51,192, accounting for 11.2% and 26.0% of families, respectively.
| Number of Earners | # Families | Median Income |
| No Earners | 384 (26.0%) | $51,192 |
| 1 Earner | 274 (18.5%) | $91,912 |
| 2 Earners | 656 (44.3%) | $117,031 |
| 3+ Earners | 166 (11.2%) | $149,145 |
| Total | 1,480 (100.0%) | $92,813 |
Household Income in Springville
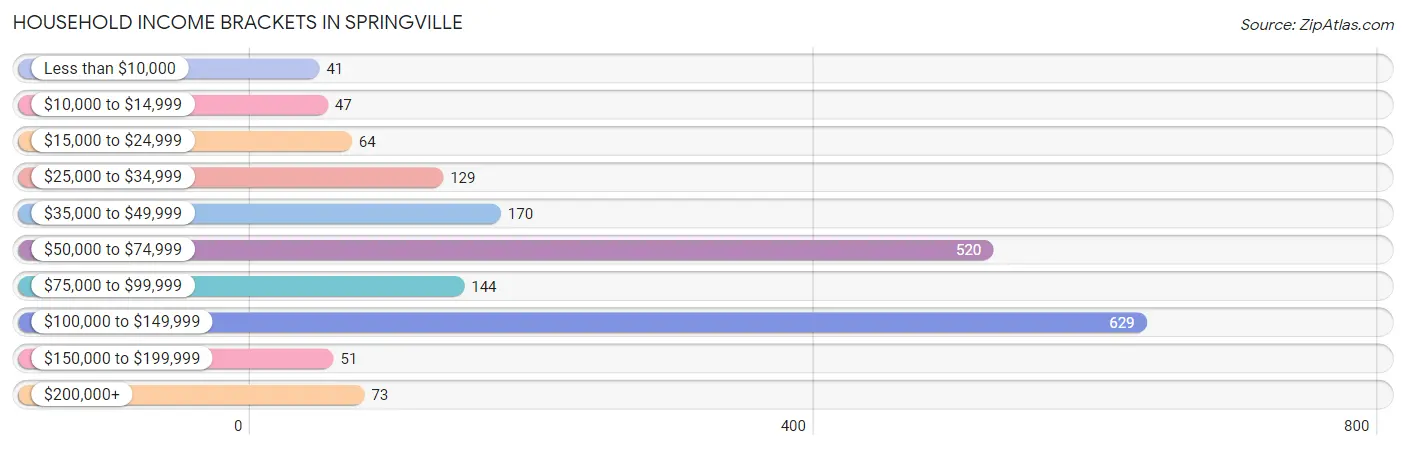
Household Income Brackets in Springville
With 629 households falling in the category, the $100,000 to $149,999 income range is the most frequent in Springville, accounting for 33.6% of all households. In contrast, only 41 households (2.2%) fall into the less than $10,000 income bracket, making it the least populous group.
| Income Bracket | # Households | % Households |
| Less than $10,000 | 41 | 2.2% |
| $10,000 to $14,999 | 47 | 2.5% |
| $15,000 to $24,999 | 64 | 3.4% |
| $25,000 to $34,999 | 129 | 6.9% |
| $35,000 to $49,999 | 170 | 9.1% |
| $50,000 to $74,999 | 520 | 27.8% |
| $75,000 to $99,999 | 144 | 7.7% |
| $100,000 to $149,999 | 629 | 33.6% |
| $150,000 to $199,999 | 51 | 2.7% |
| $200,000+ | 73 | 3.9% |
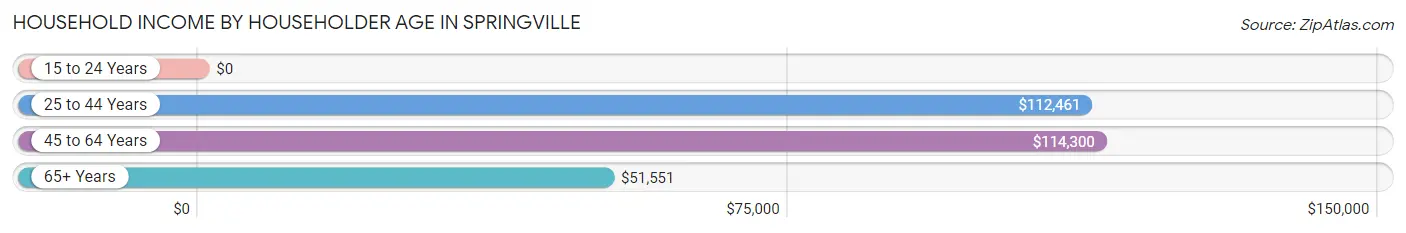
Household Income by Householder Age in Springville
The median household income in Springville is $62,386, with the highest median household income of $114,300 found in the 45 to 64 years age bracket for the primary householder. A total of 728 households (38.9%) fall into this category.
| Income Bracket | # Households | Median Income |
| 15 to 24 Years | 0 (0.0%) | $0 |
| 25 to 44 Years | 359 (19.2%) | $112,461 |
| 45 to 64 Years | 728 (38.9%) | $114,300 |
| 65+ Years | 784 (41.9%) | $51,551 |
| Total | 1,871 (100.0%) | $62,386 |
Poverty in Springville
Income Below Poverty by Sex and Age in Springville
With 1.2% poverty level for males and 5.1% for females among the residents of Springville, 65 to 74 year old males and 16 and 17 year old females are the most vulnerable to poverty, with 26 males (7.5%) and 16 females (47.1%) in their respective age groups living below the poverty level.
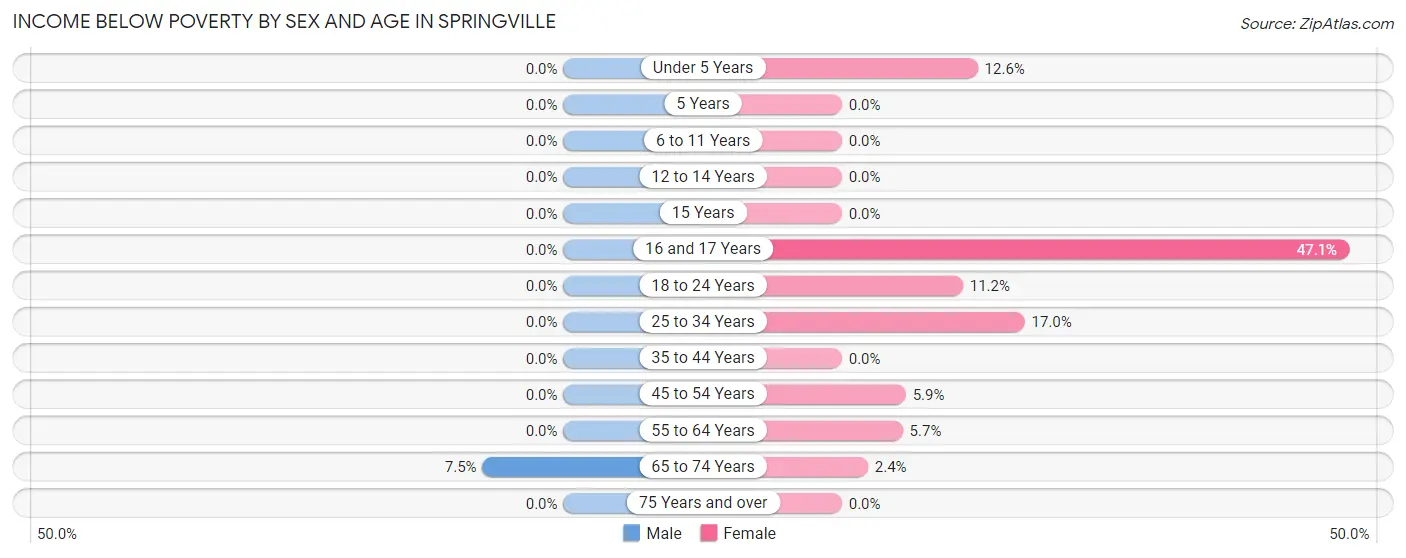
| Age Bracket | Male | Female |
| Under 5 Years | 0 (0.0%) | 14 (12.6%) |
| 5 Years | 0 (0.0%) | 0 (0.0%) |
| 6 to 11 Years | 0 (0.0%) | 0 (0.0%) |
| 12 to 14 Years | 0 (0.0%) | 0 (0.0%) |
| 15 Years | 0 (0.0%) | 0 (0.0%) |
| 16 and 17 Years | 0 (0.0%) | 16 (47.1%) |
| 18 to 24 Years | 0 (0.0%) | 21 (11.2%) |
| 25 to 34 Years | 0 (0.0%) | 38 (17.0%) |
| 35 to 44 Years | 0 (0.0%) | 0 (0.0%) |
| 45 to 54 Years | 0 (0.0%) | 16 (5.9%) |
| 55 to 64 Years | 0 (0.0%) | 23 (5.7%) |
| 65 to 74 Years | 26 (7.5%) | 9 (2.4%) |
| 75 Years and over | 0 (0.0%) | 0 (0.0%) |
| Total | 26 (1.2%) | 137 (5.1%) |
Income Above Poverty by Sex and Age in Springville
According to the poverty statistics in Springville, males aged under 5 years and females aged 5 years are the age groups that are most secure financially, with 100.0% of males and 100.0% of females in these age groups living above the poverty line.
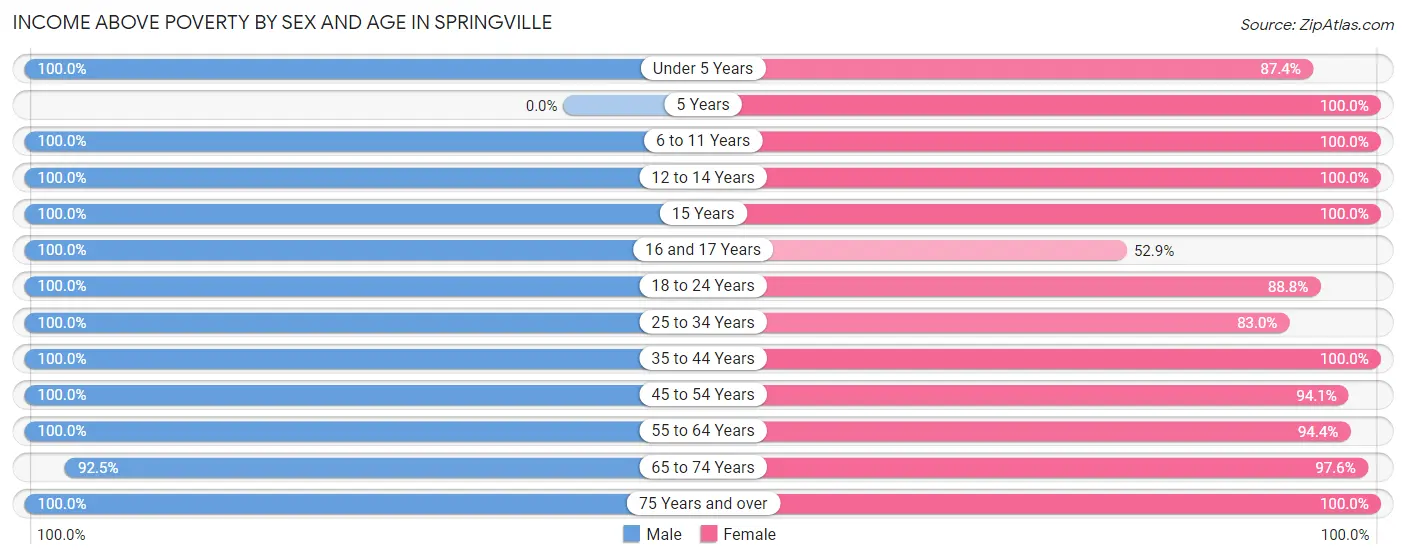
| Age Bracket | Male | Female |
| Under 5 Years | 85 (100.0%) | 97 (87.4%) |
| 5 Years | 0 (0.0%) | 7 (100.0%) |
| 6 to 11 Years | 123 (100.0%) | 133 (100.0%) |
| 12 to 14 Years | 166 (100.0%) | 124 (100.0%) |
| 15 Years | 55 (100.0%) | 55 (100.0%) |
| 16 and 17 Years | 144 (100.0%) | 18 (52.9%) |
| 18 to 24 Years | 92 (100.0%) | 166 (88.8%) |
| 25 to 34 Years | 187 (100.0%) | 186 (83.0%) |
| 35 to 44 Years | 154 (100.0%) | 363 (100.0%) |
| 45 to 54 Years | 312 (100.0%) | 254 (94.1%) |
| 55 to 64 Years | 351 (100.0%) | 384 (94.4%) |
| 65 to 74 Years | 320 (92.5%) | 363 (97.6%) |
| 75 Years and over | 129 (100.0%) | 393 (100.0%) |
| Total | 2,118 (98.8%) | 2,543 (94.9%) |
Income Below Poverty Among Married-Couple Families in Springville
The poverty statistics for married-couple families in Springville show that 2.1% or 26 of the total 1,252 families live below the poverty line. Families with no children have the highest poverty rate of 3.4%, comprising of 26 families. On the other hand, families with 1 or 2 children have the lowest poverty rate of 0.0%, which includes 0 families.
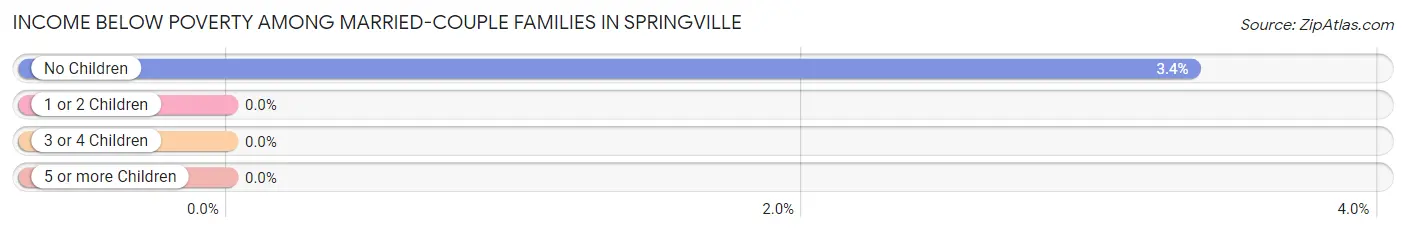
| Children | Above Poverty | Below Poverty |
| No Children | 749 (96.7%) | 26 (3.4%) |
| 1 or 2 Children | 381 (100.0%) | 0 (0.0%) |
| 3 or 4 Children | 96 (100.0%) | 0 (0.0%) |
| 5 or more Children | 0 (0.0%) | 0 (0.0%) |
| Total | 1,226 (97.9%) | 26 (2.1%) |
Income Below Poverty Among Single-Parent Households in Springville
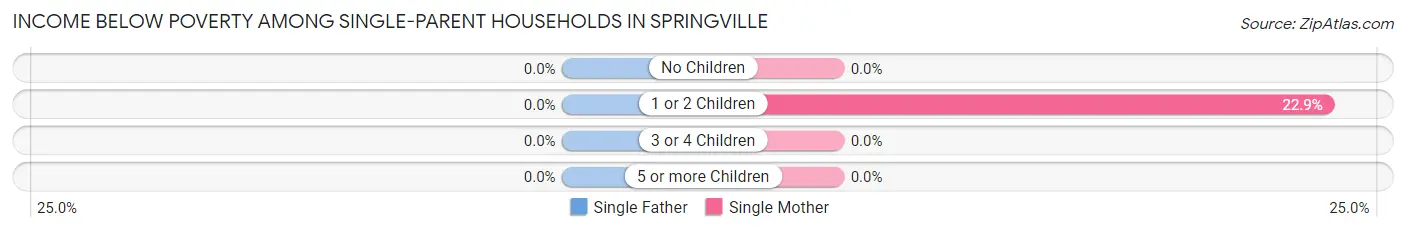
| Children | Single Father | Single Mother |
| No Children | 0 (0.0%) | 0 (0.0%) |
| 1 or 2 Children | 0 (0.0%) | 16 (22.9%) |
| 3 or 4 Children | 0 (0.0%) | 0 (0.0%) |
| 5 or more Children | 0 (0.0%) | 0 (0.0%) |
| Total | 0 (0.0%) | 16 (7.2%) |
Income Below Poverty Among Married-Couple vs Single-Parent Households in Springville
The poverty data for Springville shows that 26 of the married-couple family households (2.1%) and 16 of the single-parent households (7.0%) are living below the poverty level. Within the married-couple family households, those with no children have the highest poverty rate, with 26 households (3.4%) falling below the poverty line. Among the single-parent households, those with 1 or 2 children have the highest poverty rate, with 16 household (21.3%) living below poverty.
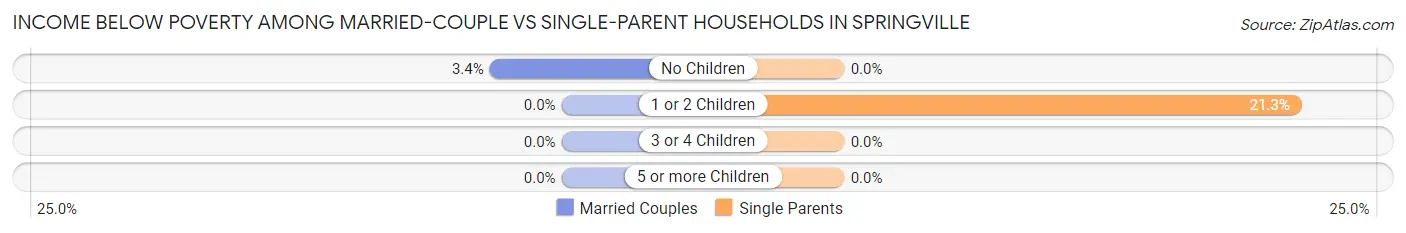
| Children | Married-Couple Families | Single-Parent Households |
| No Children | 26 (3.4%) | 0 (0.0%) |
| 1 or 2 Children | 0 (0.0%) | 16 (21.3%) |
| 3 or 4 Children | 0 (0.0%) | 0 (0.0%) |
| 5 or more Children | 0 (0.0%) | 0 (0.0%) |
| Total | 26 (2.1%) | 16 (7.0%) |
Race in Springville
The most populous races in Springville are White / Caucasian (4,330 | 89.8%), Black / African American (368 | 7.6%), and Two or more Races (84 | 1.7%).
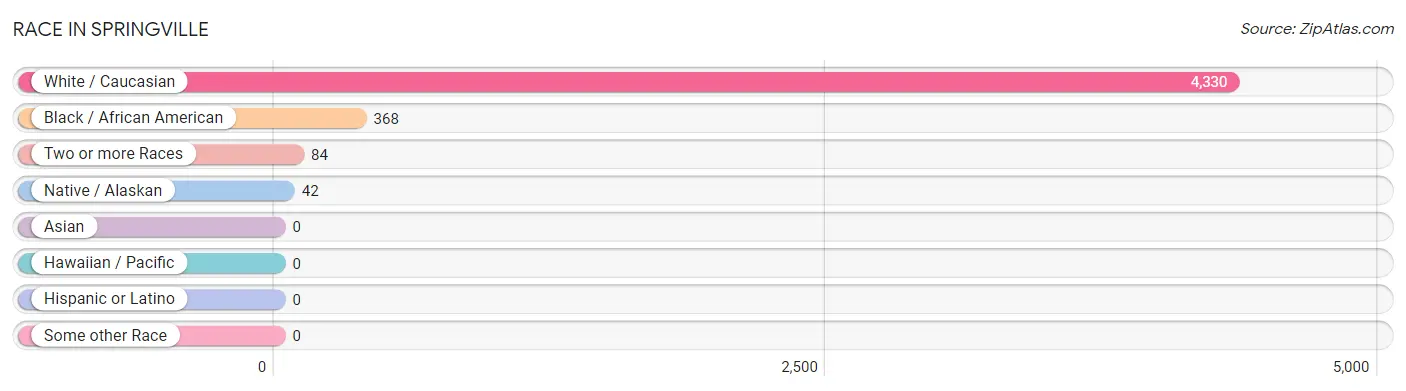
| Race | # Population | % Population |
| Asian | 0 | 0.0% |
| Black / African American | 368 | 7.6% |
| Hawaiian / Pacific | 0 | 0.0% |
| Hispanic or Latino | 0 | 0.0% |
| Native / Alaskan | 42 | 0.9% |
| White / Caucasian | 4,330 | 89.8% |
| Two or more Races | 84 | 1.7% |
| Some other Race | 0 | 0.0% |
| Total | 4,824 | 100.0% |
Ancestry in Springville
The most populous ancestries reported in Springville are American (623 | 12.9%), German (470 | 9.7%), Irish (330 | 6.8%), English (280 | 5.8%), and European (195 | 4.0%), together accounting for 39.3% of all Springville residents.
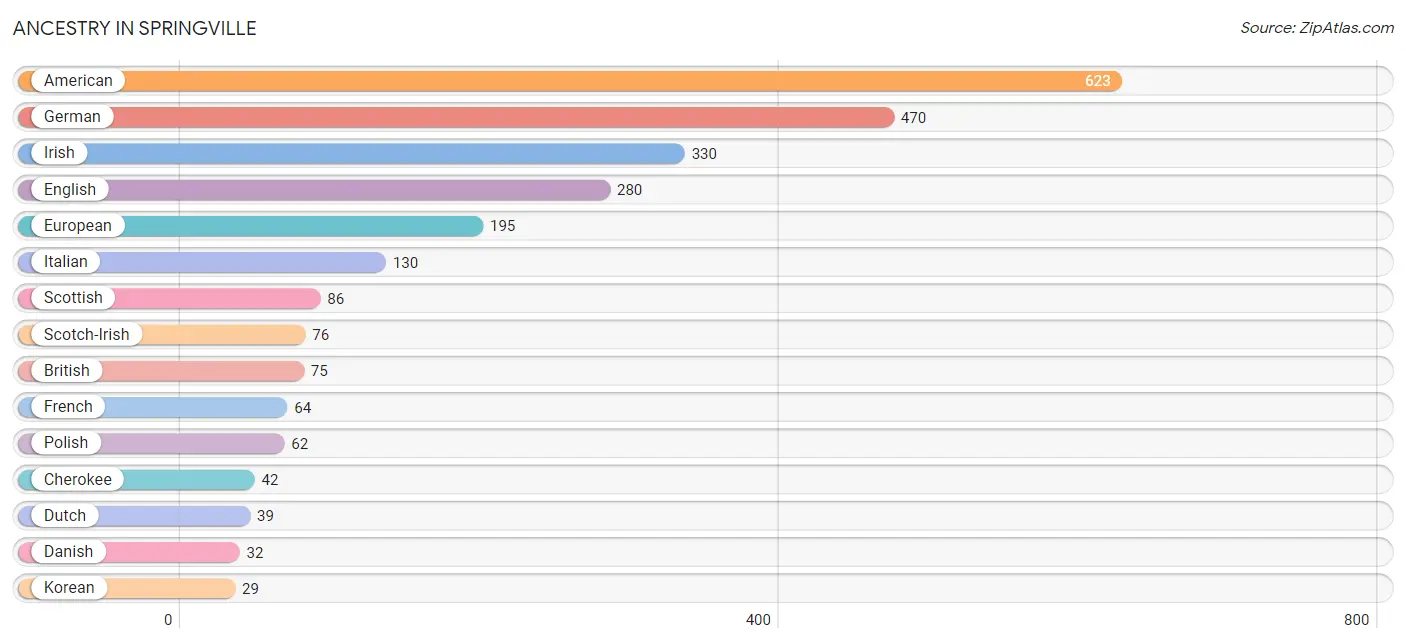
| Ancestry | # Population | % Population |
| African | 22 | 0.5% |
| American | 623 | 12.9% |
| British | 75 | 1.5% |
| Cherokee | 42 | 0.9% |
| Danish | 32 | 0.7% |
| Dutch | 39 | 0.8% |
| English | 280 | 5.8% |
| European | 195 | 4.0% |
| French | 64 | 1.3% |
| German | 470 | 9.7% |
| Greek | 17 | 0.4% |
| Irish | 330 | 6.8% |
| Italian | 130 | 2.7% |
| Kenyan | 7 | 0.2% |
| Korean | 29 | 0.6% |
| Polish | 62 | 1.3% |
| Scotch-Irish | 76 | 1.6% |
| Scottish | 86 | 1.8% |
| Subsaharan African | 29 | 0.6% |
| Ukrainian | 23 | 0.5% | View All 20 Rows |
Immigrants in Springville
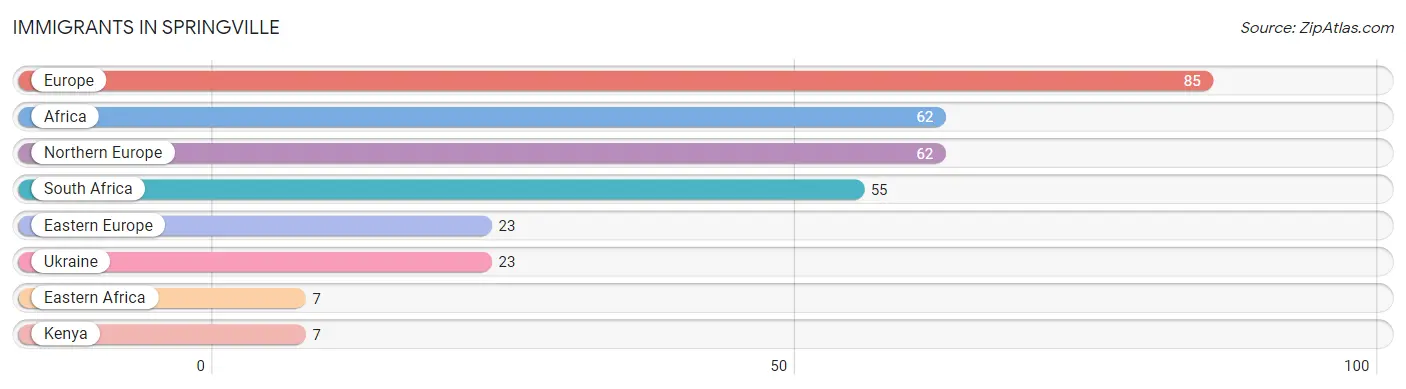
The most numerous immigrant groups reported in Springville came from Europe (85 | 1.8%), Africa (62 | 1.3%), Northern Europe (62 | 1.3%), South Africa (55 | 1.1%), and Eastern Europe (23 | 0.5%), together accounting for 6.0% of all Springville residents.
| Immigration Origin | # Population | % Population |
| Africa | 62 | 1.3% |
| Eastern Africa | 7 | 0.2% |
| Eastern Europe | 23 | 0.5% |
| Europe | 85 | 1.8% |
| Kenya | 7 | 0.2% |
| Northern Europe | 62 | 1.3% |
| South Africa | 55 | 1.1% |
| Ukraine | 23 | 0.5% | View All 8 Rows |
Sex and Age in Springville
Sex and Age in Springville
The most populous age groups in Springville are 50 to 54 Years (224 | 10.4%) for men and 70 to 74 Years (286 | 10.7%) for women.
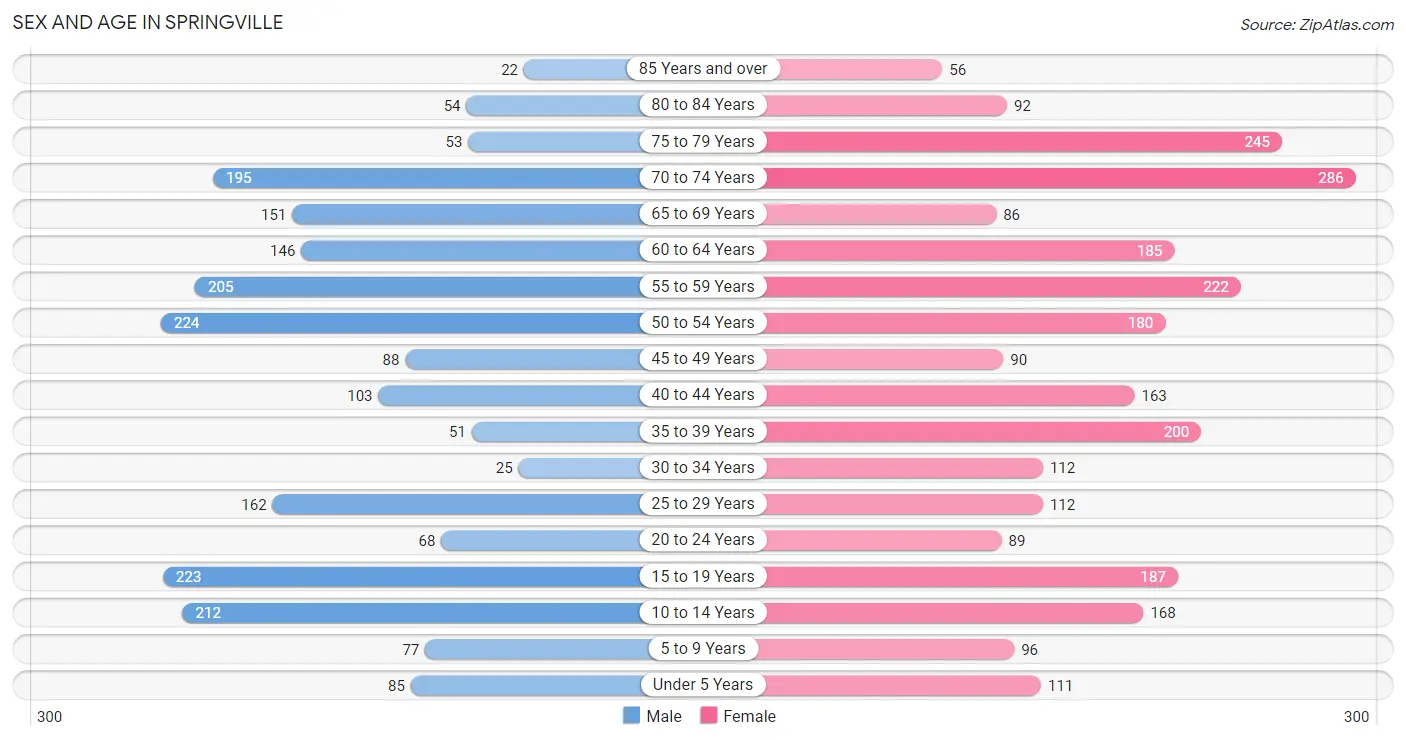
| Age Bracket | Male | Female |
| Under 5 Years | 85 (4.0%) | 111 (4.1%) |
| 5 to 9 Years | 77 (3.6%) | 96 (3.6%) |
| 10 to 14 Years | 212 (9.9%) | 168 (6.3%) |
| 15 to 19 Years | 223 (10.4%) | 187 (7.0%) |
| 20 to 24 Years | 68 (3.2%) | 89 (3.3%) |
| 25 to 29 Years | 162 (7.6%) | 112 (4.2%) |
| 30 to 34 Years | 25 (1.2%) | 112 (4.2%) |
| 35 to 39 Years | 51 (2.4%) | 200 (7.5%) |
| 40 to 44 Years | 103 (4.8%) | 163 (6.1%) |
| 45 to 49 Years | 88 (4.1%) | 90 (3.4%) |
| 50 to 54 Years | 224 (10.4%) | 180 (6.7%) |
| 55 to 59 Years | 205 (9.6%) | 222 (8.3%) |
| 60 to 64 Years | 146 (6.8%) | 185 (6.9%) |
| 65 to 69 Years | 151 (7.0%) | 86 (3.2%) |
| 70 to 74 Years | 195 (9.1%) | 286 (10.7%) |
| 75 to 79 Years | 53 (2.5%) | 245 (9.1%) |
| 80 to 84 Years | 54 (2.5%) | 92 (3.4%) |
| 85 Years and over | 22 (1.0%) | 56 (2.1%) |
| Total | 2,144 (100.0%) | 2,680 (100.0%) |
Families and Households in Springville
Median Family Size in Springville
The median family size in Springville is 2.99 persons per family, with single male/father families (5 | 0.3%) accounting for the largest median family size of 4 persons per family. On the other hand, single female/mother families (223 | 15.1%) represent the smallest median family size with 2.88 persons per family.
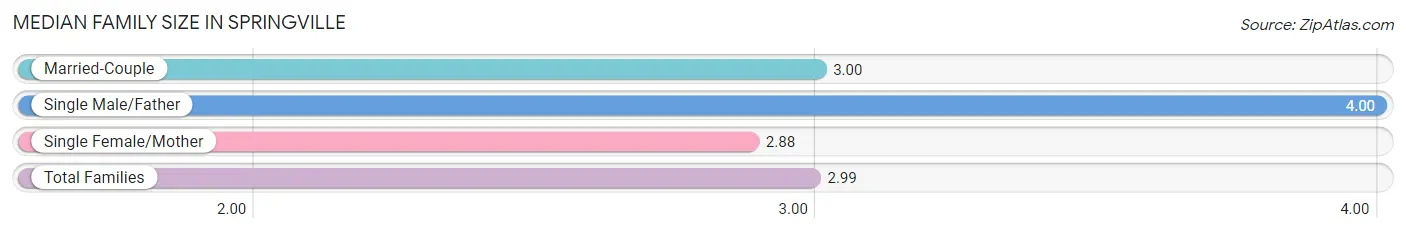
| Family Type | # Families | Family Size |
| Married-Couple | 1,252 (84.6%) | 3.00 |
| Single Male/Father | 5 (0.3%) | 4.00 |
| Single Female/Mother | 223 (15.1%) | 2.88 |
| Total Families | 1,480 (100.0%) | 2.99 |
Median Household Size in Springville
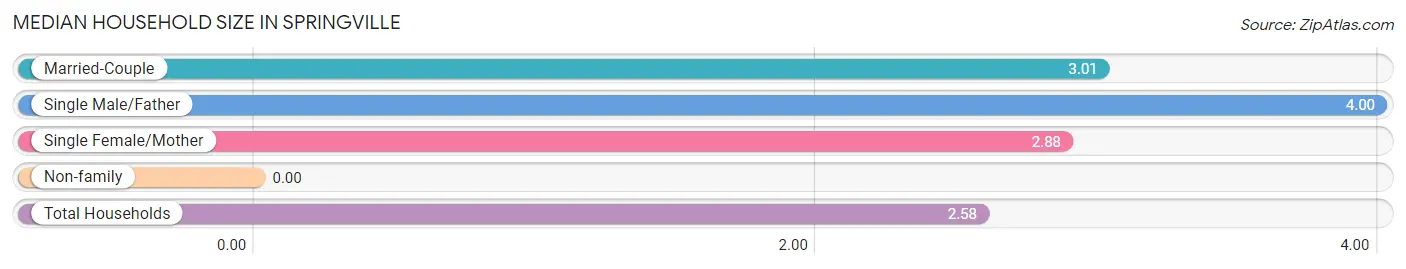
| Household Type | # Households | Household Size |
| Married-Couple | 1,252 (66.9%) | 3.01 |
| Single Male/Father | 5 (0.3%) | 4.00 |
| Single Female/Mother | 223 (11.9%) | 2.88 |
| Non-family | 391 (20.9%) | - |
| Total Households | 1,871 (100.0%) | 2.58 |
Household Size by Marriage Status in Springville
Out of a total of 1,871 households in Springville, 1,480 (79.1%) are family households, while 391 (20.9%) are nonfamily households. The most numerous type of family households are 2-person households, comprising 821, and the most common type of nonfamily households are 1-person households, comprising 391.
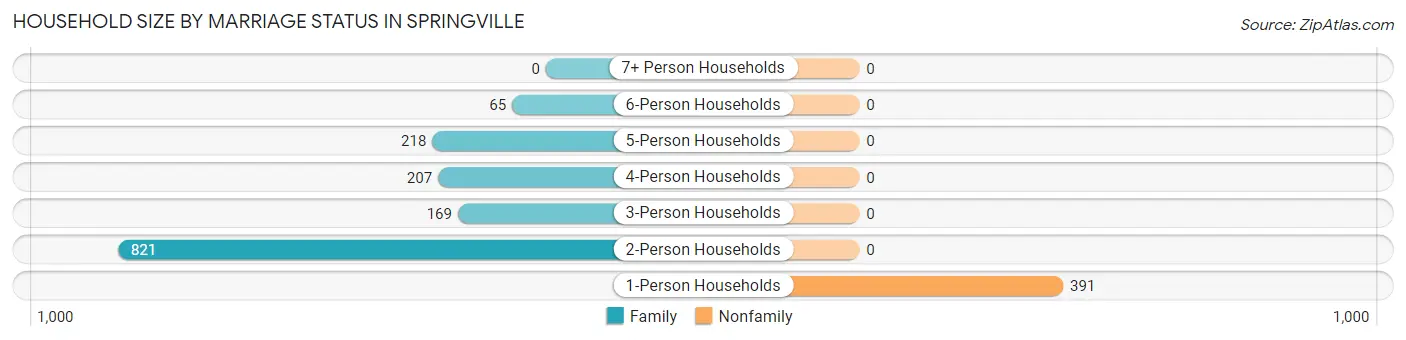
| Household Size | Family Households | Nonfamily Households |
| 1-Person Households | - | 391 (20.9%) |
| 2-Person Households | 821 (43.9%) | 0 (0.0%) |
| 3-Person Households | 169 (9.0%) | 0 (0.0%) |
| 4-Person Households | 207 (11.1%) | 0 (0.0%) |
| 5-Person Households | 218 (11.7%) | 0 (0.0%) |
| 6-Person Households | 65 (3.5%) | 0 (0.0%) |
| 7+ Person Households | 0 (0.0%) | 0 (0.0%) |
| Total | 1,480 (79.1%) | 391 (20.9%) |
Female Fertility in Springville
Fertility by Age in Springville
Average fertility rate in Springville is 109.0 births per 1,000 women. Women in the age bracket of 20 to 34 years have the highest fertility rate with 176.0 births per 1,000 women. Women in the age bracket of 20 to 34 years acount for 52.9% of all women with births.
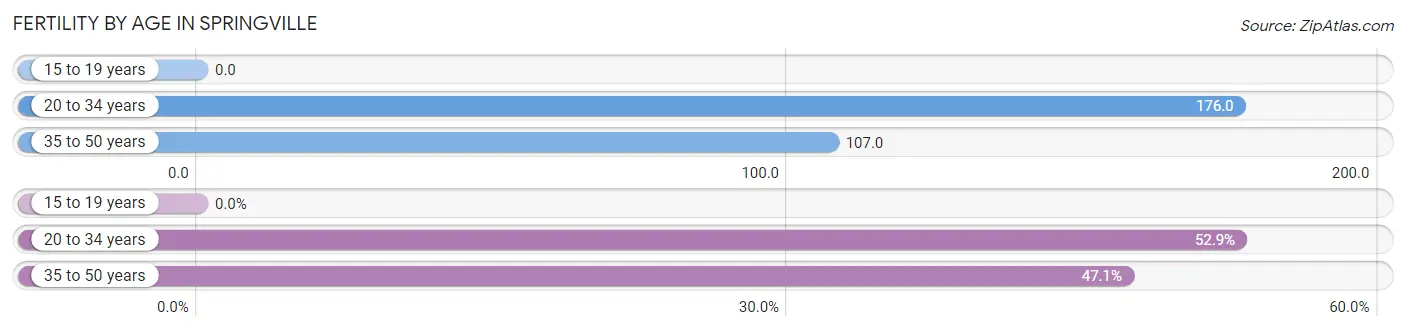
| Age Bracket | Women with Births | Births / 1,000 Women |
| 15 to 19 years | 0 (0.0%) | 0.0 |
| 20 to 34 years | 55 (52.9%) | 176.0 |
| 35 to 50 years | 49 (47.1%) | 107.0 |
| Total | 104 (100.0%) | 109.0 |
Fertility by Age by Marriage Status in Springville
79.8% of women with births (104) in Springville are married. The highest percentage of unmarried women with births falls into 20 to 34 years age bracket with 38.2% of them unmarried at the time of birth, while the lowest percentage of unmarried women with births belong to 35 to 50 years age bracket with 0.0% of them unmarried.
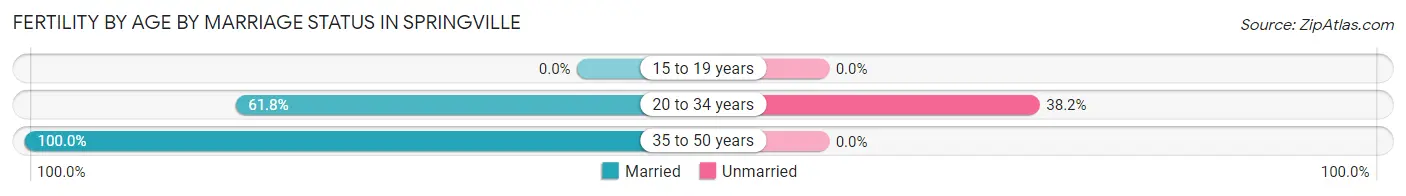
| Age Bracket | Married | Unmarried |
| 15 to 19 years | 0 (0.0%) | 0 (0.0%) |
| 20 to 34 years | 34 (61.8%) | 21 (38.2%) |
| 35 to 50 years | 49 (100.0%) | 0 (0.0%) |
| Total | 83 (79.8%) | 21 (20.2%) |
Fertility by Education in Springville
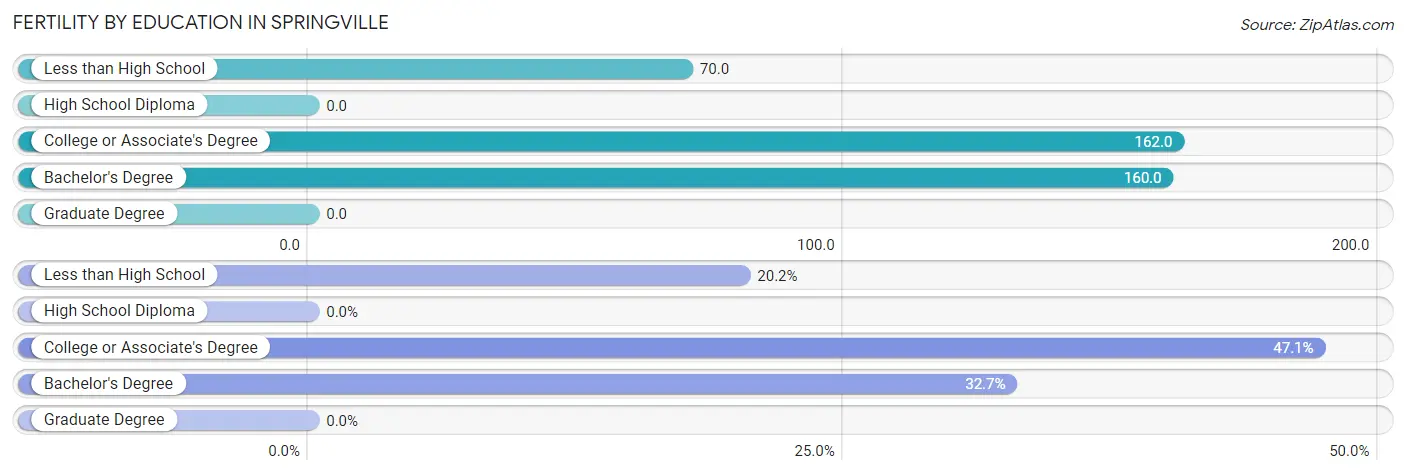
| Educational Attainment | Women with Births | Births / 1,000 Women |
| Less than High School | 21 (20.2%) | 70.0 |
| High School Diploma | 0 (0.0%) | 0.0 |
| College or Associate's Degree | 49 (47.1%) | 162.0 |
| Bachelor's Degree | 34 (32.7%) | 160.0 |
| Graduate Degree | 0 (0.0%) | 0.0 |
| Total | 104 (100.0%) | 109.0 |
Fertility by Education by Marriage Status in Springville
20.2% of women with births in Springville are unmarried. Women with the educational attainment of college or associate's degree are most likely to be married with 100.0% of them married at childbirth, while women with the educational attainment of less than high school are least likely to be married with 100.0% of them unmarried at childbirth.
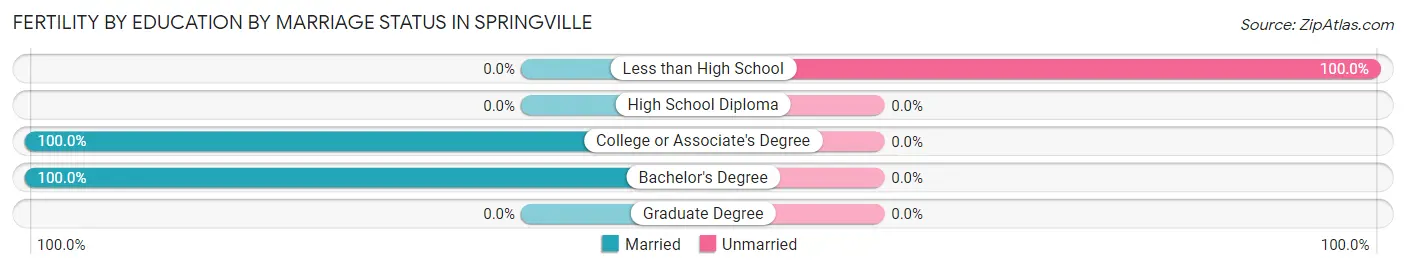
| Educational Attainment | Married | Unmarried |
| Less than High School | 0 (0.0%) | 21 (100.0%) |
| High School Diploma | 0 (0.0%) | 0 (0.0%) |
| College or Associate's Degree | 49 (100.0%) | 0 (0.0%) |
| Bachelor's Degree | 34 (100.0%) | 0 (0.0%) |
| Graduate Degree | 0 (0.0%) | 0 (0.0%) |
| Total | 83 (79.8%) | 21 (20.2%) |
Employment Characteristics in Springville
Employment by Class of Employer in Springville
Among the 2,106 employed individuals in Springville, private company employees (1,178 | 55.9%), local government employees (244 | 11.6%), and not-for-profit organizations (206 | 9.8%) make up the most common classes of employment.
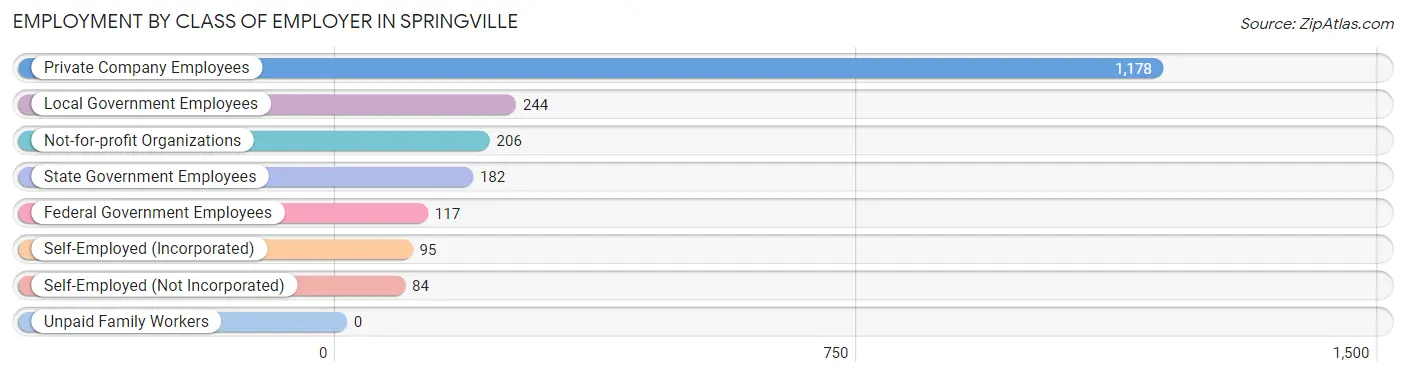
| Employer Class | # Employees | % Employees |
| Private Company Employees | 1,178 | 55.9% |
| Self-Employed (Incorporated) | 95 | 4.5% |
| Self-Employed (Not Incorporated) | 84 | 4.0% |
| Not-for-profit Organizations | 206 | 9.8% |
| Local Government Employees | 244 | 11.6% |
| State Government Employees | 182 | 8.6% |
| Federal Government Employees | 117 | 5.6% |
| Unpaid Family Workers | 0 | 0.0% |
| Total | 2,106 | 100.0% |
Employment Status by Age in Springville
According to the labor force statistics for Springville, out of the total population over 16 years of age (3,965), 53.9% or 2,137 individuals are in the labor force, with 1.5% or 32 of them unemployed. The age group with the highest labor force participation rate is 35 to 44 years, with 100.0% or 517 individuals in the labor force. Within the labor force, the 25 to 29 years age range has the highest percentage of unemployed individuals, with 9.1% or 23 of them being unemployed.
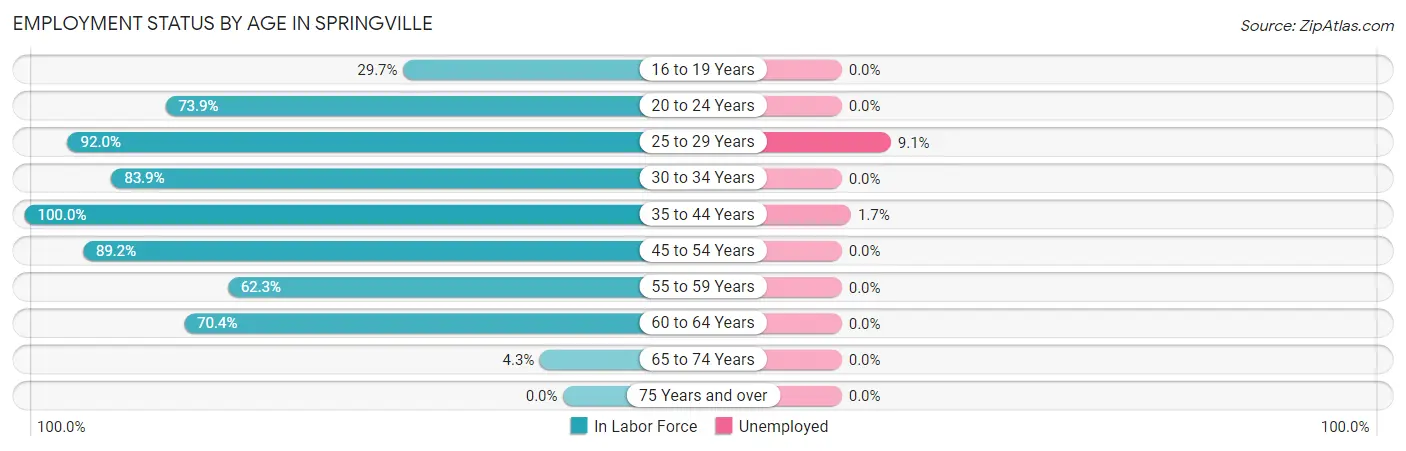
| Age Bracket | In Labor Force | Unemployed |
| 16 to 19 Years | 89 (29.7%) | 0 (0.0%) |
| 20 to 24 Years | 116 (73.9%) | 0 (0.0%) |
| 25 to 29 Years | 252 (92.0%) | 23 (9.1%) |
| 30 to 34 Years | 115 (83.9%) | 0 (0.0%) |
| 35 to 44 Years | 517 (100.0%) | 9 (1.7%) |
| 45 to 54 Years | 519 (89.2%) | 0 (0.0%) |
| 55 to 59 Years | 266 (62.3%) | 0 (0.0%) |
| 60 to 64 Years | 233 (70.4%) | 0 (0.0%) |
| 65 to 74 Years | 31 (4.3%) | 0 (0.0%) |
| 75 Years and over | 0 (0.0%) | 0 (0.0%) |
| Total | 2,137 (53.9%) | 32 (1.5%) |
Employment Status by Educational Attainment in Springville
According to labor force statistics for Springville, 83.9% of individuals (1,903) out of the total population between 25 and 64 years of age (2,268) are in the labor force, with 1.7% or 32 of them being unemployed. The group with the highest labor force participation rate are those with the educational attainment of bachelor's degree or higher, with 93.9% or 596 individuals in the labor force. Within the labor force, individuals with college / associate degree education have the highest percentage of unemployment, with 2.9% or 23 of them being unemployed.
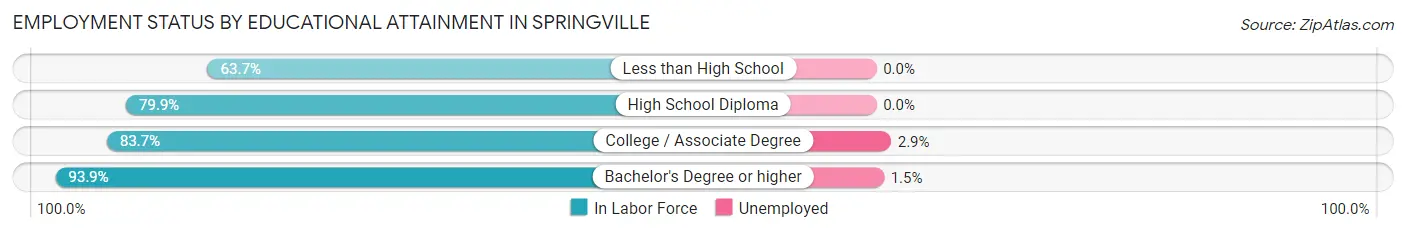
| Educational Attainment | In Labor Force | Unemployed |
| Less than High School | 137 (63.7%) | 0 (0.0%) |
| High School Diploma | 365 (79.9%) | 0 (0.0%) |
| College / Associate Degree | 804 (83.7%) | 28 (2.9%) |
| Bachelor's Degree or higher | 596 (93.9%) | 10 (1.5%) |
| Total | 1,903 (83.9%) | 39 (1.7%) |
Employment Occupations by Sex in Springville
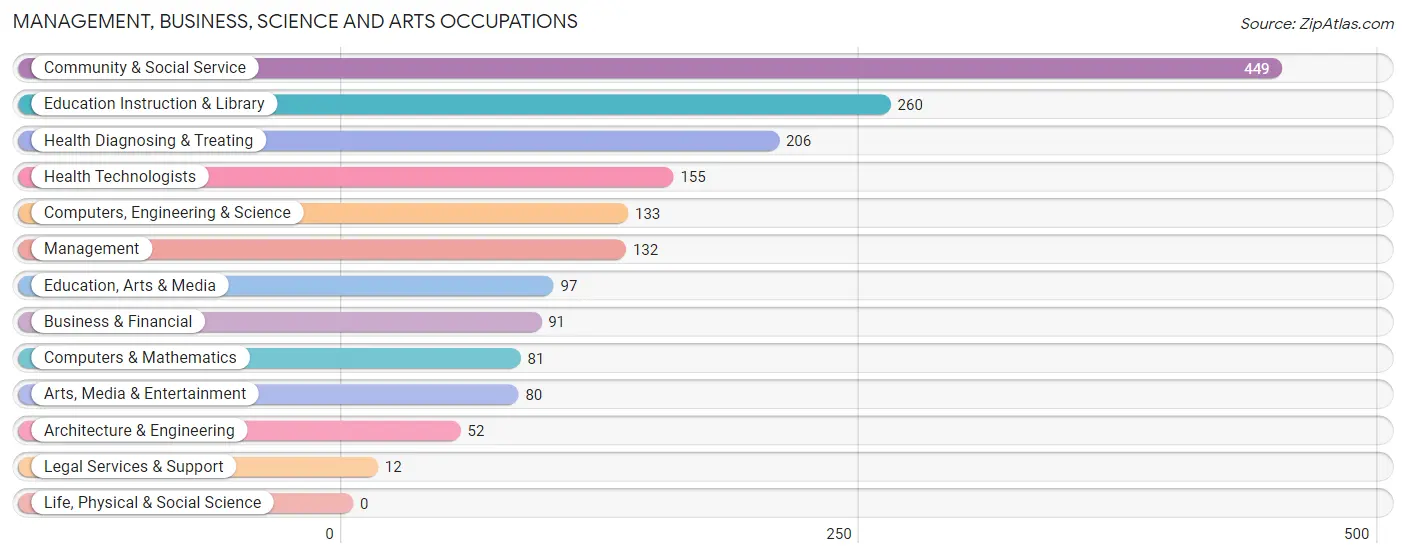
Management, Business, Science and Arts Occupations
The most common Management, Business, Science and Arts occupations in Springville are Community & Social Service (449 | 21.3%), Education Instruction & Library (260 | 12.3%), Health Diagnosing & Treating (206 | 9.8%), Health Technologists (155 | 7.4%), and Computers, Engineering & Science (133 | 6.3%).
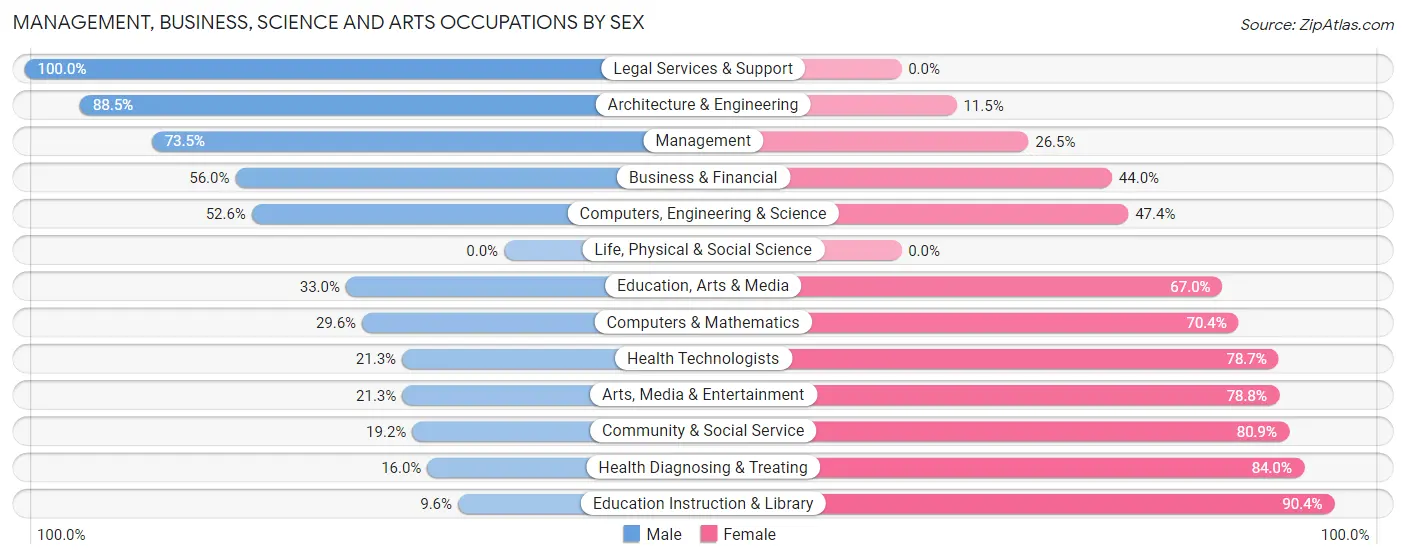
Management, Business, Science and Arts Occupations by Sex
Within the Management, Business, Science and Arts occupations in Springville, the most male-oriented occupations are Legal Services & Support (100.0%), Architecture & Engineering (88.5%), and Management (73.5%), while the most female-oriented occupations are Education Instruction & Library (90.4%), Health Diagnosing & Treating (84.0%), and Community & Social Service (80.8%).
| Occupation | Male | Female |
| Management | 97 (73.5%) | 35 (26.5%) |
| Business & Financial | 51 (56.0%) | 40 (44.0%) |
| Computers, Engineering & Science | 70 (52.6%) | 63 (47.4%) |
| Computers & Mathematics | 24 (29.6%) | 57 (70.4%) |
| Architecture & Engineering | 46 (88.5%) | 6 (11.5%) |
| Life, Physical & Social Science | 0 (0.0%) | 0 (0.0%) |
| Community & Social Service | 86 (19.2%) | 363 (80.8%) |
| Education, Arts & Media | 32 (33.0%) | 65 (67.0%) |
| Legal Services & Support | 12 (100.0%) | 0 (0.0%) |
| Education Instruction & Library | 25 (9.6%) | 235 (90.4%) |
| Arts, Media & Entertainment | 17 (21.2%) | 63 (78.7%) |
| Health Diagnosing & Treating | 33 (16.0%) | 173 (84.0%) |
| Health Technologists | 33 (21.3%) | 122 (78.7%) |
| Total (Category) | 337 (33.3%) | 674 (66.7%) |
| Total (Overall) | 934 (44.4%) | 1,172 (55.6%) |
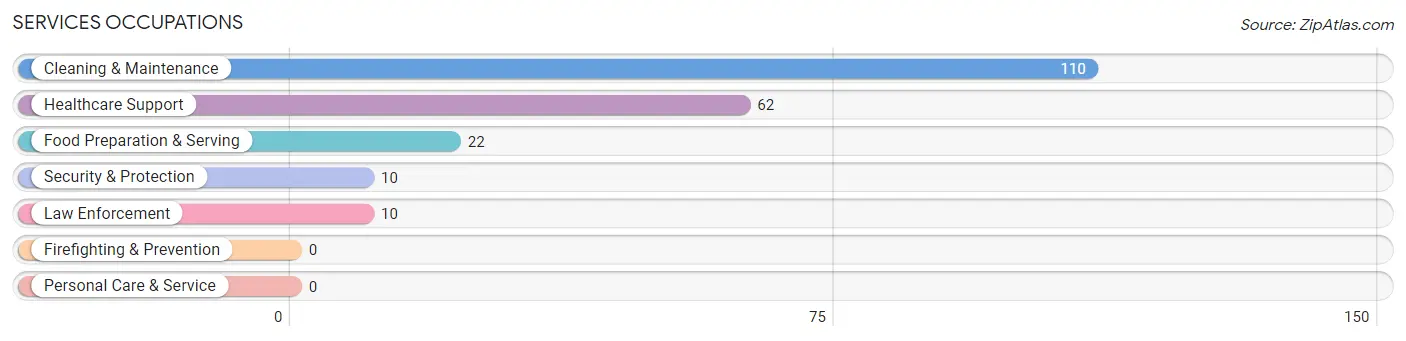
Services Occupations
The most common Services occupations in Springville are Cleaning & Maintenance (110 | 5.2%), Healthcare Support (62 | 2.9%), Food Preparation & Serving (22 | 1.0%), Security & Protection (10 | 0.5%), and Law Enforcement (10 | 0.5%).
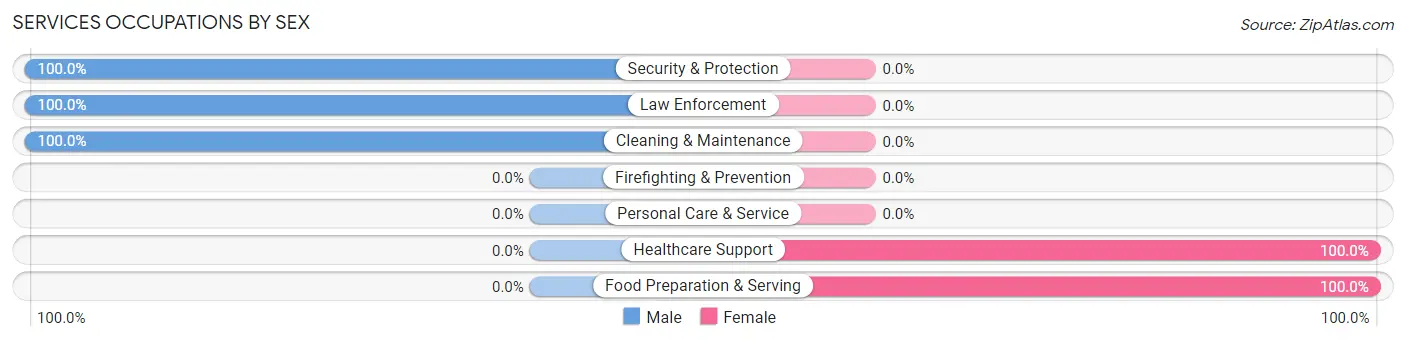
Services Occupations by Sex
Within the Services occupations in Springville, the most male-oriented occupations are Security & Protection (100.0%), Law Enforcement (100.0%), and Cleaning & Maintenance (100.0%), while the most female-oriented occupations are Healthcare Support (100.0%), and Food Preparation & Serving (100.0%).
| Occupation | Male | Female |
| Healthcare Support | 0 (0.0%) | 62 (100.0%) |
| Security & Protection | 10 (100.0%) | 0 (0.0%) |
| Firefighting & Prevention | 0 (0.0%) | 0 (0.0%) |
| Law Enforcement | 10 (100.0%) | 0 (0.0%) |
| Food Preparation & Serving | 0 (0.0%) | 22 (100.0%) |
| Cleaning & Maintenance | 110 (100.0%) | 0 (0.0%) |
| Personal Care & Service | 0 (0.0%) | 0 (0.0%) |
| Total (Category) | 120 (58.8%) | 84 (41.2%) |
| Total (Overall) | 934 (44.4%) | 1,172 (55.6%) |
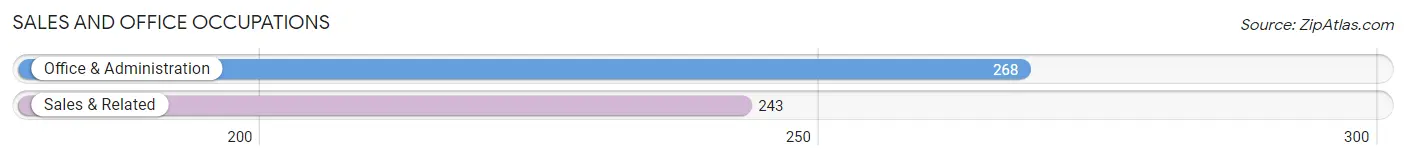
Sales and Office Occupations
The most common Sales and Office occupations in Springville are Office & Administration (268 | 12.7%), and Sales & Related (243 | 11.5%).
Sales and Office Occupations by Sex
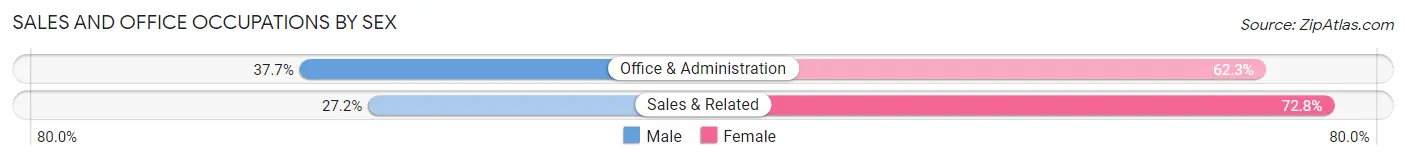
| Occupation | Male | Female |
| Sales & Related | 66 (27.2%) | 177 (72.8%) |
| Office & Administration | 101 (37.7%) | 167 (62.3%) |
| Total (Category) | 167 (32.7%) | 344 (67.3%) |
| Total (Overall) | 934 (44.4%) | 1,172 (55.6%) |
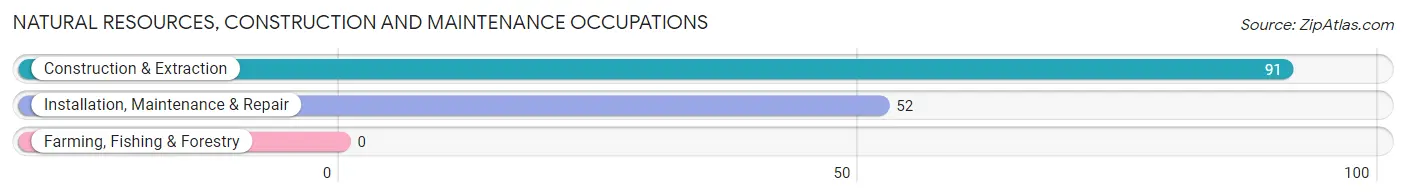
Natural Resources, Construction and Maintenance Occupations
The most common Natural Resources, Construction and Maintenance occupations in Springville are Construction & Extraction (91 | 4.3%), and Installation, Maintenance & Repair (52 | 2.5%).
Natural Resources, Construction and Maintenance Occupations by Sex
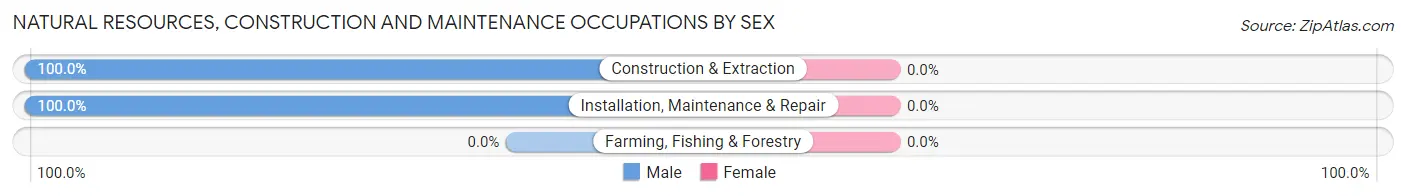
| Occupation | Male | Female |
| Farming, Fishing & Forestry | 0 (0.0%) | 0 (0.0%) |
| Construction & Extraction | 91 (100.0%) | 0 (0.0%) |
| Installation, Maintenance & Repair | 52 (100.0%) | 0 (0.0%) |
| Total (Category) | 143 (100.0%) | 0 (0.0%) |
| Total (Overall) | 934 (44.4%) | 1,172 (55.6%) |
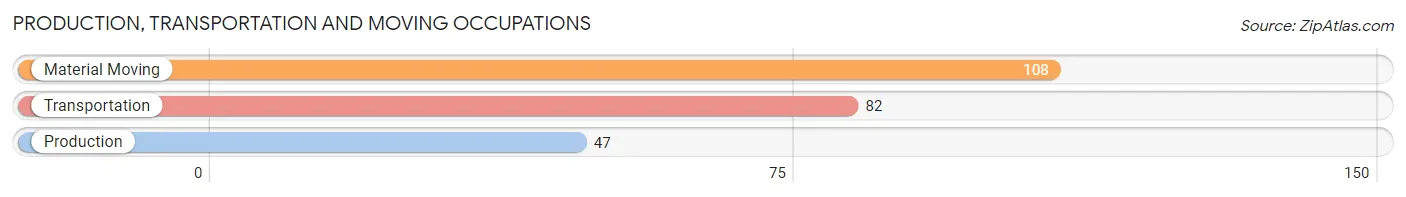
Production, Transportation and Moving Occupations
The most common Production, Transportation and Moving occupations in Springville are Material Moving (108 | 5.1%), Transportation (82 | 3.9%), and Production (47 | 2.2%).
Production, Transportation and Moving Occupations by Sex
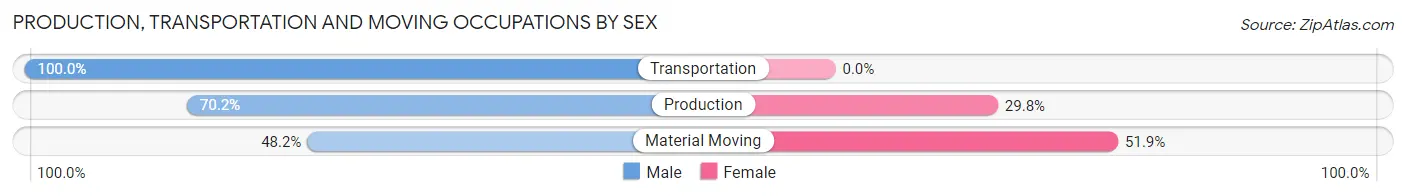
| Occupation | Male | Female |
| Production | 33 (70.2%) | 14 (29.8%) |
| Transportation | 82 (100.0%) | 0 (0.0%) |
| Material Moving | 52 (48.1%) | 56 (51.8%) |
| Total (Category) | 167 (70.5%) | 70 (29.5%) |
| Total (Overall) | 934 (44.4%) | 1,172 (55.6%) |
Employment Industries by Sex in Springville
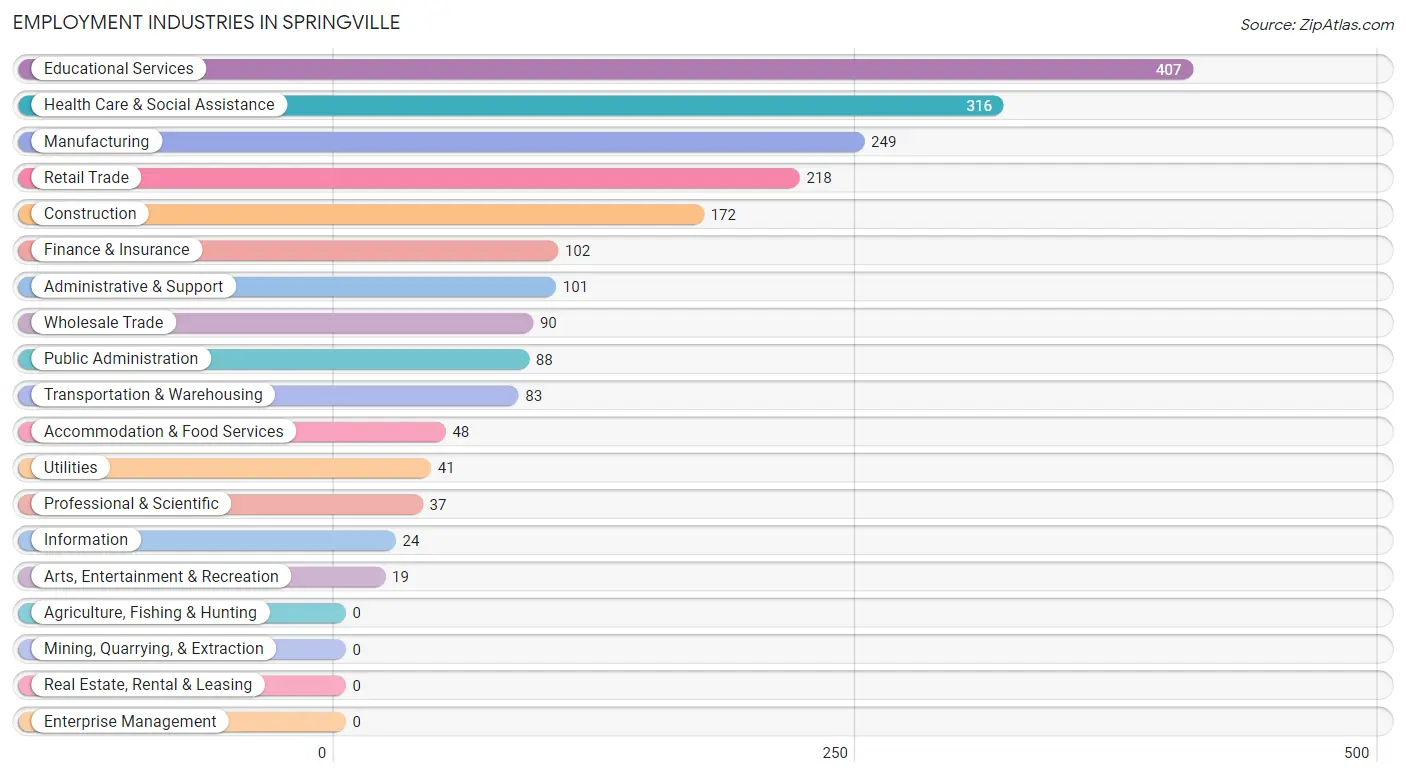
Employment Industries in Springville
The major employment industries in Springville include Educational Services (407 | 19.3%), Health Care & Social Assistance (316 | 15.0%), Manufacturing (249 | 11.8%), Retail Trade (218 | 10.3%), and Construction (172 | 8.2%).
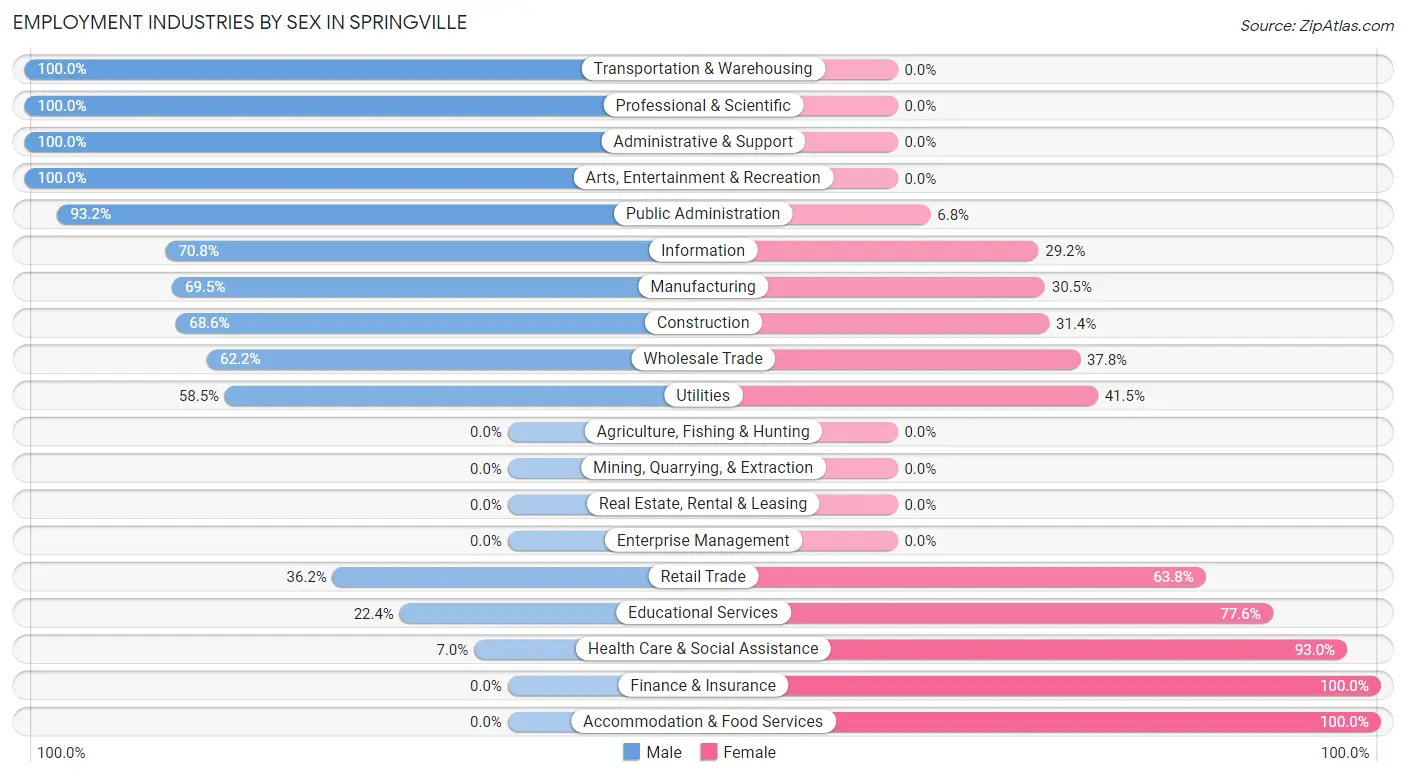
Employment Industries by Sex in Springville
The Springville industries that see more men than women are Transportation & Warehousing (100.0%), Professional & Scientific (100.0%), and Administrative & Support (100.0%), whereas the industries that tend to have a higher number of women are Finance & Insurance (100.0%), Accommodation & Food Services (100.0%), and Health Care & Social Assistance (93.0%).
| Industry | Male | Female |
| Agriculture, Fishing & Hunting | 0 (0.0%) | 0 (0.0%) |
| Mining, Quarrying, & Extraction | 0 (0.0%) | 0 (0.0%) |
| Construction | 118 (68.6%) | 54 (31.4%) |
| Manufacturing | 173 (69.5%) | 76 (30.5%) |
| Wholesale Trade | 56 (62.2%) | 34 (37.8%) |
| Retail Trade | 79 (36.2%) | 139 (63.8%) |
| Transportation & Warehousing | 83 (100.0%) | 0 (0.0%) |
| Utilities | 24 (58.5%) | 17 (41.5%) |
| Information | 17 (70.8%) | 7 (29.2%) |
| Finance & Insurance | 0 (0.0%) | 102 (100.0%) |
| Real Estate, Rental & Leasing | 0 (0.0%) | 0 (0.0%) |
| Professional & Scientific | 37 (100.0%) | 0 (0.0%) |
| Enterprise Management | 0 (0.0%) | 0 (0.0%) |
| Administrative & Support | 101 (100.0%) | 0 (0.0%) |
| Educational Services | 91 (22.4%) | 316 (77.6%) |
| Health Care & Social Assistance | 22 (7.0%) | 294 (93.0%) |
| Arts, Entertainment & Recreation | 19 (100.0%) | 0 (0.0%) |
| Accommodation & Food Services | 0 (0.0%) | 48 (100.0%) |
| Public Administration | 82 (93.2%) | 6 (6.8%) |
| Total | 934 (44.4%) | 1,172 (55.6%) |
Education in Springville
School Enrollment in Springville
The most common levels of schooling among the 1,202 students in Springville are high school (397 | 33.0%), middle school (327 | 27.2%), and elementary school (185 | 15.4%).
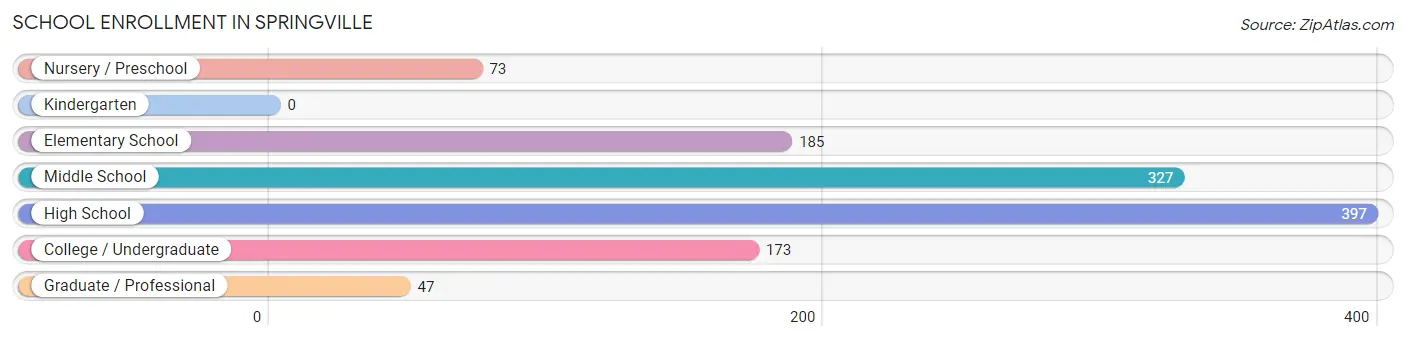
| School Level | # Students | % Students |
| Nursery / Preschool | 73 | 6.1% |
| Kindergarten | 0 | 0.0% |
| Elementary School | 185 | 15.4% |
| Middle School | 327 | 27.2% |
| High School | 397 | 33.0% |
| College / Undergraduate | 173 | 14.4% |
| Graduate / Professional | 47 | 3.9% |
| Total | 1,202 | 100.0% |
School Enrollment by Age by Funding Source in Springville
Out of a total of 1,202 students who are enrolled in schools in Springville, 113 (9.4%) attend a private institution, while the remaining 1,089 (90.6%) are enrolled in public schools. The age group of 3 to 4 year olds has the highest likelihood of being enrolled in private schools, with 59 (89.4% in the age bracket) enrolled. Conversely, the age group of 10 to 14 year olds has the lowest likelihood of being enrolled in a private school, with 353 (100.0% in the age bracket) attending a public institution.
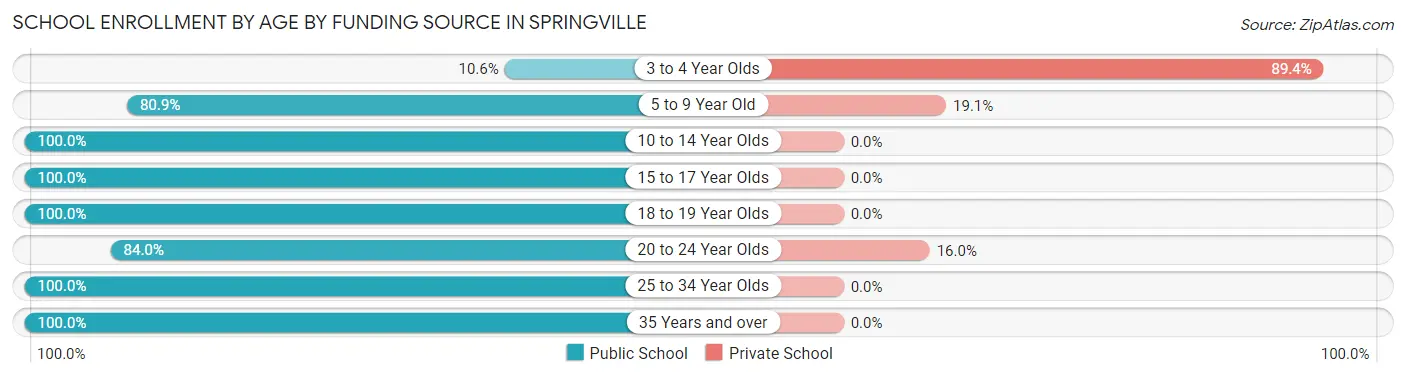
| Age Bracket | Public School | Private School |
| 3 to 4 Year Olds | 7 (10.6%) | 59 (89.4%) |
| 5 to 9 Year Old | 140 (80.9%) | 33 (19.1%) |
| 10 to 14 Year Olds | 353 (100.0%) | 0 (0.0%) |
| 15 to 17 Year Olds | 288 (100.0%) | 0 (0.0%) |
| 18 to 19 Year Olds | 122 (100.0%) | 0 (0.0%) |
| 20 to 24 Year Olds | 110 (84.0%) | 21 (16.0%) |
| 25 to 34 Year Olds | 40 (100.0%) | 0 (0.0%) |
| 35 Years and over | 29 (100.0%) | 0 (0.0%) |
| Total | 1,089 (90.6%) | 113 (9.4%) |
Educational Attainment by Field of Study in Springville
Education (415 | 37.6%), engineering (128 | 11.6%), bio, nature & agricultural (112 | 10.1%), arts & humanities (99 | 9.0%), and business (80 | 7.2%) are the most common fields of study among 1,105 individuals in Springville who have obtained a bachelor's degree or higher.
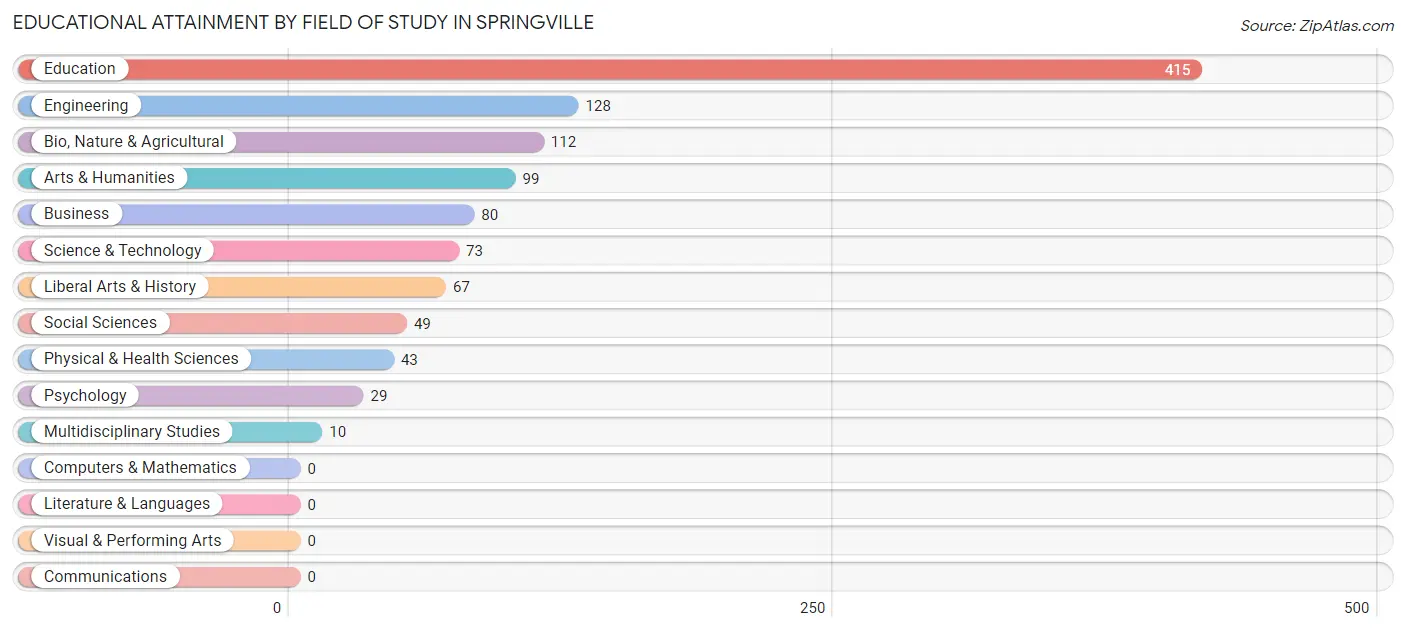
| Field of Study | # Graduates | % Graduates |
| Computers & Mathematics | 0 | 0.0% |
| Bio, Nature & Agricultural | 112 | 10.1% |
| Physical & Health Sciences | 43 | 3.9% |
| Psychology | 29 | 2.6% |
| Social Sciences | 49 | 4.4% |
| Engineering | 128 | 11.6% |
| Multidisciplinary Studies | 10 | 0.9% |
| Science & Technology | 73 | 6.6% |
| Business | 80 | 7.2% |
| Education | 415 | 37.6% |
| Literature & Languages | 0 | 0.0% |
| Liberal Arts & History | 67 | 6.1% |
| Visual & Performing Arts | 0 | 0.0% |
| Communications | 0 | 0.0% |
| Arts & Humanities | 99 | 9.0% |
| Total | 1,105 | 100.0% |
Transportation & Commute in Springville
Vehicle Availability by Sex in Springville
The most prevalent vehicle ownership categories in Springville are males with 3 vehicles (370, accounting for 39.6%) and females with 3 vehicles (499, making up 31.6%).
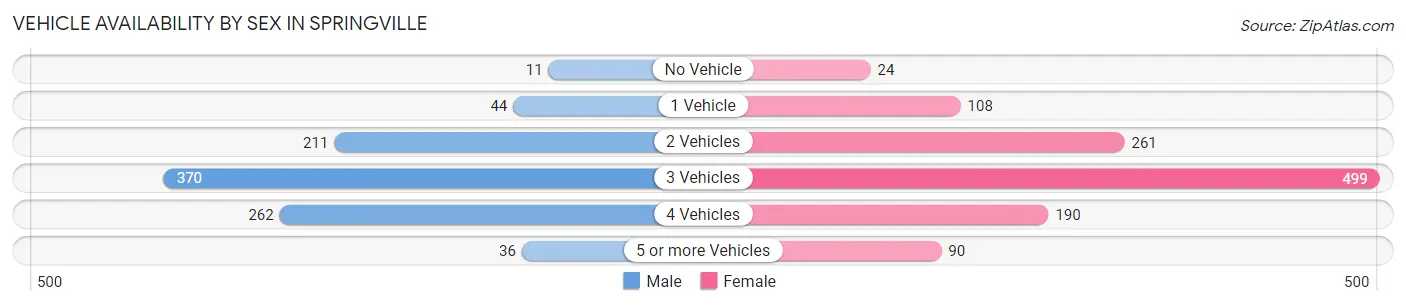
| Vehicles Available | Male | Female |
| No Vehicle | 11 (1.2%) | 24 (2.1%) |
| 1 Vehicle | 44 (4.7%) | 108 (9.2%) |
| 2 Vehicles | 211 (22.6%) | 261 (22.3%) |
| 3 Vehicles | 370 (39.6%) | 499 (42.6%) |
| 4 Vehicles | 262 (28.1%) | 190 (16.2%) |
| 5 or more Vehicles | 36 (3.8%) | 90 (7.7%) |
| Total | 934 (100.0%) | 1,172 (100.0%) |
Commute Time in Springville
The most frequently occuring commute durations in Springville are 30 to 34 minutes (441 commuters, 22.3%), 45 to 59 minutes (406 commuters, 20.5%), and 40 to 44 minutes (245 commuters, 12.4%).
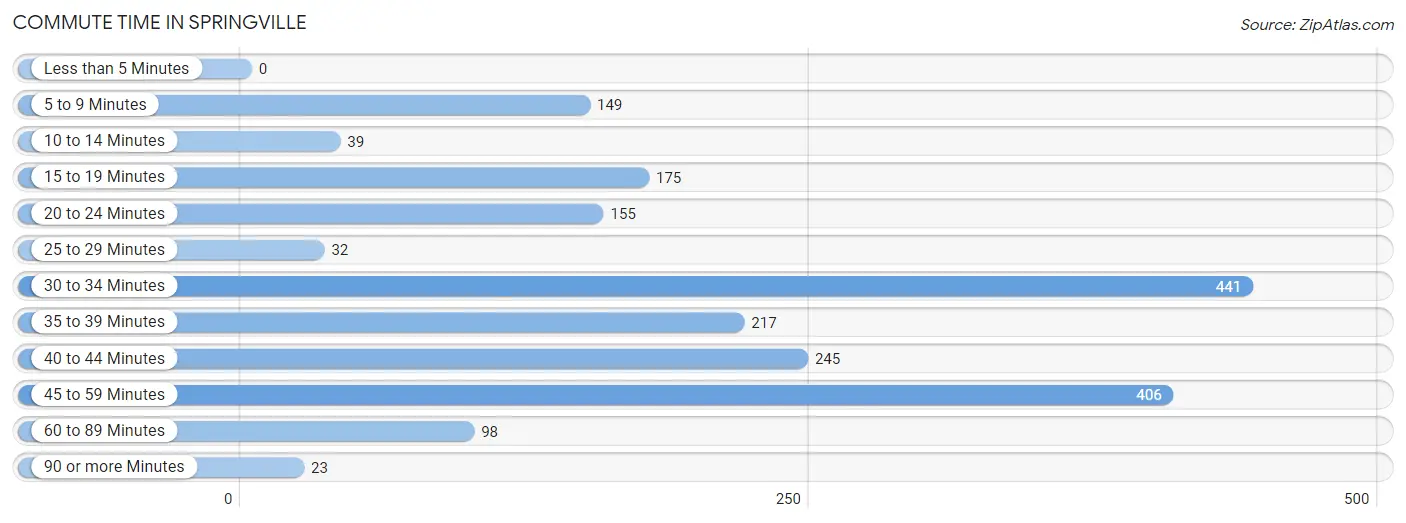
| Commute Time | # Commuters | % Commuters |
| Less than 5 Minutes | 0 | 0.0% |
| 5 to 9 Minutes | 149 | 7.5% |
| 10 to 14 Minutes | 39 | 2.0% |
| 15 to 19 Minutes | 175 | 8.8% |
| 20 to 24 Minutes | 155 | 7.8% |
| 25 to 29 Minutes | 32 | 1.6% |
| 30 to 34 Minutes | 441 | 22.3% |
| 35 to 39 Minutes | 217 | 11.0% |
| 40 to 44 Minutes | 245 | 12.4% |
| 45 to 59 Minutes | 406 | 20.5% |
| 60 to 89 Minutes | 98 | 5.0% |
| 90 or more Minutes | 23 | 1.2% |
Commute Time by Sex in Springville
The most common commute times in Springville are 30 to 34 minutes (288 commuters, 32.0%) for males and 45 to 59 minutes (336 commuters, 31.1%) for females.
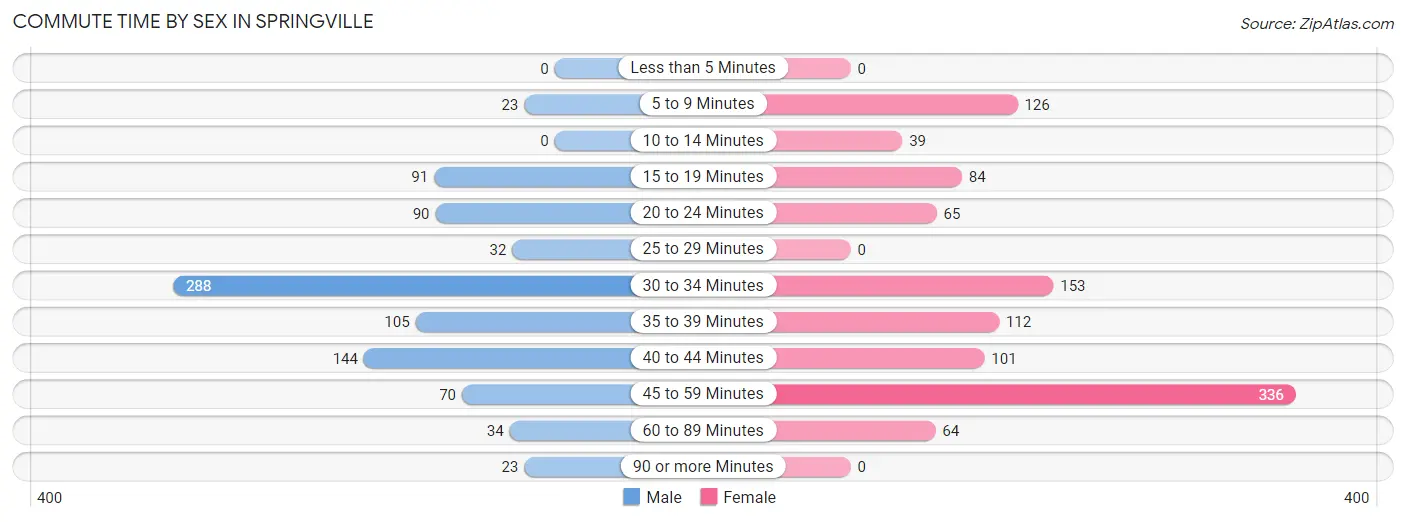
| Commute Time | Male | Female |
| Less than 5 Minutes | 0 (0.0%) | 0 (0.0%) |
| 5 to 9 Minutes | 23 (2.6%) | 126 (11.7%) |
| 10 to 14 Minutes | 0 (0.0%) | 39 (3.6%) |
| 15 to 19 Minutes | 91 (10.1%) | 84 (7.8%) |
| 20 to 24 Minutes | 90 (10.0%) | 65 (6.0%) |
| 25 to 29 Minutes | 32 (3.6%) | 0 (0.0%) |
| 30 to 34 Minutes | 288 (32.0%) | 153 (14.2%) |
| 35 to 39 Minutes | 105 (11.7%) | 112 (10.4%) |
| 40 to 44 Minutes | 144 (16.0%) | 101 (9.3%) |
| 45 to 59 Minutes | 70 (7.8%) | 336 (31.1%) |
| 60 to 89 Minutes | 34 (3.8%) | 64 (5.9%) |
| 90 or more Minutes | 23 (2.6%) | 0 (0.0%) |
Time of Departure to Work by Sex in Springville
The most frequent times of departure to work in Springville are 6:30 AM to 6:59 AM (181, 20.1%) for males and 7:00 AM to 7:29 AM (275, 25.5%) for females.
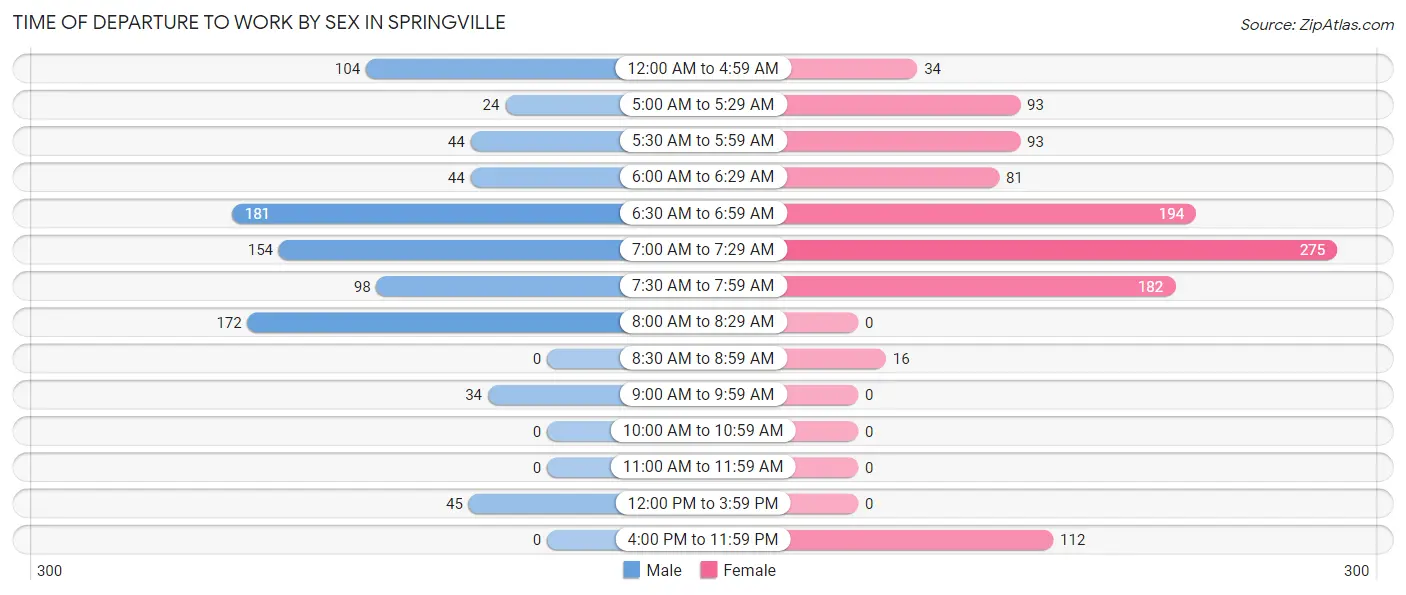
| Time of Departure | Male | Female |
| 12:00 AM to 4:59 AM | 104 (11.6%) | 34 (3.2%) |
| 5:00 AM to 5:29 AM | 24 (2.7%) | 93 (8.6%) |
| 5:30 AM to 5:59 AM | 44 (4.9%) | 93 (8.6%) |
| 6:00 AM to 6:29 AM | 44 (4.9%) | 81 (7.5%) |
| 6:30 AM to 6:59 AM | 181 (20.1%) | 194 (18.0%) |
| 7:00 AM to 7:29 AM | 154 (17.1%) | 275 (25.5%) |
| 7:30 AM to 7:59 AM | 98 (10.9%) | 182 (16.9%) |
| 8:00 AM to 8:29 AM | 172 (19.1%) | 0 (0.0%) |
| 8:30 AM to 8:59 AM | 0 (0.0%) | 16 (1.5%) |
| 9:00 AM to 9:59 AM | 34 (3.8%) | 0 (0.0%) |
| 10:00 AM to 10:59 AM | 0 (0.0%) | 0 (0.0%) |
| 11:00 AM to 11:59 AM | 0 (0.0%) | 0 (0.0%) |
| 12:00 PM to 3:59 PM | 45 (5.0%) | 0 (0.0%) |
| 4:00 PM to 11:59 PM | 0 (0.0%) | 112 (10.4%) |
| Total | 900 (100.0%) | 1,080 (100.0%) |
Housing Occupancy in Springville
Occupancy by Ownership in Springville
Of the total 1,871 dwellings in Springville, owner-occupied units account for 1,648 (88.1%), while renter-occupied units make up 223 (11.9%).
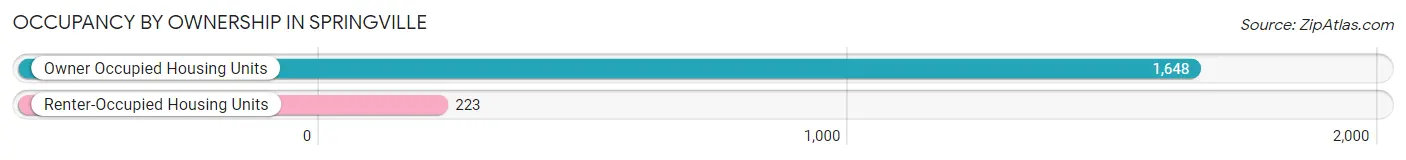
| Occupancy | # Housing Units | % Housing Units |
| Owner Occupied Housing Units | 1,648 | 88.1% |
| Renter-Occupied Housing Units | 223 | 11.9% |
| Total Occupied Housing Units | 1,871 | 100.0% |
Occupancy by Household Size in Springville
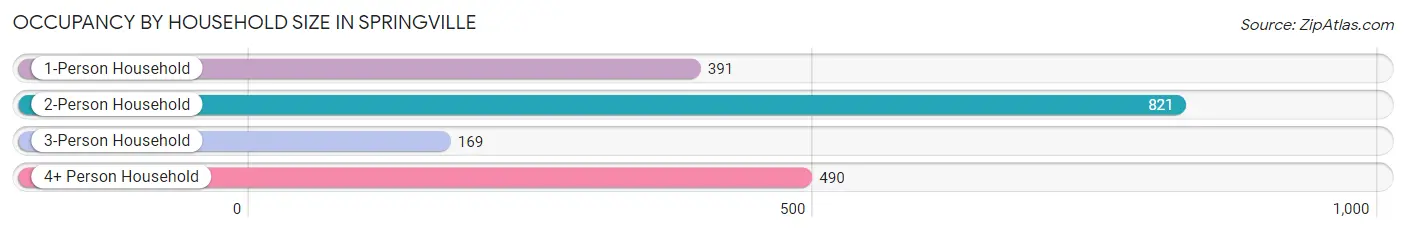
| Household Size | # Housing Units | % Housing Units |
| 1-Person Household | 391 | 20.9% |
| 2-Person Household | 821 | 43.9% |
| 3-Person Household | 169 | 9.0% |
| 4+ Person Household | 490 | 26.2% |
| Total Housing Units | 1,871 | 100.0% |
Occupancy by Ownership by Household Size in Springville
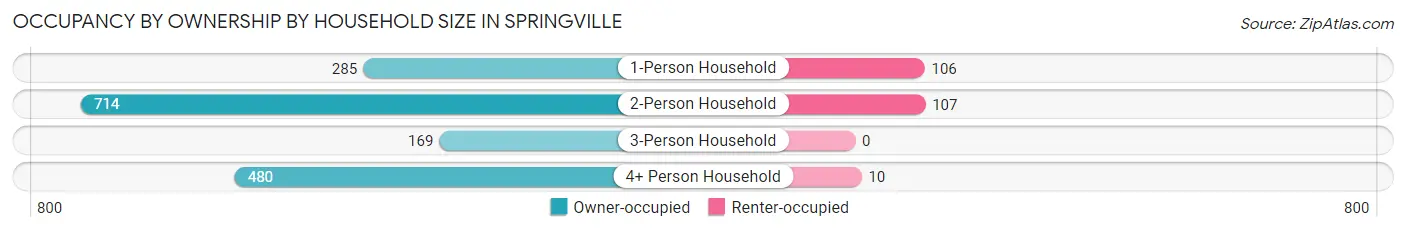
| Household Size | Owner-occupied | Renter-occupied |
| 1-Person Household | 285 (72.9%) | 106 (27.1%) |
| 2-Person Household | 714 (87.0%) | 107 (13.0%) |
| 3-Person Household | 169 (100.0%) | 0 (0.0%) |
| 4+ Person Household | 480 (98.0%) | 10 (2.0%) |
| Total Housing Units | 1,648 (88.1%) | 223 (11.9%) |
Occupancy by Educational Attainment in Springville
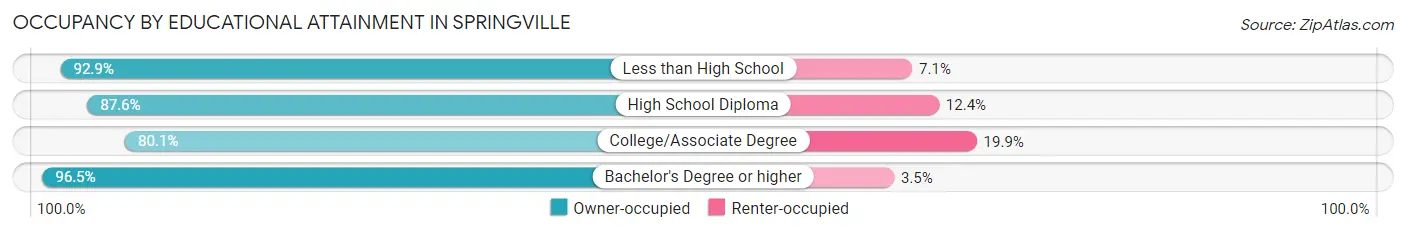
| Household Size | Owner-occupied | Renter-occupied |
| Less than High School | 130 (92.9%) | 10 (7.1%) |
| High School Diploma | 345 (87.6%) | 49 (12.4%) |
| College/Associate Degree | 571 (80.1%) | 142 (19.9%) |
| Bachelor's Degree or higher | 602 (96.5%) | 22 (3.5%) |
Occupancy by Age of Householder in Springville
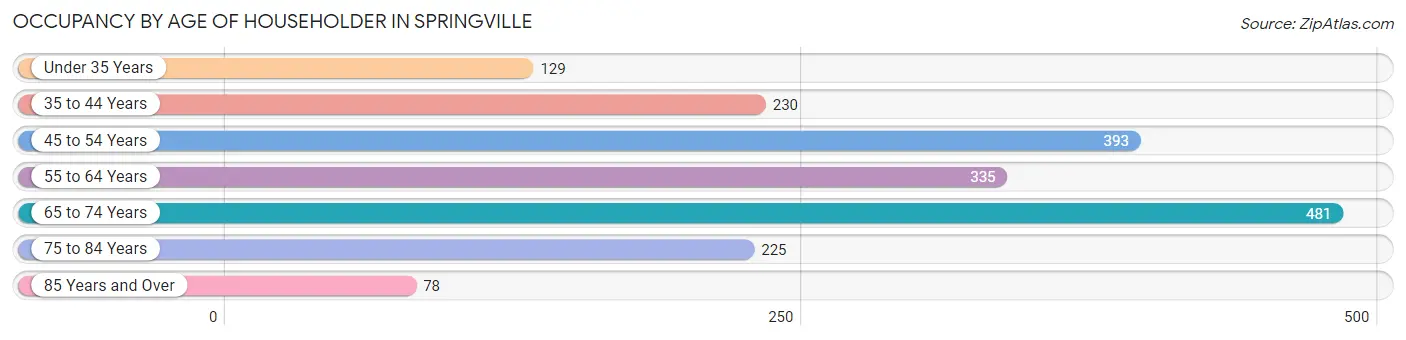
| Age Bracket | # Households | % Households |
| Under 35 Years | 129 | 6.9% |
| 35 to 44 Years | 230 | 12.3% |
| 45 to 54 Years | 393 | 21.0% |
| 55 to 64 Years | 335 | 17.9% |
| 65 to 74 Years | 481 | 25.7% |
| 75 to 84 Years | 225 | 12.0% |
| 85 Years and Over | 78 | 4.2% |
| Total | 1,871 | 100.0% |
Housing Finances in Springville
Median Income by Occupancy in Springville
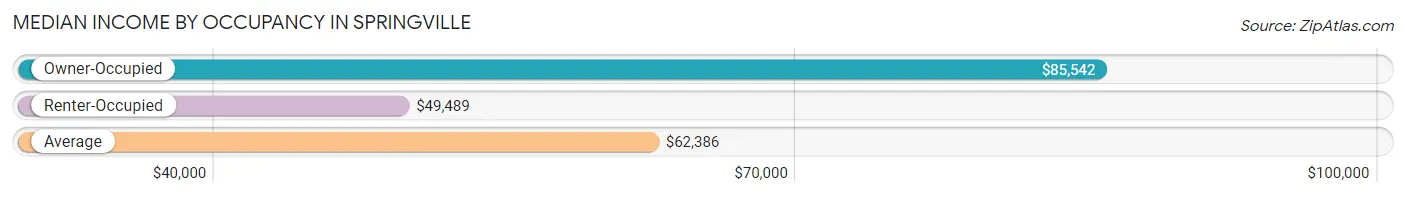
| Occupancy Type | # Households | Median Income |
| Owner-Occupied | 1,648 (88.1%) | $85,542 |
| Renter-Occupied | 223 (11.9%) | $49,489 |
| Average | 1,871 (100.0%) | $62,386 |
Occupancy by Householder Income Bracket in Springville
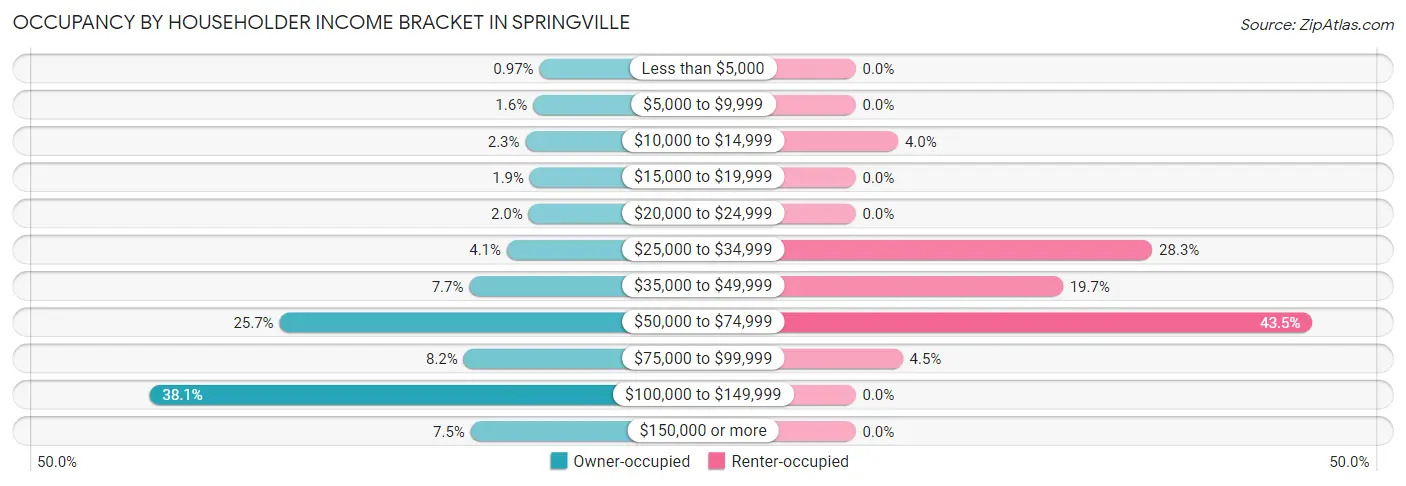
| Income Bracket | Owner-occupied | Renter-occupied |
| Less than $5,000 | 16 (1.0%) | 0 (0.0%) |
| $5,000 to $9,999 | 26 (1.6%) | 0 (0.0%) |
| $10,000 to $14,999 | 38 (2.3%) | 9 (4.0%) |
| $15,000 to $19,999 | 31 (1.9%) | 0 (0.0%) |
| $20,000 to $24,999 | 33 (2.0%) | 0 (0.0%) |
| $25,000 to $34,999 | 67 (4.1%) | 63 (28.2%) |
| $35,000 to $49,999 | 126 (7.6%) | 44 (19.7%) |
| $50,000 to $74,999 | 424 (25.7%) | 97 (43.5%) |
| $75,000 to $99,999 | 135 (8.2%) | 10 (4.5%) |
| $100,000 to $149,999 | 628 (38.1%) | 0 (0.0%) |
| $150,000 or more | 124 (7.5%) | 0 (0.0%) |
| Total | 1,648 (100.0%) | 223 (100.0%) |
Monthly Housing Cost Tiers in Springville
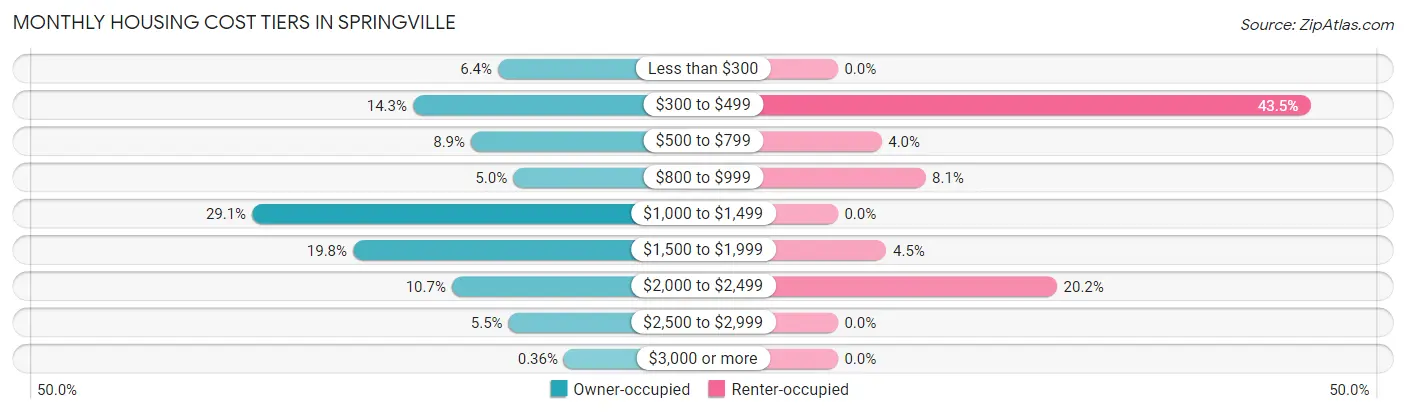
| Monthly Cost | Owner-occupied | Renter-occupied |
| Less than $300 | 106 (6.4%) | 0 (0.0%) |
| $300 to $499 | 235 (14.3%) | 97 (43.5%) |
| $500 to $799 | 147 (8.9%) | 9 (4.0%) |
| $800 to $999 | 83 (5.0%) | 18 (8.1%) |
| $1,000 to $1,499 | 479 (29.1%) | 0 (0.0%) |
| $1,500 to $1,999 | 326 (19.8%) | 10 (4.5%) |
| $2,000 to $2,499 | 176 (10.7%) | 45 (20.2%) |
| $2,500 to $2,999 | 90 (5.5%) | 0 (0.0%) |
| $3,000 or more | 6 (0.4%) | 0 (0.0%) |
| Total | 1,648 (100.0%) | 223 (100.0%) |
Physical Housing Characteristics in Springville
Housing Structures in Springville
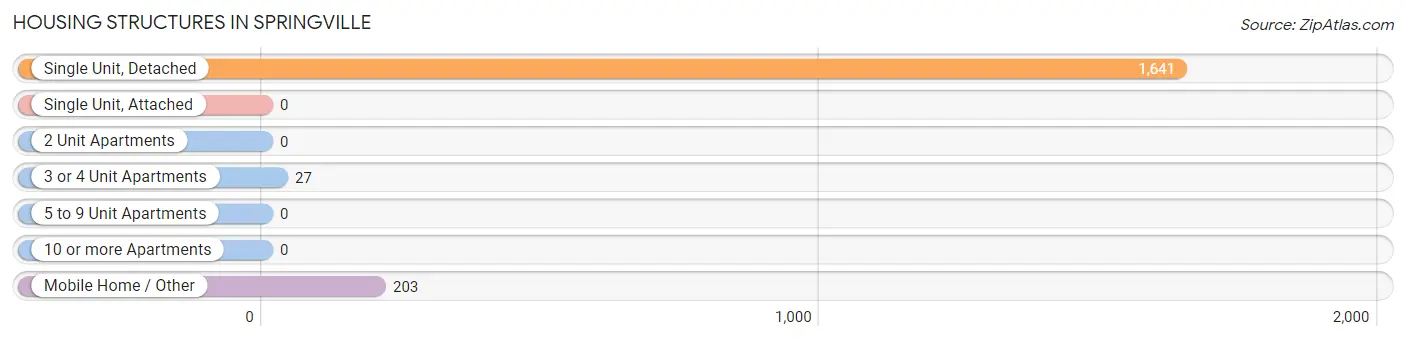
| Structure Type | # Housing Units | % Housing Units |
| Single Unit, Detached | 1,641 | 87.7% |
| Single Unit, Attached | 0 | 0.0% |
| 2 Unit Apartments | 0 | 0.0% |
| 3 or 4 Unit Apartments | 27 | 1.4% |
| 5 to 9 Unit Apartments | 0 | 0.0% |
| 10 or more Apartments | 0 | 0.0% |
| Mobile Home / Other | 203 | 10.8% |
| Total | 1,871 | 100.0% |
Housing Structures by Occupancy in Springville
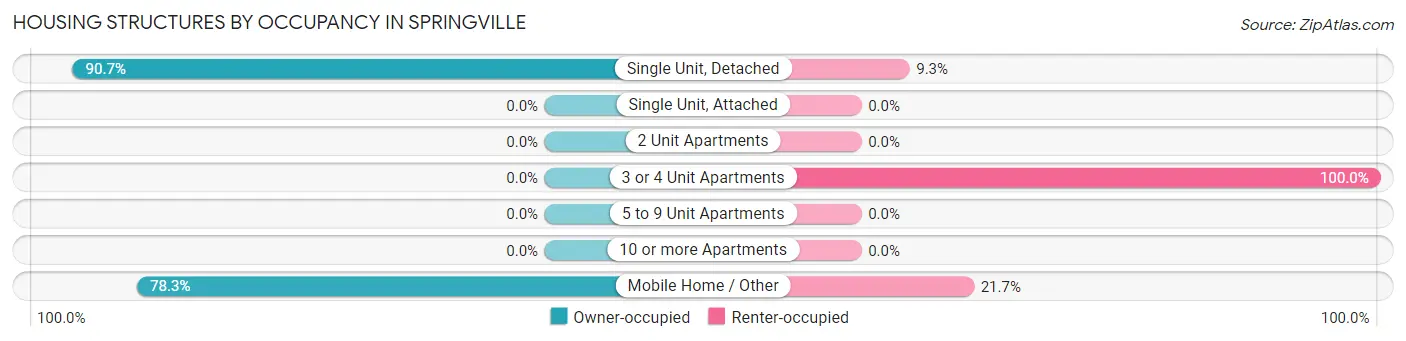
| Structure Type | Owner-occupied | Renter-occupied |
| Single Unit, Detached | 1,489 (90.7%) | 152 (9.3%) |
| Single Unit, Attached | 0 (0.0%) | 0 (0.0%) |
| 2 Unit Apartments | 0 (0.0%) | 0 (0.0%) |
| 3 or 4 Unit Apartments | 0 (0.0%) | 27 (100.0%) |
| 5 to 9 Unit Apartments | 0 (0.0%) | 0 (0.0%) |
| 10 or more Apartments | 0 (0.0%) | 0 (0.0%) |
| Mobile Home / Other | 159 (78.3%) | 44 (21.7%) |
| Total | 1,648 (88.1%) | 223 (11.9%) |
Housing Structures by Number of Rooms in Springville
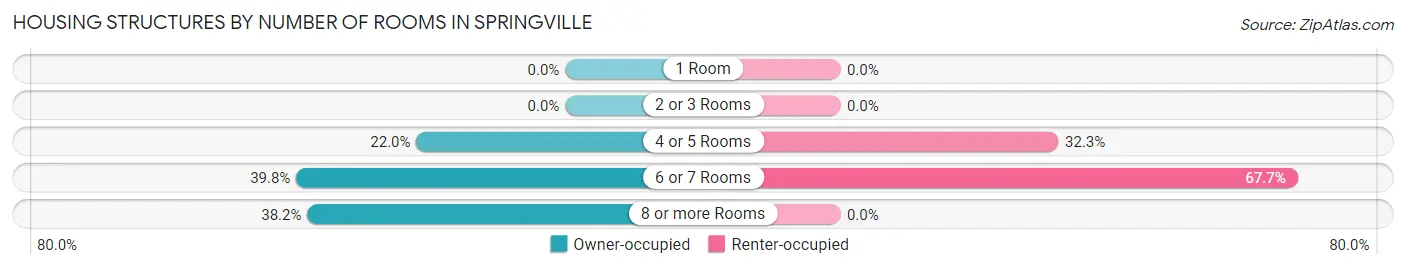
| Number of Rooms | Owner-occupied | Renter-occupied |
| 1 Room | 0 (0.0%) | 0 (0.0%) |
| 2 or 3 Rooms | 0 (0.0%) | 0 (0.0%) |
| 4 or 5 Rooms | 363 (22.0%) | 72 (32.3%) |
| 6 or 7 Rooms | 656 (39.8%) | 151 (67.7%) |
| 8 or more Rooms | 629 (38.2%) | 0 (0.0%) |
| Total | 1,648 (100.0%) | 223 (100.0%) |
Housing Structure by Heating Type in Springville
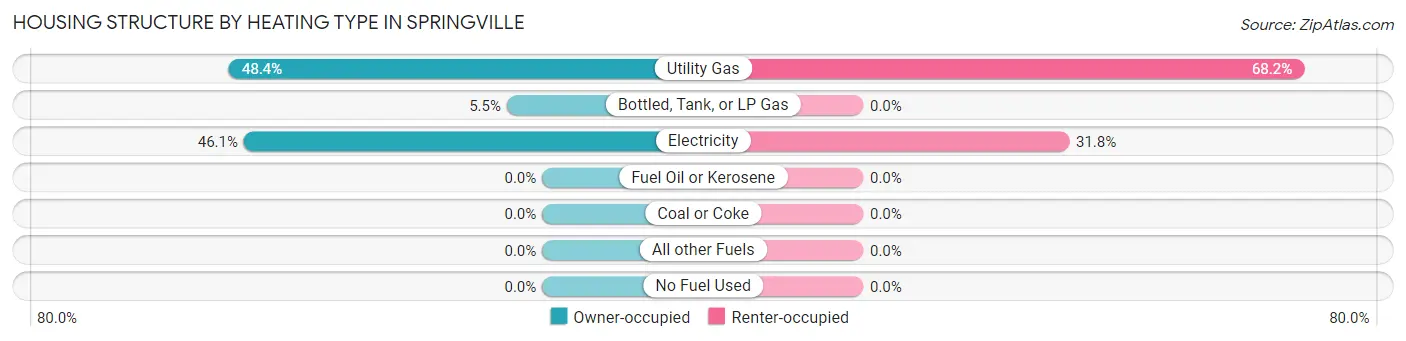
| Heating Type | Owner-occupied | Renter-occupied |
| Utility Gas | 798 (48.4%) | 152 (68.2%) |
| Bottled, Tank, or LP Gas | 90 (5.5%) | 0 (0.0%) |
| Electricity | 760 (46.1%) | 71 (31.8%) |
| Fuel Oil or Kerosene | 0 (0.0%) | 0 (0.0%) |
| Coal or Coke | 0 (0.0%) | 0 (0.0%) |
| All other Fuels | 0 (0.0%) | 0 (0.0%) |
| No Fuel Used | 0 (0.0%) | 0 (0.0%) |
| Total | 1,648 (100.0%) | 223 (100.0%) |
Household Vehicle Usage in Springville
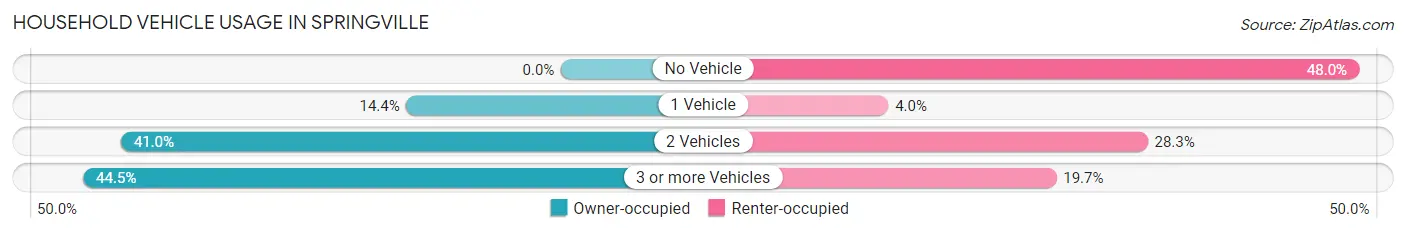
| Vehicles per Household | Owner-occupied | Renter-occupied |
| No Vehicle | 0 (0.0%) | 107 (48.0%) |
| 1 Vehicle | 238 (14.4%) | 9 (4.0%) |
| 2 Vehicles | 676 (41.0%) | 63 (28.2%) |
| 3 or more Vehicles | 734 (44.5%) | 44 (19.7%) |
| Total | 1,648 (100.0%) | 223 (100.0%) |
Real Estate & Mortgages in Springville
Real Estate and Mortgage Overview in Springville
| Characteristic | Without Mortgage | With Mortgage |
| Housing Units | 497 | 1,151 |
| Median Property Value | $139,400 | $273,200 |
| Median Household Income | $59,973 | $97 |
| Monthly Housing Costs | $451 | $6 |
| Real Estate Taxes | $526 | $110 |
Property Value by Mortgage Status in Springville
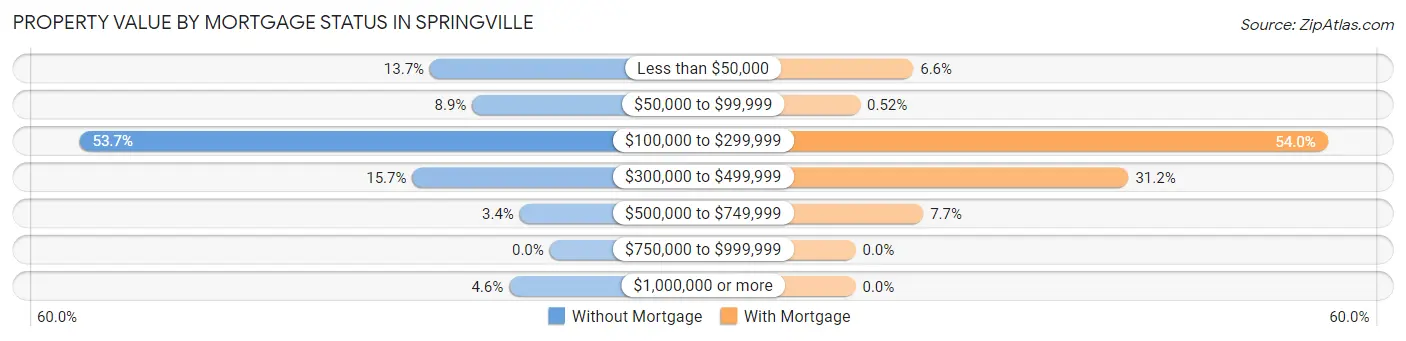
| Property Value | Without Mortgage | With Mortgage |
| Less than $50,000 | 68 (13.7%) | 76 (6.6%) |
| $50,000 to $99,999 | 44 (8.8%) | 6 (0.5%) |
| $100,000 to $299,999 | 267 (53.7%) | 621 (53.9%) |
| $300,000 to $499,999 | 78 (15.7%) | 359 (31.2%) |
| $500,000 to $749,999 | 17 (3.4%) | 89 (7.7%) |
| $750,000 to $999,999 | 0 (0.0%) | 0 (0.0%) |
| $1,000,000 or more | 23 (4.6%) | 0 (0.0%) |
| Total | 497 (100.0%) | 1,151 (100.0%) |
Household Income by Mortgage Status in Springville
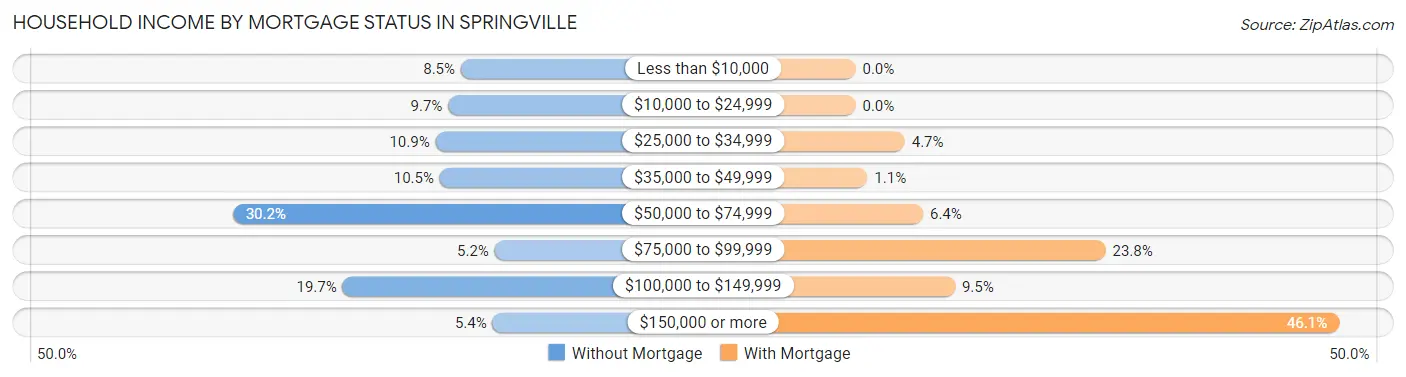
| Household Income | Without Mortgage | With Mortgage |
| Less than $10,000 | 42 (8.5%) | 0 (0.0%) |
| $10,000 to $24,999 | 48 (9.7%) | 0 (0.0%) |
| $25,000 to $34,999 | 54 (10.9%) | 54 (4.7%) |
| $35,000 to $49,999 | 52 (10.5%) | 13 (1.1%) |
| $50,000 to $74,999 | 150 (30.2%) | 74 (6.4%) |
| $75,000 to $99,999 | 26 (5.2%) | 274 (23.8%) |
| $100,000 to $149,999 | 98 (19.7%) | 109 (9.5%) |
| $150,000 or more | 27 (5.4%) | 530 (46.1%) |
| Total | 497 (100.0%) | 1,151 (100.0%) |
Property Value to Household Income Ratio in Springville
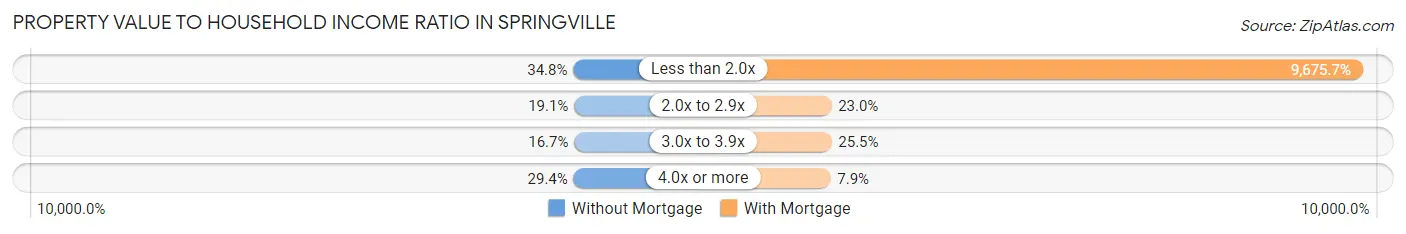
| Value-to-Income Ratio | Without Mortgage | With Mortgage |
| Less than 2.0x | 173 (34.8%) | 111,367 (9,675.7%) |
| 2.0x to 2.9x | 95 (19.1%) | 265 (23.0%) |
| 3.0x to 3.9x | 83 (16.7%) | 294 (25.5%) |
| 4.0x or more | 146 (29.4%) | 91 (7.9%) |
| Total | 497 (100.0%) | 1,151 (100.0%) |
Real Estate Taxes by Mortgage Status in Springville
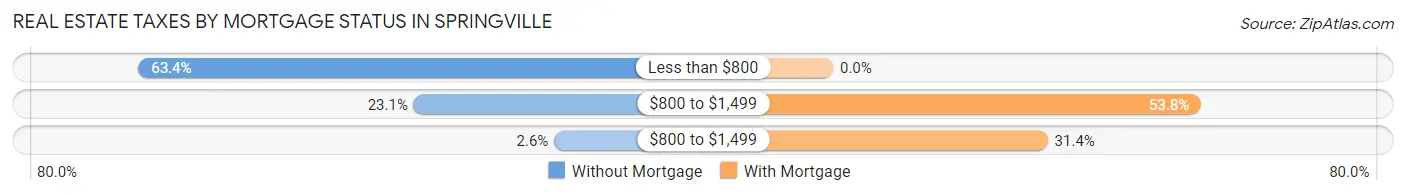
| Property Taxes | Without Mortgage | With Mortgage |
| Less than $800 | 315 (63.4%) | 0 (0.0%) |
| $800 to $1,499 | 115 (23.1%) | 619 (53.8%) |
| $800 to $1,499 | 13 (2.6%) | 361 (31.4%) |
| Total | 497 (100.0%) | 1,151 (100.0%) |
Health & Disability in Springville
Health Insurance Coverage by Age in Springville
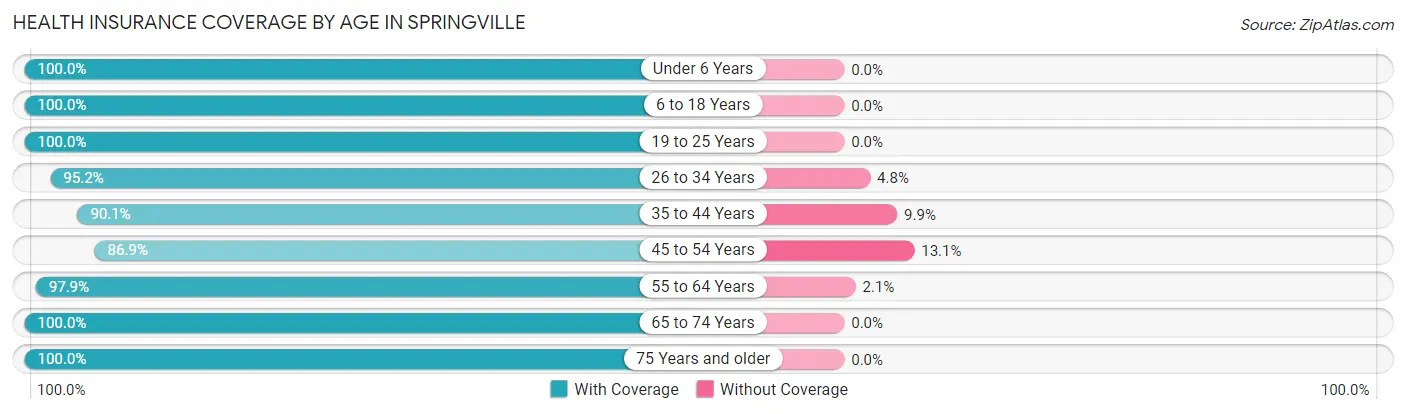
| Age Bracket | With Coverage | Without Coverage |
| Under 6 Years | 203 (100.0%) | 0 (0.0%) |
| 6 to 18 Years | 930 (100.0%) | 0 (0.0%) |
| 19 to 25 Years | 200 (100.0%) | 0 (0.0%) |
| 26 to 34 Years | 375 (95.2%) | 19 (4.8%) |
| 35 to 44 Years | 466 (90.1%) | 51 (9.9%) |
| 45 to 54 Years | 506 (86.9%) | 76 (13.1%) |
| 55 to 64 Years | 742 (97.9%) | 16 (2.1%) |
| 65 to 74 Years | 718 (100.0%) | 0 (0.0%) |
| 75 Years and older | 522 (100.0%) | 0 (0.0%) |
| Total | 4,662 (96.6%) | 162 (3.4%) |
Health Insurance Coverage by Citizenship Status in Springville
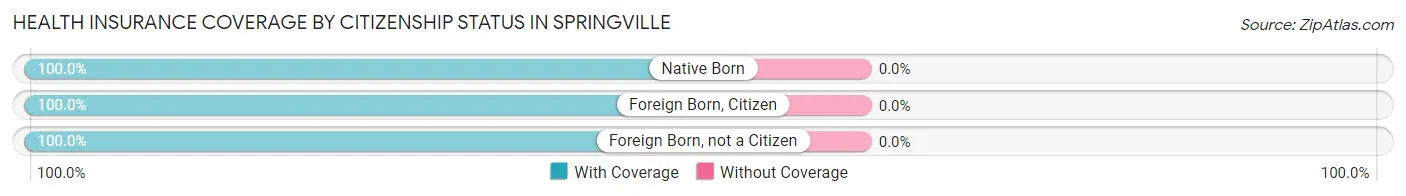
| Citizenship Status | With Coverage | Without Coverage |
| Native Born | 203 (100.0%) | 0 (0.0%) |
| Foreign Born, Citizen | 930 (100.0%) | 0 (0.0%) |
| Foreign Born, not a Citizen | 200 (100.0%) | 0 (0.0%) |
Health Insurance Coverage by Household Income in Springville
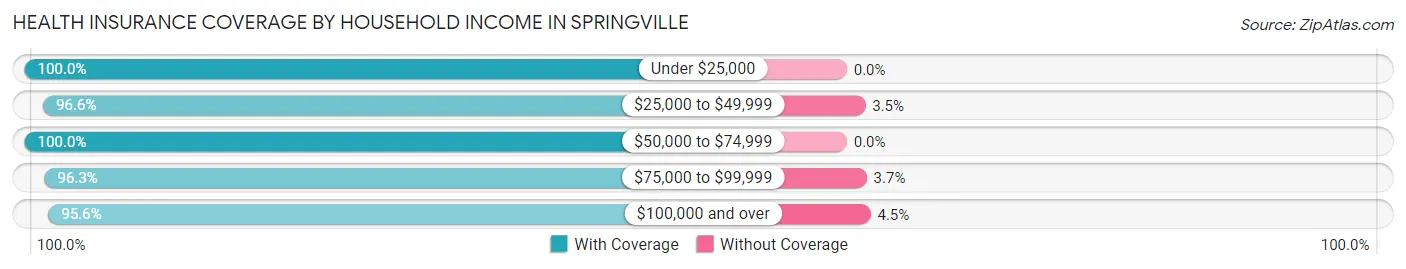
| Household Income | With Coverage | Without Coverage |
| Under $25,000 | 227 (100.0%) | 0 (0.0%) |
| $25,000 to $49,999 | 532 (96.6%) | 19 (3.5%) |
| $50,000 to $74,999 | 760 (100.0%) | 0 (0.0%) |
| $75,000 to $99,999 | 414 (96.3%) | 16 (3.7%) |
| $100,000 and over | 2,729 (95.6%) | 127 (4.4%) |
Public vs Private Health Insurance Coverage by Age in Springville
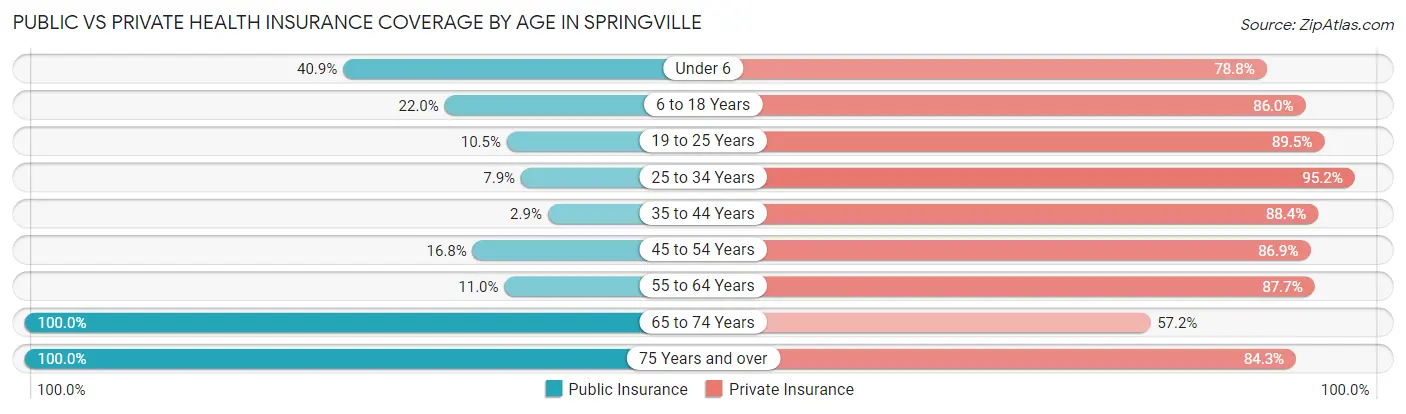
| Age Bracket | Public Insurance | Private Insurance |
| Under 6 | 83 (40.9%) | 160 (78.8%) |
| 6 to 18 Years | 205 (22.0%) | 800 (86.0%) |
| 19 to 25 Years | 21 (10.5%) | 179 (89.5%) |
| 25 to 34 Years | 31 (7.9%) | 375 (95.2%) |
| 35 to 44 Years | 15 (2.9%) | 457 (88.4%) |
| 45 to 54 Years | 98 (16.8%) | 506 (86.9%) |
| 55 to 64 Years | 83 (11.0%) | 665 (87.7%) |
| 65 to 74 Years | 718 (100.0%) | 411 (57.2%) |
| 75 Years and over | 522 (100.0%) | 440 (84.3%) |
| Total | 1,776 (36.8%) | 3,993 (82.8%) |
Disability Status by Sex by Age in Springville
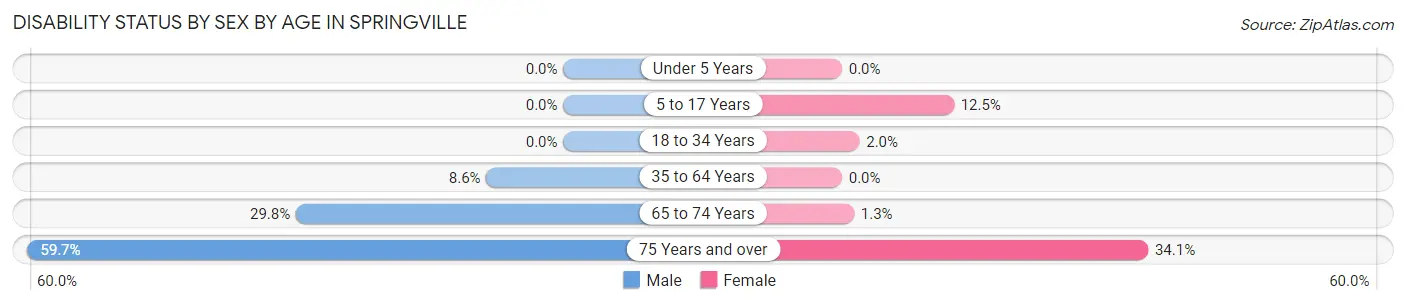
| Age Bracket | Male | Female |
| Under 5 Years | 0 (0.0%) | 0 (0.0%) |
| 5 to 17 Years | 0 (0.0%) | 44 (12.5%) |
| 18 to 34 Years | 0 (0.0%) | 8 (1.9%) |
| 35 to 64 Years | 70 (8.6%) | 0 (0.0%) |
| 65 to 74 Years | 103 (29.8%) | 5 (1.3%) |
| 75 Years and over | 77 (59.7%) | 134 (34.1%) |
Disability Class by Sex by Age in Springville
Disability Class: Hearing Difficulty
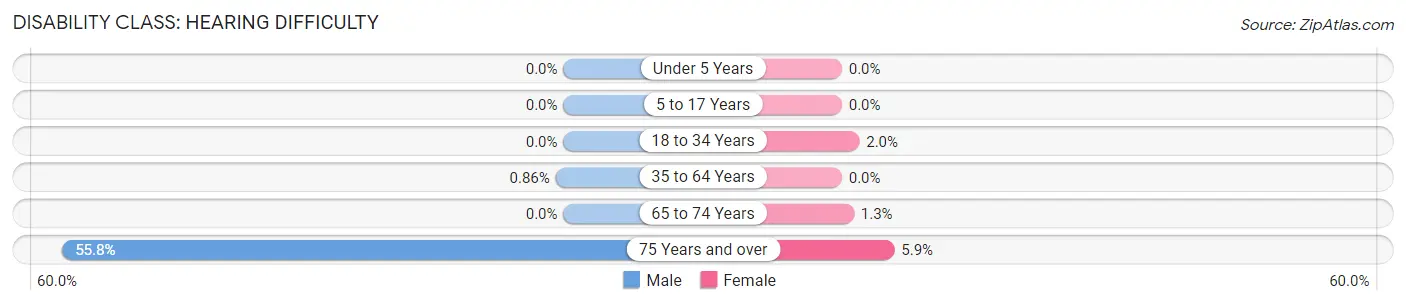
| Age Bracket | Male | Female |
| Under 5 Years | 0 (0.0%) | 0 (0.0%) |
| 5 to 17 Years | 0 (0.0%) | 0 (0.0%) |
| 18 to 34 Years | 0 (0.0%) | 8 (1.9%) |
| 35 to 64 Years | 7 (0.9%) | 0 (0.0%) |
| 65 to 74 Years | 0 (0.0%) | 5 (1.3%) |
| 75 Years and over | 72 (55.8%) | 23 (5.9%) |
Disability Class: Vision Difficulty
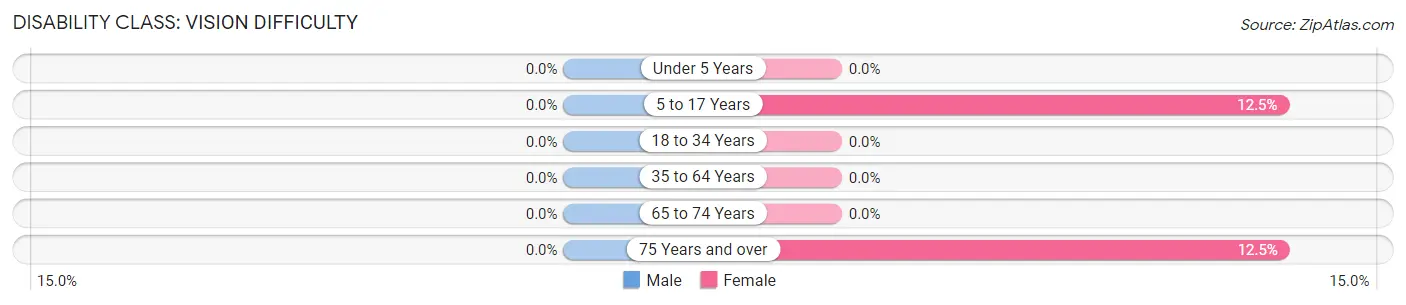
| Age Bracket | Male | Female |
| Under 5 Years | 0 (0.0%) | 0 (0.0%) |
| 5 to 17 Years | 0 (0.0%) | 44 (12.5%) |
| 18 to 34 Years | 0 (0.0%) | 0 (0.0%) |
| 35 to 64 Years | 0 (0.0%) | 0 (0.0%) |
| 65 to 74 Years | 0 (0.0%) | 0 (0.0%) |
| 75 Years and over | 0 (0.0%) | 49 (12.5%) |
Disability Class: Cognitive Difficulty
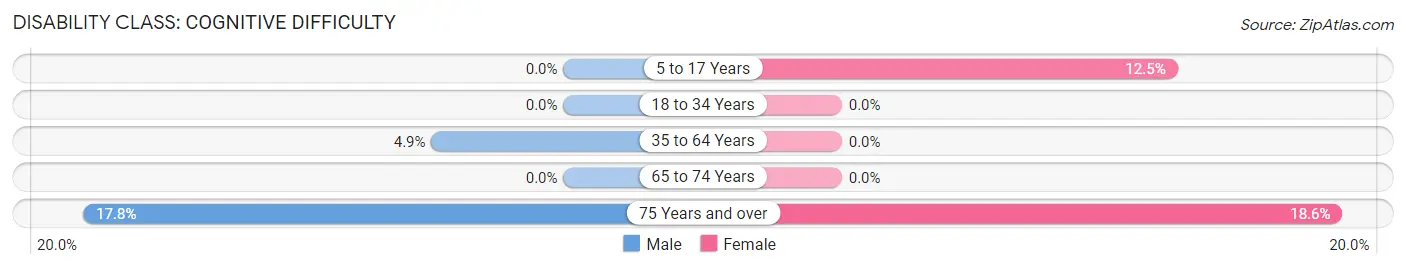
| Age Bracket | Male | Female |
| 5 to 17 Years | 0 (0.0%) | 44 (12.5%) |
| 18 to 34 Years | 0 (0.0%) | 0 (0.0%) |
| 35 to 64 Years | 40 (4.9%) | 0 (0.0%) |
| 65 to 74 Years | 0 (0.0%) | 0 (0.0%) |
| 75 Years and over | 23 (17.8%) | 73 (18.6%) |
Disability Class: Ambulatory Difficulty
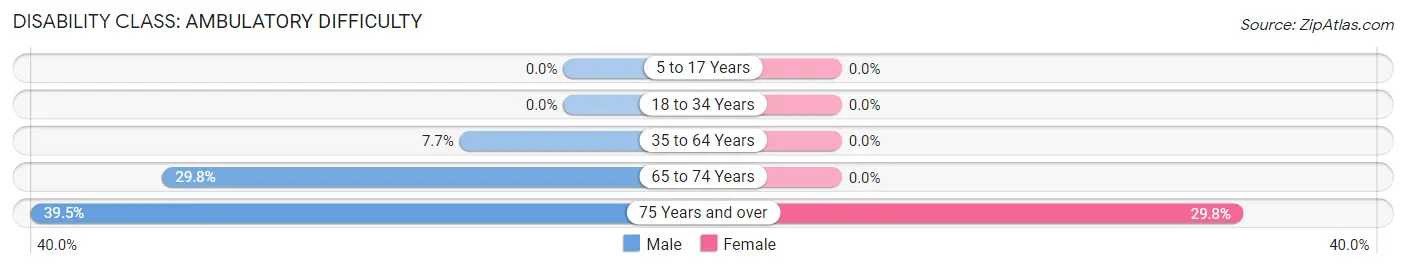
| Age Bracket | Male | Female |
| 5 to 17 Years | 0 (0.0%) | 0 (0.0%) |
| 18 to 34 Years | 0 (0.0%) | 0 (0.0%) |
| 35 to 64 Years | 63 (7.7%) | 0 (0.0%) |
| 65 to 74 Years | 103 (29.8%) | 0 (0.0%) |
| 75 Years and over | 51 (39.5%) | 117 (29.8%) |
Disability Class: Self-Care Difficulty
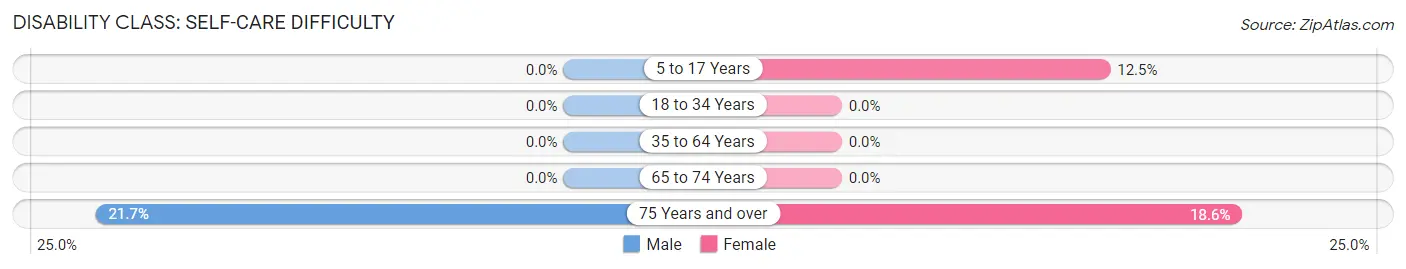
| Age Bracket | Male | Female |
| 5 to 17 Years | 0 (0.0%) | 44 (12.5%) |
| 18 to 34 Years | 0 (0.0%) | 0 (0.0%) |
| 35 to 64 Years | 0 (0.0%) | 0 (0.0%) |
| 65 to 74 Years | 0 (0.0%) | 0 (0.0%) |
| 75 Years and over | 28 (21.7%) | 73 (18.6%) |
Technology Access in Springville
Computing Device Access in Springville
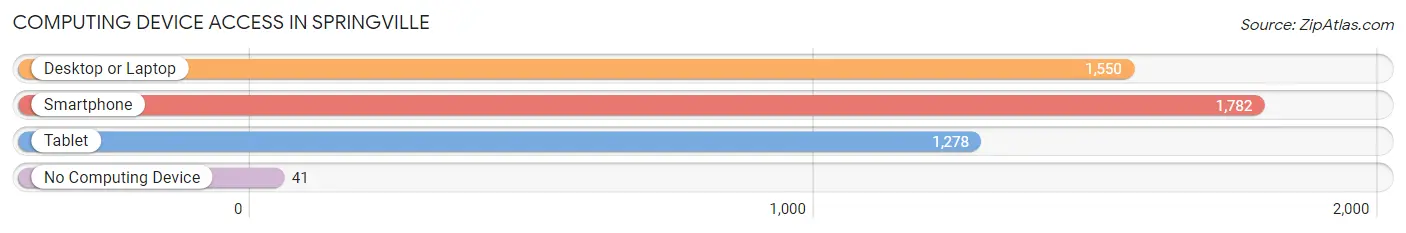
| Device Type | # Households | % Households |
| Desktop or Laptop | 1,550 | 82.8% |
| Smartphone | 1,782 | 95.2% |
| Tablet | 1,278 | 68.3% |
| No Computing Device | 41 | 2.2% |
| Total | 1,871 | 100.0% |
Internet Access in Springville
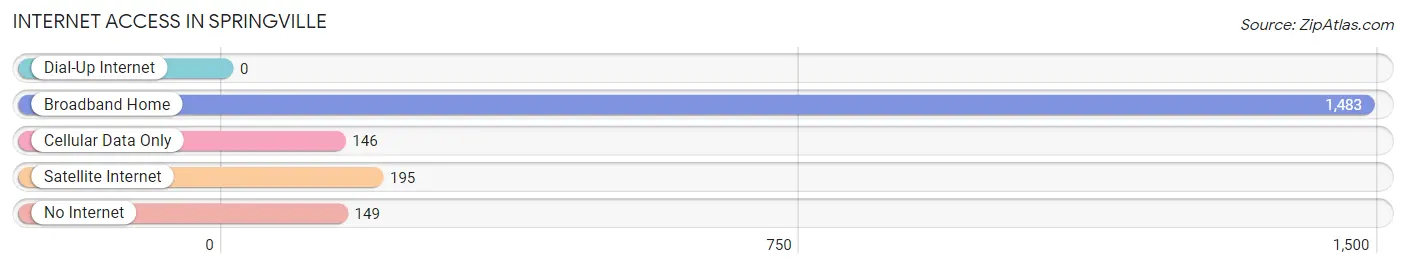
| Internet Type | # Households | % Households |
| Dial-Up Internet | 0 | 0.0% |
| Broadband Home | 1,483 | 79.3% |
| Cellular Data Only | 146 | 7.8% |
| Satellite Internet | 195 | 10.4% |
| No Internet | 149 | 8.0% |
| Total | 1,871 | 100.0% |
Springville Summary
History
The town of Springville, Alabama is located in St. Clair County, approximately 30 miles northeast of Birmingham. The town was founded in 1818 and was originally known as “Springville Station” due to its location on the stagecoach line between Birmingham and Gadsden. The town was officially incorporated in 1887 and was named after the nearby spring.
The town was a major stop on the Louisville and Nashville Railroad, which was built in the late 1800s. This allowed the town to become a major hub for the cotton industry, as well as a center for commerce and industry. The town was also home to several large cotton mills, which provided employment for many of the town’s residents.
In the early 1900s, the town experienced a period of growth and prosperity. The population increased from 1,000 in 1900 to over 3,000 by 1930. During this time, the town was home to several businesses, including a bank, a hotel, a movie theater, and several stores.
The Great Depression had a major impact on the town, as many of the businesses closed and the population decreased. However, the town was able to recover and by the 1950s, the population had grown to over 4,000.
Geography
Springville is located in the foothills of the Appalachian Mountains in St. Clair County, Alabama. The town is situated on the banks of the Coosa River, which flows through the center of town. The town is surrounded by rolling hills and is located approximately 30 miles northeast of Birmingham.
The town has a total area of 4.2 square miles, all of which is land. The town has a humid subtropical climate, with hot, humid summers and mild winters. The average annual temperature is around 64 degrees Fahrenheit.
Economy
The economy of Springville is largely based on agriculture and manufacturing. The town is home to several large cotton mills, which provide employment for many of the town’s residents. The town is also home to several small businesses, including restaurants, retail stores, and service providers.
The town is also home to several large employers, including the St. Clair County Board of Education, the St. Clair County Sheriff’s Office, and the Springville Medical Center.
Demographics
As of the 2010 census, the population of Springville was 4,521. The racial makeup of the town was 87.3% White, 9.2% African American, 0.5% Native American, 0.3% Asian, 0.1% Pacific Islander, 1.2% from other races, and 1.5% from two or more races. Hispanic or Latino of any race were 2.7% of the population.
The median income for a household in the town was $37,917, and the median income for a family was $45,938. The per capita income for the town was $18,945. About 11.2% of families and 14.2% of the population were below the poverty line, including 19.2% of those under age 18 and 8.2% of those age 65 or over.
Common Questions
What is Per Capita Income in Springville?
Per Capita income in Springville is $33,611.
What is the Median Family Income in Springville?
Median Family Income in Springville is $92,813.
What is the Median Household income in Springville?
Median Household Income in Springville is $62,386.
What is Income or Wage Gap in Springville?
Income or Wage Gap in Springville is 48.9%.
Women in Springville earn 51.1 cents for every dollar earned by a man.
What is Inequality or Gini Index in Springville?
Inequality or Gini Index in Springville is 0.34.
What is the Total Population of Springville?
Total Population of Springville is 4,824.
What is the Total Male Population of Springville?
Total Male Population of Springville is 2,144.
What is the Total Female Population of Springville?
Total Female Population of Springville is 2,680.
What is the Ratio of Males per 100 Females in Springville?
There are 80.00 Males per 100 Females in Springville.
What is the Ratio of Females per 100 Males in Springville?
There are 125.00 Females per 100 Males in Springville.
What is the Median Population Age in Springville?
Median Population Age in Springville is 49.8 Years.
What is the Average Family Size in Springville
Average Family Size in Springville is 3.0 People.
What is the Average Household Size in Springville
Average Household Size in Springville is 2.6 People.
How Large is the Labor Force in Springville?
There are 2,137 People in the Labor Forcein in Springville.
What is the Percentage of People in the Labor Force in Springville?
53.9% of People are in the Labor Force in Springville.
What is the Unemployment Rate in Springville?
Unemployment Rate in Springville is 1.5%.