Immigrants from Jordan vs Immigrants from Honduras 3 or more Vehicles in Household
COMPARE
Immigrants from Jordan
Immigrants from Honduras
3 or more Vehicles in Household
3 or more Vehicles in Household Comparison
Immigrants from Jordan
Immigrants from Honduras
19.9%
3 OR MORE VEHICLES IN HOUSEHOLD
75.0/ 100
METRIC RATING
154th/ 347
METRIC RANK
18.2%
3 OR MORE VEHICLES IN HOUSEHOLD
3.1/ 100
METRIC RATING
238th/ 347
METRIC RANK
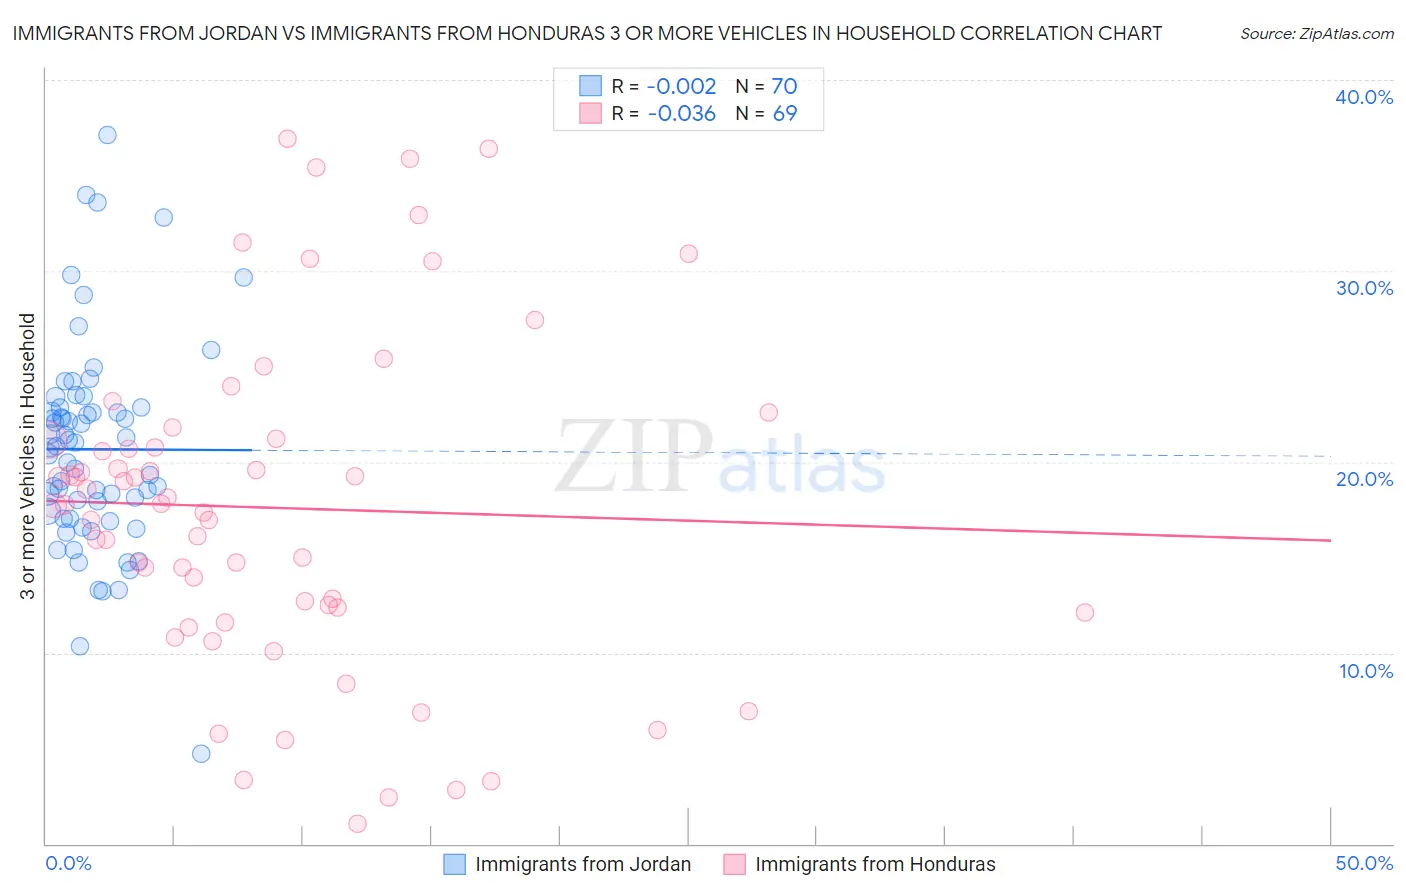
Immigrants from Jordan vs Immigrants from Honduras 3 or more Vehicles in Household Correlation Chart
The statistical analysis conducted on geographies consisting of 181,207,315 people shows no correlation between the proportion of Immigrants from Jordan and percentage of households with 3 or more vehicles available in the United States with a correlation coefficient (R) of -0.002 and weighted average of 19.9%. Similarly, the statistical analysis conducted on geographies consisting of 322,444,199 people shows no correlation between the proportion of Immigrants from Honduras and percentage of households with 3 or more vehicles available in the United States with a correlation coefficient (R) of -0.036 and weighted average of 18.2%, a difference of 9.1%.
3 or more Vehicles in Household Correlation Summary
| Measurement | Immigrants from Jordan | Immigrants from Honduras |
| Minimum | 4.7% | 1.0% |
| Maximum | 37.1% | 36.9% |
| Range | 32.4% | 35.9% |
| Mean | 20.7% | 17.6% |
| Median | 20.8% | 17.7% |
| Interquartile 25% (IQ1) | 17.0% | 12.3% |
| Interquartile 75% (IQ3) | 22.8% | 21.2% |
| Interquartile Range (IQR) | 5.8% | 8.9% |
| Standard Deviation (Sample) | 5.5% | 8.6% |
| Standard Deviation (Population) | 5.5% | 8.5% |
Similar Demographics by 3 or more Vehicles in Household
Demographics Similar to Immigrants from Jordan by 3 or more Vehicles in Household
In terms of 3 or more vehicles in household, the demographic groups most similar to Immigrants from Jordan are Yuman (19.9%, a difference of 0.060%), Tlingit-Haida (19.9%, a difference of 0.15%), Thai (19.8%, a difference of 0.37%), Hungarian (19.8%, a difference of 0.42%), and Lebanese (20.0%, a difference of 0.51%).
| Demographics | Rating | Rank | 3 or more Vehicles in Household |
| Slovaks | 83.0 /100 | #147 | Excellent 20.1% |
| Guatemalans | 82.6 /100 | #148 | Excellent 20.1% |
| Immigrants | Iran | 80.9 /100 | #149 | Excellent 20.0% |
| Immigrants | Immigrants | 80.8 /100 | #150 | Excellent 20.0% |
| Taiwanese | 80.6 /100 | #151 | Excellent 20.0% |
| Lebanese | 79.8 /100 | #152 | Good 20.0% |
| Yuman | 75.6 /100 | #153 | Good 19.9% |
| Immigrants | Jordan | 75.0 /100 | #154 | Good 19.9% |
| Tlingit-Haida | 73.4 /100 | #155 | Good 19.9% |
| Thais | 71.1 /100 | #156 | Good 19.8% |
| Hungarians | 70.5 /100 | #157 | Good 19.8% |
| Armenians | 68.8 /100 | #158 | Good 19.8% |
| Immigrants | Pakistan | 68.2 /100 | #159 | Good 19.8% |
| Immigrants | Lebanon | 67.6 /100 | #160 | Good 19.8% |
| Immigrants | Guatemala | 65.6 /100 | #161 | Good 19.7% |
Demographics Similar to Immigrants from Honduras by 3 or more Vehicles in Household
In terms of 3 or more vehicles in household, the demographic groups most similar to Immigrants from Honduras are Immigrants from Middle Africa (18.2%, a difference of 0.010%), Immigrants from China (18.2%, a difference of 0.13%), Indonesian (18.3%, a difference of 0.23%), Immigrants from Malaysia (18.3%, a difference of 0.28%), and African (18.2%, a difference of 0.33%).
| Demographics | Rating | Rank | 3 or more Vehicles in Household |
| Immigrants | Belgium | 4.8 /100 | #231 | Tragic 18.4% |
| Immigrants | Uganda | 4.6 /100 | #232 | Tragic 18.4% |
| Hondurans | 4.6 /100 | #233 | Tragic 18.4% |
| Immigrants | North Macedonia | 4.4 /100 | #234 | Tragic 18.4% |
| Sierra Leoneans | 3.9 /100 | #235 | Tragic 18.3% |
| Immigrants | Malaysia | 3.6 /100 | #236 | Tragic 18.3% |
| Indonesians | 3.5 /100 | #237 | Tragic 18.3% |
| Immigrants | Honduras | 3.1 /100 | #238 | Tragic 18.2% |
| Immigrants | Middle Africa | 3.1 /100 | #239 | Tragic 18.2% |
| Immigrants | China | 2.9 /100 | #240 | Tragic 18.2% |
| Africans | 2.7 /100 | #241 | Tragic 18.2% |
| Hopi | 2.5 /100 | #242 | Tragic 18.2% |
| Immigrants | Europe | 2.4 /100 | #243 | Tragic 18.1% |
| Mongolians | 2.3 /100 | #244 | Tragic 18.1% |
| Immigrants | Belize | 2.1 /100 | #245 | Tragic 18.1% |