Immigrants from Jordan vs Crow 3 or more Vehicles in Household
COMPARE
Immigrants from Jordan
Crow
3 or more Vehicles in Household
3 or more Vehicles in Household Comparison
Immigrants from Jordan
Crow
19.9%
3 OR MORE VEHICLES IN HOUSEHOLD
75.0/ 100
METRIC RATING
154th/ 347
METRIC RANK
22.5%
3 OR MORE VEHICLES IN HOUSEHOLD
100.0/ 100
METRIC RATING
54th/ 347
METRIC RANK
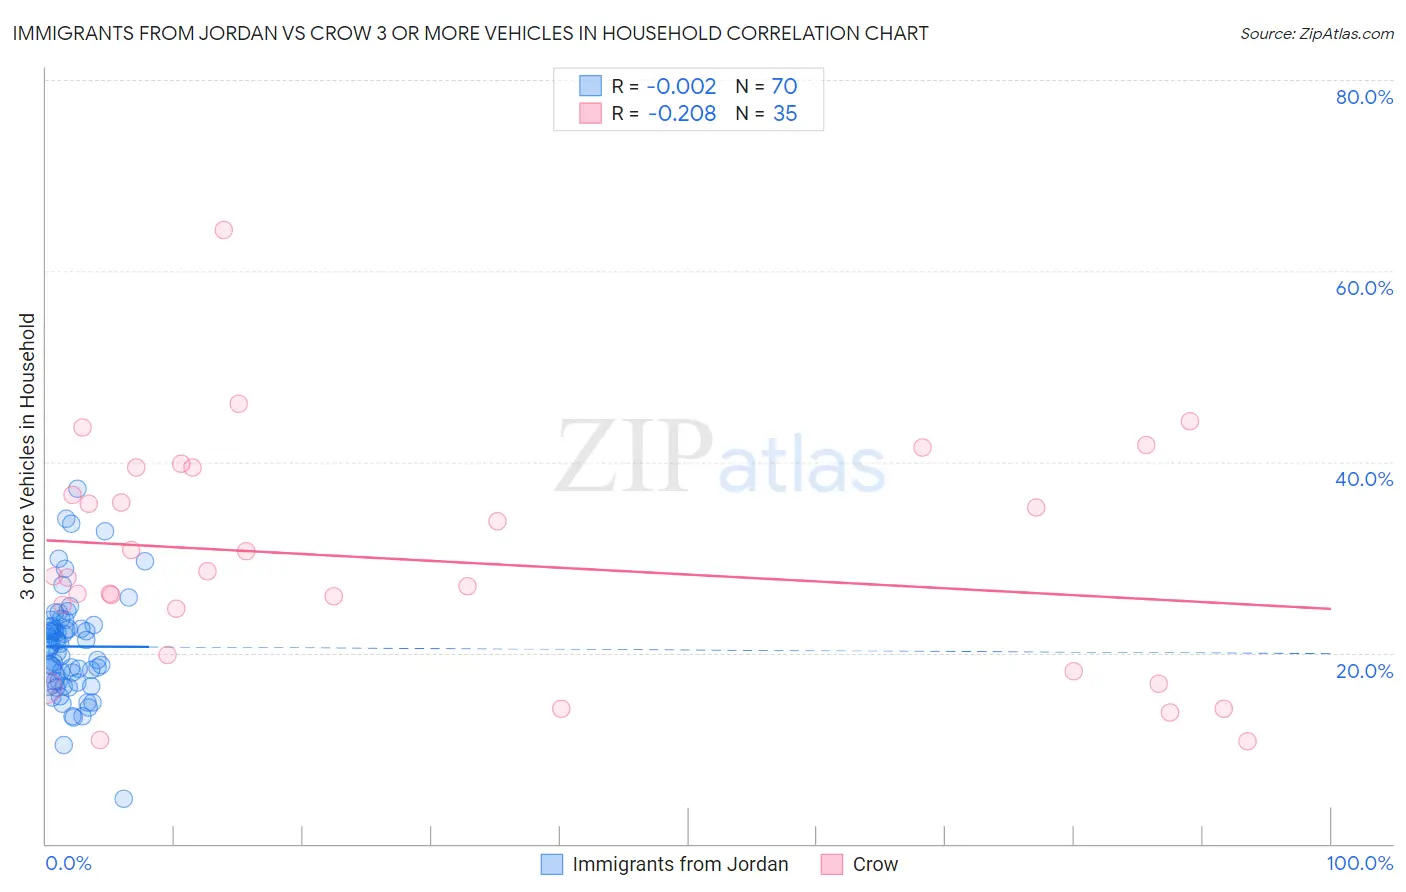
Immigrants from Jordan vs Crow 3 or more Vehicles in Household Correlation Chart
The statistical analysis conducted on geographies consisting of 181,207,315 people shows no correlation between the proportion of Immigrants from Jordan and percentage of households with 3 or more vehicles available in the United States with a correlation coefficient (R) of -0.002 and weighted average of 19.9%. Similarly, the statistical analysis conducted on geographies consisting of 59,203,014 people shows a weak negative correlation between the proportion of Crow and percentage of households with 3 or more vehicles available in the United States with a correlation coefficient (R) of -0.208 and weighted average of 22.5%, a difference of 12.9%.
3 or more Vehicles in Household Correlation Summary
| Measurement | Immigrants from Jordan | Crow |
| Minimum | 4.7% | 10.8% |
| Maximum | 37.1% | 64.3% |
| Range | 32.4% | 53.5% |
| Mean | 20.7% | 29.7% |
| Median | 20.8% | 28.0% |
| Interquartile 25% (IQ1) | 17.0% | 19.8% |
| Interquartile 75% (IQ3) | 22.8% | 39.4% |
| Interquartile Range (IQR) | 5.8% | 19.6% |
| Standard Deviation (Sample) | 5.5% | 11.8% |
| Standard Deviation (Population) | 5.5% | 11.7% |
Similar Demographics by 3 or more Vehicles in Household
Demographics Similar to Immigrants from Jordan by 3 or more Vehicles in Household
In terms of 3 or more vehicles in household, the demographic groups most similar to Immigrants from Jordan are Yuman (19.9%, a difference of 0.060%), Tlingit-Haida (19.9%, a difference of 0.15%), Thai (19.8%, a difference of 0.37%), Hungarian (19.8%, a difference of 0.42%), and Lebanese (20.0%, a difference of 0.51%).
| Demographics | Rating | Rank | 3 or more Vehicles in Household |
| Slovaks | 83.0 /100 | #147 | Excellent 20.1% |
| Guatemalans | 82.6 /100 | #148 | Excellent 20.1% |
| Immigrants | Iran | 80.9 /100 | #149 | Excellent 20.0% |
| Immigrants | Immigrants | 80.8 /100 | #150 | Excellent 20.0% |
| Taiwanese | 80.6 /100 | #151 | Excellent 20.0% |
| Lebanese | 79.8 /100 | #152 | Good 20.0% |
| Yuman | 75.6 /100 | #153 | Good 19.9% |
| Immigrants | Jordan | 75.0 /100 | #154 | Good 19.9% |
| Tlingit-Haida | 73.4 /100 | #155 | Good 19.9% |
| Thais | 71.1 /100 | #156 | Good 19.8% |
| Hungarians | 70.5 /100 | #157 | Good 19.8% |
| Armenians | 68.8 /100 | #158 | Good 19.8% |
| Immigrants | Pakistan | 68.2 /100 | #159 | Good 19.8% |
| Immigrants | Lebanon | 67.6 /100 | #160 | Good 19.8% |
| Immigrants | Guatemala | 65.6 /100 | #161 | Good 19.7% |
Demographics Similar to Crow by 3 or more Vehicles in Household
In terms of 3 or more vehicles in household, the demographic groups most similar to Crow are Czech (22.5%, a difference of 0.21%), Immigrants from Laos (22.4%, a difference of 0.37%), Hispanic or Latino (22.4%, a difference of 0.40%), Welsh (22.6%, a difference of 0.47%), and White/Caucasian (22.6%, a difference of 0.51%).
| Demographics | Rating | Rank | 3 or more Vehicles in Household |
| Malaysians | 100.0 /100 | #47 | Exceptional 22.6% |
| Scottish | 100.0 /100 | #48 | Exceptional 22.6% |
| Scotch-Irish | 100.0 /100 | #49 | Exceptional 22.6% |
| Sioux | 100.0 /100 | #50 | Exceptional 22.6% |
| Whites/Caucasians | 100.0 /100 | #51 | Exceptional 22.6% |
| Welsh | 100.0 /100 | #52 | Exceptional 22.6% |
| Czechs | 100.0 /100 | #53 | Exceptional 22.5% |
| Crow | 100.0 /100 | #54 | Exceptional 22.5% |
| Immigrants | Laos | 100.0 /100 | #55 | Exceptional 22.4% |
| Hispanics or Latinos | 100.0 /100 | #56 | Exceptional 22.4% |
| Pennsylvania Germans | 100.0 /100 | #57 | Exceptional 22.3% |
| Spaniards | 100.0 /100 | #58 | Exceptional 22.3% |
| Navajo | 100.0 /100 | #59 | Exceptional 22.3% |
| Finns | 99.9 /100 | #60 | Exceptional 22.3% |
| Bhutanese | 99.9 /100 | #61 | Exceptional 22.2% |