Immigrants from Jordan vs Indian (Asian) 3 or more Vehicles in Household
COMPARE
Immigrants from Jordan
Indian (Asian)
3 or more Vehicles in Household
3 or more Vehicles in Household Comparison
Immigrants from Jordan
Indians (Asian)
19.9%
3 OR MORE VEHICLES IN HOUSEHOLD
75.0/ 100
METRIC RATING
154th/ 347
METRIC RANK
19.1%
3 OR MORE VEHICLES IN HOUSEHOLD
26.0/ 100
METRIC RATING
189th/ 347
METRIC RANK
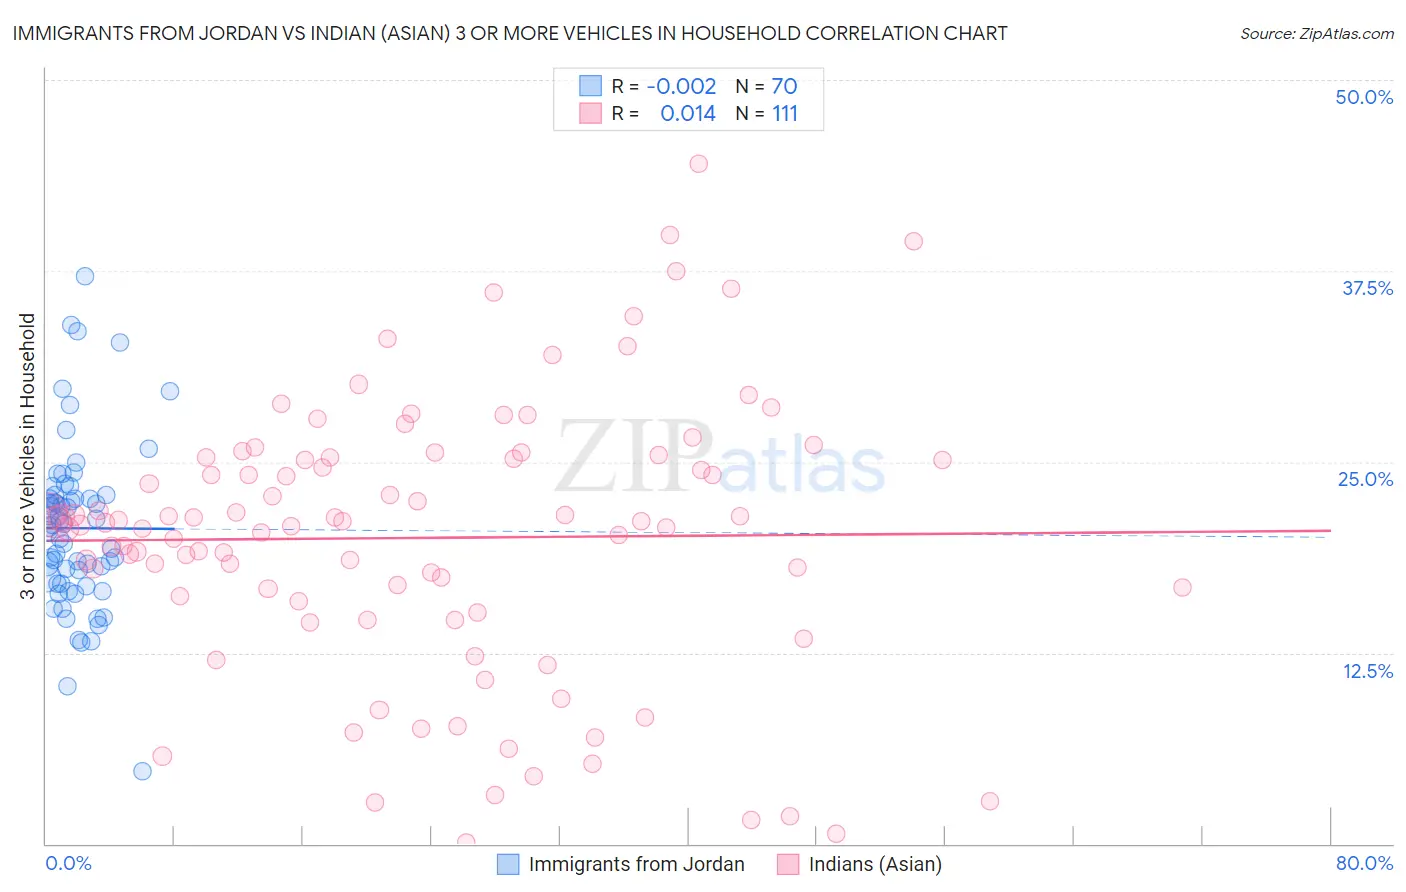
Immigrants from Jordan vs Indian (Asian) 3 or more Vehicles in Household Correlation Chart
The statistical analysis conducted on geographies consisting of 181,207,315 people shows no correlation between the proportion of Immigrants from Jordan and percentage of households with 3 or more vehicles available in the United States with a correlation coefficient (R) of -0.002 and weighted average of 19.9%. Similarly, the statistical analysis conducted on geographies consisting of 494,546,924 people shows no correlation between the proportion of Indians (Asian) and percentage of households with 3 or more vehicles available in the United States with a correlation coefficient (R) of 0.014 and weighted average of 19.1%, a difference of 4.1%.
3 or more Vehicles in Household Correlation Summary
| Measurement | Immigrants from Jordan | Indian (Asian) |
| Minimum | 4.7% | 0.12% |
| Maximum | 37.1% | 44.5% |
| Range | 32.4% | 44.4% |
| Mean | 20.7% | 20.0% |
| Median | 20.8% | 21.0% |
| Interquartile 25% (IQ1) | 17.0% | 15.9% |
| Interquartile 75% (IQ3) | 22.8% | 25.3% |
| Interquartile Range (IQR) | 5.8% | 9.4% |
| Standard Deviation (Sample) | 5.5% | 8.9% |
| Standard Deviation (Population) | 5.5% | 8.9% |
Similar Demographics by 3 or more Vehicles in Household
Demographics Similar to Immigrants from Jordan by 3 or more Vehicles in Household
In terms of 3 or more vehicles in household, the demographic groups most similar to Immigrants from Jordan are Yuman (19.9%, a difference of 0.060%), Tlingit-Haida (19.9%, a difference of 0.15%), Thai (19.8%, a difference of 0.37%), Hungarian (19.8%, a difference of 0.42%), and Lebanese (20.0%, a difference of 0.51%).
| Demographics | Rating | Rank | 3 or more Vehicles in Household |
| Slovaks | 83.0 /100 | #147 | Excellent 20.1% |
| Guatemalans | 82.6 /100 | #148 | Excellent 20.1% |
| Immigrants | Iran | 80.9 /100 | #149 | Excellent 20.0% |
| Immigrants | Immigrants | 80.8 /100 | #150 | Excellent 20.0% |
| Taiwanese | 80.6 /100 | #151 | Excellent 20.0% |
| Lebanese | 79.8 /100 | #152 | Good 20.0% |
| Yuman | 75.6 /100 | #153 | Good 19.9% |
| Immigrants | Jordan | 75.0 /100 | #154 | Good 19.9% |
| Tlingit-Haida | 73.4 /100 | #155 | Good 19.9% |
| Thais | 71.1 /100 | #156 | Good 19.8% |
| Hungarians | 70.5 /100 | #157 | Good 19.8% |
| Armenians | 68.8 /100 | #158 | Good 19.8% |
| Immigrants | Pakistan | 68.2 /100 | #159 | Good 19.8% |
| Immigrants | Lebanon | 67.6 /100 | #160 | Good 19.8% |
| Immigrants | Guatemala | 65.6 /100 | #161 | Good 19.7% |
Demographics Similar to Indians (Asian) by 3 or more Vehicles in Household
In terms of 3 or more vehicles in household, the demographic groups most similar to Indians (Asian) are Immigrants from Kuwait (19.1%, a difference of 0.010%), Immigrants from Zimbabwe (19.1%, a difference of 0.050%), South American Indian (19.1%, a difference of 0.070%), Kenyan (19.1%, a difference of 0.13%), and Tsimshian (19.1%, a difference of 0.16%).
| Demographics | Rating | Rank | 3 or more Vehicles in Household |
| Cubans | 36.6 /100 | #182 | Fair 19.3% |
| Cajuns | 36.0 /100 | #183 | Fair 19.3% |
| Latvians | 35.7 /100 | #184 | Fair 19.3% |
| Immigrants | Sri Lanka | 30.7 /100 | #185 | Fair 19.2% |
| Immigrants | Sweden | 29.0 /100 | #186 | Fair 19.2% |
| Immigrants | Hong Kong | 28.3 /100 | #187 | Fair 19.2% |
| Immigrants | Kuwait | 26.1 /100 | #188 | Fair 19.1% |
| Indians (Asian) | 26.0 /100 | #189 | Fair 19.1% |
| Immigrants | Zimbabwe | 25.5 /100 | #190 | Fair 19.1% |
| South American Indians | 25.4 /100 | #191 | Fair 19.1% |
| Kenyans | 24.7 /100 | #192 | Fair 19.1% |
| Tsimshian | 24.4 /100 | #193 | Fair 19.1% |
| Serbians | 24.0 /100 | #194 | Fair 19.1% |
| Immigrants | Moldova | 23.6 /100 | #195 | Fair 19.1% |
| Central American Indians | 22.2 /100 | #196 | Fair 19.0% |