Immigrants from Jordan vs Immigrants from Honduras GED/Equivalency
COMPARE
Immigrants from Jordan
Immigrants from Honduras
GED/Equivalency
GED/Equivalency Comparison
Immigrants from Jordan
Immigrants from Honduras
86.8%
GED/EQUIVALENCY
90.8/ 100
METRIC RATING
122nd/ 347
METRIC RANK
78.7%
GED/EQUIVALENCY
0.0/ 100
METRIC RATING
331st/ 347
METRIC RANK
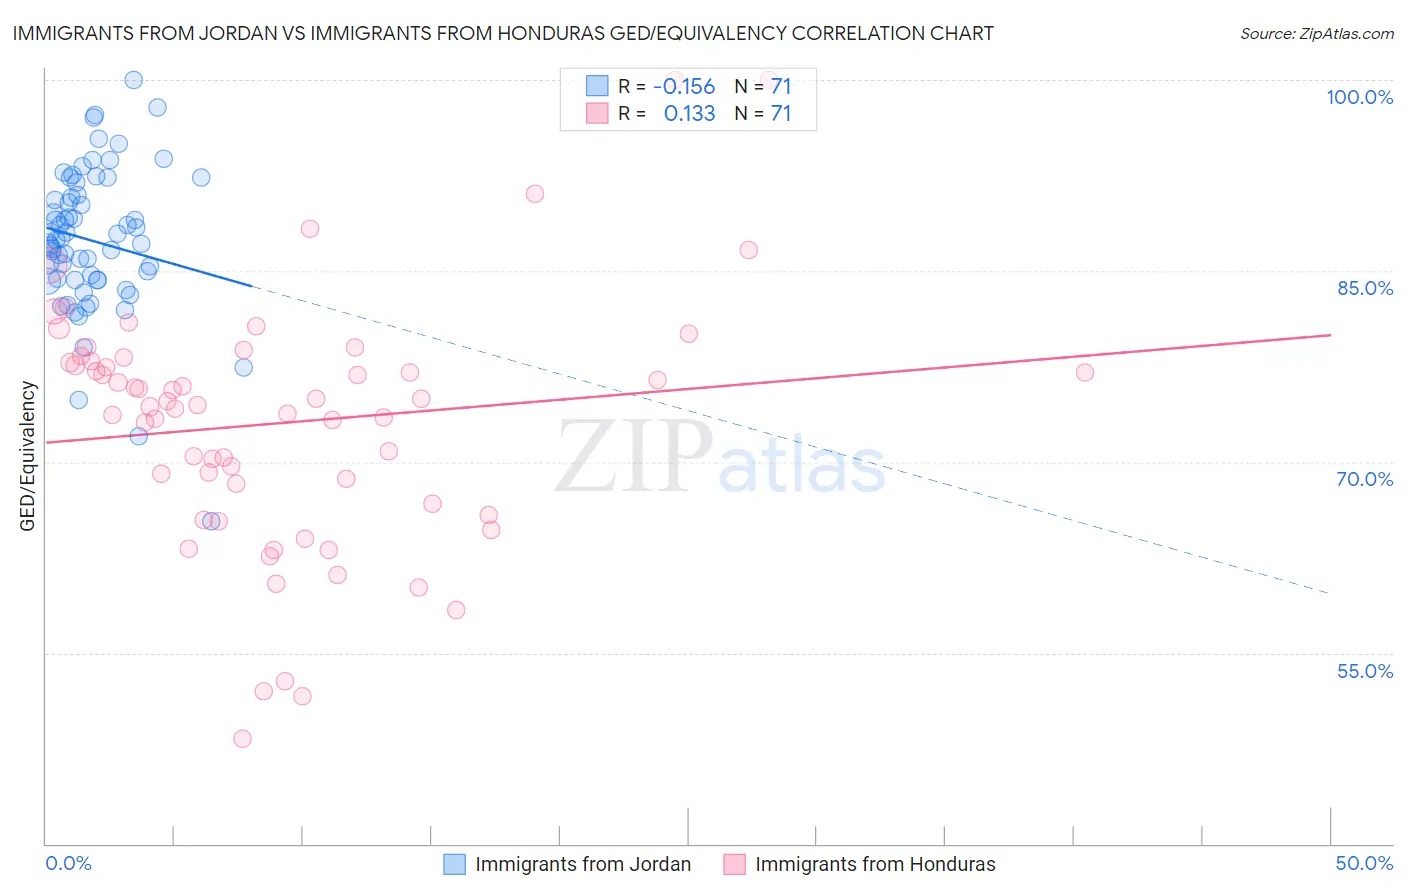
Immigrants from Jordan vs Immigrants from Honduras GED/Equivalency Correlation Chart
The statistical analysis conducted on geographies consisting of 181,276,674 people shows a poor negative correlation between the proportion of Immigrants from Jordan and percentage of population with at least ged/equivalency education in the United States with a correlation coefficient (R) of -0.156 and weighted average of 86.8%. Similarly, the statistical analysis conducted on geographies consisting of 322,637,196 people shows a poor positive correlation between the proportion of Immigrants from Honduras and percentage of population with at least ged/equivalency education in the United States with a correlation coefficient (R) of 0.133 and weighted average of 78.7%, a difference of 10.2%.
GED/Equivalency Correlation Summary
| Measurement | Immigrants from Jordan | Immigrants from Honduras |
| Minimum | 65.3% | 48.2% |
| Maximum | 100.0% | 100.0% |
| Range | 34.7% | 51.8% |
| Mean | 87.3% | 73.0% |
| Median | 87.4% | 74.5% |
| Interquartile 25% (IQ1) | 84.3% | 66.7% |
| Interquartile 75% (IQ3) | 91.0% | 78.0% |
| Interquartile Range (IQR) | 6.6% | 11.2% |
| Standard Deviation (Sample) | 5.8% | 9.7% |
| Standard Deviation (Population) | 5.8% | 9.7% |
Similar Demographics by GED/Equivalency
Demographics Similar to Immigrants from Jordan by GED/Equivalency
In terms of ged/equivalency, the demographic groups most similar to Immigrants from Jordan are Immigrants from Lebanon (86.8%, a difference of 0.0%), Immigrants from Italy (86.7%, a difference of 0.020%), Immigrants from Egypt (86.7%, a difference of 0.030%), Celtic (86.7%, a difference of 0.030%), and Asian (86.7%, a difference of 0.030%).
| Demographics | Rating | Rank | GED/Equivalency |
| Mongolians | 94.6 /100 | #115 | Exceptional 87.0% |
| Swiss | 94.5 /100 | #116 | Exceptional 87.0% |
| Immigrants | Hong Kong | 93.8 /100 | #117 | Exceptional 86.9% |
| French Canadians | 93.2 /100 | #118 | Exceptional 86.9% |
| Immigrants | China | 93.2 /100 | #119 | Exceptional 86.9% |
| Scotch-Irish | 91.6 /100 | #120 | Exceptional 86.8% |
| Immigrants | Lebanon | 90.9 /100 | #121 | Exceptional 86.8% |
| Immigrants | Jordan | 90.8 /100 | #122 | Exceptional 86.8% |
| Immigrants | Italy | 90.5 /100 | #123 | Exceptional 86.7% |
| Immigrants | Egypt | 90.4 /100 | #124 | Exceptional 86.7% |
| Celtics | 90.4 /100 | #125 | Exceptional 86.7% |
| Asians | 90.3 /100 | #126 | Exceptional 86.7% |
| Argentineans | 89.7 /100 | #127 | Excellent 86.7% |
| Yugoslavians | 89.5 /100 | #128 | Excellent 86.7% |
| Immigrants | Ukraine | 88.9 /100 | #129 | Excellent 86.7% |
Demographics Similar to Immigrants from Honduras by GED/Equivalency
In terms of ged/equivalency, the demographic groups most similar to Immigrants from Honduras are Immigrants from the Azores (78.7%, a difference of 0.11%), Salvadoran (78.6%, a difference of 0.22%), Immigrants from Cabo Verde (78.9%, a difference of 0.24%), Guatemalan (78.5%, a difference of 0.31%), and Immigrants from Latin America (78.5%, a difference of 0.33%).
| Demographics | Rating | Rank | GED/Equivalency |
| Mexican American Indians | 0.0 /100 | #324 | Tragic 79.4% |
| Hondurans | 0.0 /100 | #325 | Tragic 79.3% |
| Yuman | 0.0 /100 | #326 | Tragic 79.2% |
| Central Americans | 0.0 /100 | #327 | Tragic 79.2% |
| Hispanics or Latinos | 0.0 /100 | #328 | Tragic 79.1% |
| Dominicans | 0.0 /100 | #329 | Tragic 79.1% |
| Immigrants | Cabo Verde | 0.0 /100 | #330 | Tragic 78.9% |
| Immigrants | Honduras | 0.0 /100 | #331 | Tragic 78.7% |
| Immigrants | Azores | 0.0 /100 | #332 | Tragic 78.7% |
| Salvadorans | 0.0 /100 | #333 | Tragic 78.6% |
| Guatemalans | 0.0 /100 | #334 | Tragic 78.5% |
| Immigrants | Latin America | 0.0 /100 | #335 | Tragic 78.5% |
| Immigrants | Dominican Republic | 0.0 /100 | #336 | Tragic 78.0% |
| Immigrants | Yemen | 0.0 /100 | #337 | Tragic 77.9% |
| Immigrants | Guatemala | 0.0 /100 | #338 | Tragic 77.9% |