West Indian vs Immigrants from Honduras 3 or more Vehicles in Household
COMPARE
West Indian
Immigrants from Honduras
3 or more Vehicles in Household
3 or more Vehicles in Household Comparison
West Indians
Immigrants from Honduras
13.7%
3 OR MORE VEHICLES IN HOUSEHOLD
0.0/ 100
METRIC RATING
330th/ 347
METRIC RANK
18.2%
3 OR MORE VEHICLES IN HOUSEHOLD
3.1/ 100
METRIC RATING
238th/ 347
METRIC RANK
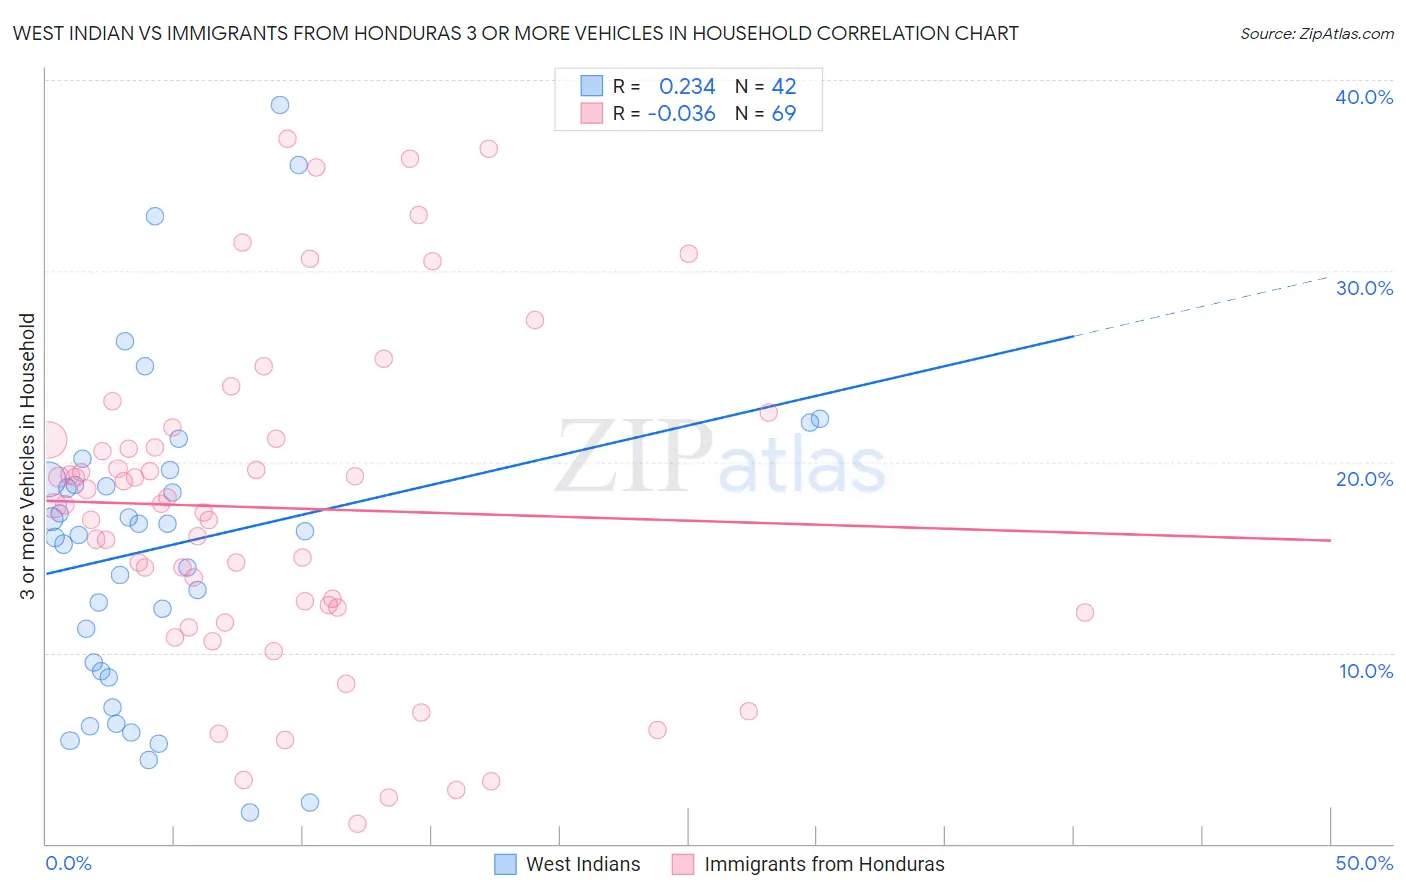
West Indian vs Immigrants from Honduras 3 or more Vehicles in Household Correlation Chart
The statistical analysis conducted on geographies consisting of 253,795,615 people shows a weak positive correlation between the proportion of West Indians and percentage of households with 3 or more vehicles available in the United States with a correlation coefficient (R) of 0.234 and weighted average of 13.7%. Similarly, the statistical analysis conducted on geographies consisting of 322,444,199 people shows no correlation between the proportion of Immigrants from Honduras and percentage of households with 3 or more vehicles available in the United States with a correlation coefficient (R) of -0.036 and weighted average of 18.2%, a difference of 32.7%.
3 or more Vehicles in Household Correlation Summary
| Measurement | West Indian | Immigrants from Honduras |
| Minimum | 1.7% | 1.0% |
| Maximum | 38.7% | 36.9% |
| Range | 37.0% | 35.9% |
| Mean | 15.6% | 17.6% |
| Median | 16.3% | 17.7% |
| Interquartile 25% (IQ1) | 9.0% | 12.3% |
| Interquartile 75% (IQ3) | 19.1% | 21.2% |
| Interquartile Range (IQR) | 10.1% | 8.9% |
| Standard Deviation (Sample) | 8.4% | 8.6% |
| Standard Deviation (Population) | 8.3% | 8.5% |
Similar Demographics by 3 or more Vehicles in Household
Demographics Similar to West Indians by 3 or more Vehicles in Household
In terms of 3 or more vehicles in household, the demographic groups most similar to West Indians are Immigrants from Dominica (13.7%, a difference of 0.21%), Immigrants from Senegal (13.8%, a difference of 0.33%), Trinidadian and Tobagonian (13.6%, a difference of 0.93%), Immigrants from Cabo Verde (13.6%, a difference of 1.3%), and Immigrants from Albania (14.0%, a difference of 1.5%).
| Demographics | Rating | Rank | 3 or more Vehicles in Household |
| Immigrants | Caribbean | 0.0 /100 | #323 | Tragic 14.6% |
| Immigrants | Yemen | 0.0 /100 | #324 | Tragic 14.2% |
| Senegalese | 0.0 /100 | #325 | Tragic 14.2% |
| Soviet Union | 0.0 /100 | #326 | Tragic 14.2% |
| Ecuadorians | 0.0 /100 | #327 | Tragic 14.1% |
| Immigrants | Albania | 0.0 /100 | #328 | Tragic 14.0% |
| Immigrants | Senegal | 0.0 /100 | #329 | Tragic 13.8% |
| West Indians | 0.0 /100 | #330 | Tragic 13.7% |
| Immigrants | Dominica | 0.0 /100 | #331 | Tragic 13.7% |
| Trinidadians and Tobagonians | 0.0 /100 | #332 | Tragic 13.6% |
| Immigrants | Cabo Verde | 0.0 /100 | #333 | Tragic 13.6% |
| Immigrants | Ecuador | 0.0 /100 | #334 | Tragic 13.4% |
| Immigrants | Trinidad and Tobago | 0.0 /100 | #335 | Tragic 13.3% |
| Barbadians | 0.0 /100 | #336 | Tragic 12.6% |
| Immigrants | Bangladesh | 0.0 /100 | #337 | Tragic 12.5% |
Demographics Similar to Immigrants from Honduras by 3 or more Vehicles in Household
In terms of 3 or more vehicles in household, the demographic groups most similar to Immigrants from Honduras are Immigrants from Middle Africa (18.2%, a difference of 0.010%), Immigrants from China (18.2%, a difference of 0.13%), Indonesian (18.3%, a difference of 0.23%), Immigrants from Malaysia (18.3%, a difference of 0.28%), and African (18.2%, a difference of 0.33%).
| Demographics | Rating | Rank | 3 or more Vehicles in Household |
| Immigrants | Belgium | 4.8 /100 | #231 | Tragic 18.4% |
| Immigrants | Uganda | 4.6 /100 | #232 | Tragic 18.4% |
| Hondurans | 4.6 /100 | #233 | Tragic 18.4% |
| Immigrants | North Macedonia | 4.4 /100 | #234 | Tragic 18.4% |
| Sierra Leoneans | 3.9 /100 | #235 | Tragic 18.3% |
| Immigrants | Malaysia | 3.6 /100 | #236 | Tragic 18.3% |
| Indonesians | 3.5 /100 | #237 | Tragic 18.3% |
| Immigrants | Honduras | 3.1 /100 | #238 | Tragic 18.2% |
| Immigrants | Middle Africa | 3.1 /100 | #239 | Tragic 18.2% |
| Immigrants | China | 2.9 /100 | #240 | Tragic 18.2% |
| Africans | 2.7 /100 | #241 | Tragic 18.2% |
| Hopi | 2.5 /100 | #242 | Tragic 18.2% |
| Immigrants | Europe | 2.4 /100 | #243 | Tragic 18.1% |
| Mongolians | 2.3 /100 | #244 | Tragic 18.1% |
| Immigrants | Belize | 2.1 /100 | #245 | Tragic 18.1% |