Immigrants from Jordan vs Jordanian 3 or more Vehicles in Household
COMPARE
Immigrants from Jordan
Jordanian
3 or more Vehicles in Household
3 or more Vehicles in Household Comparison
Immigrants from Jordan
Jordanians
19.9%
3 OR MORE VEHICLES IN HOUSEHOLD
75.0/ 100
METRIC RATING
154th/ 347
METRIC RANK
20.1%
3 OR MORE VEHICLES IN HOUSEHOLD
84.4/ 100
METRIC RATING
142nd/ 347
METRIC RANK
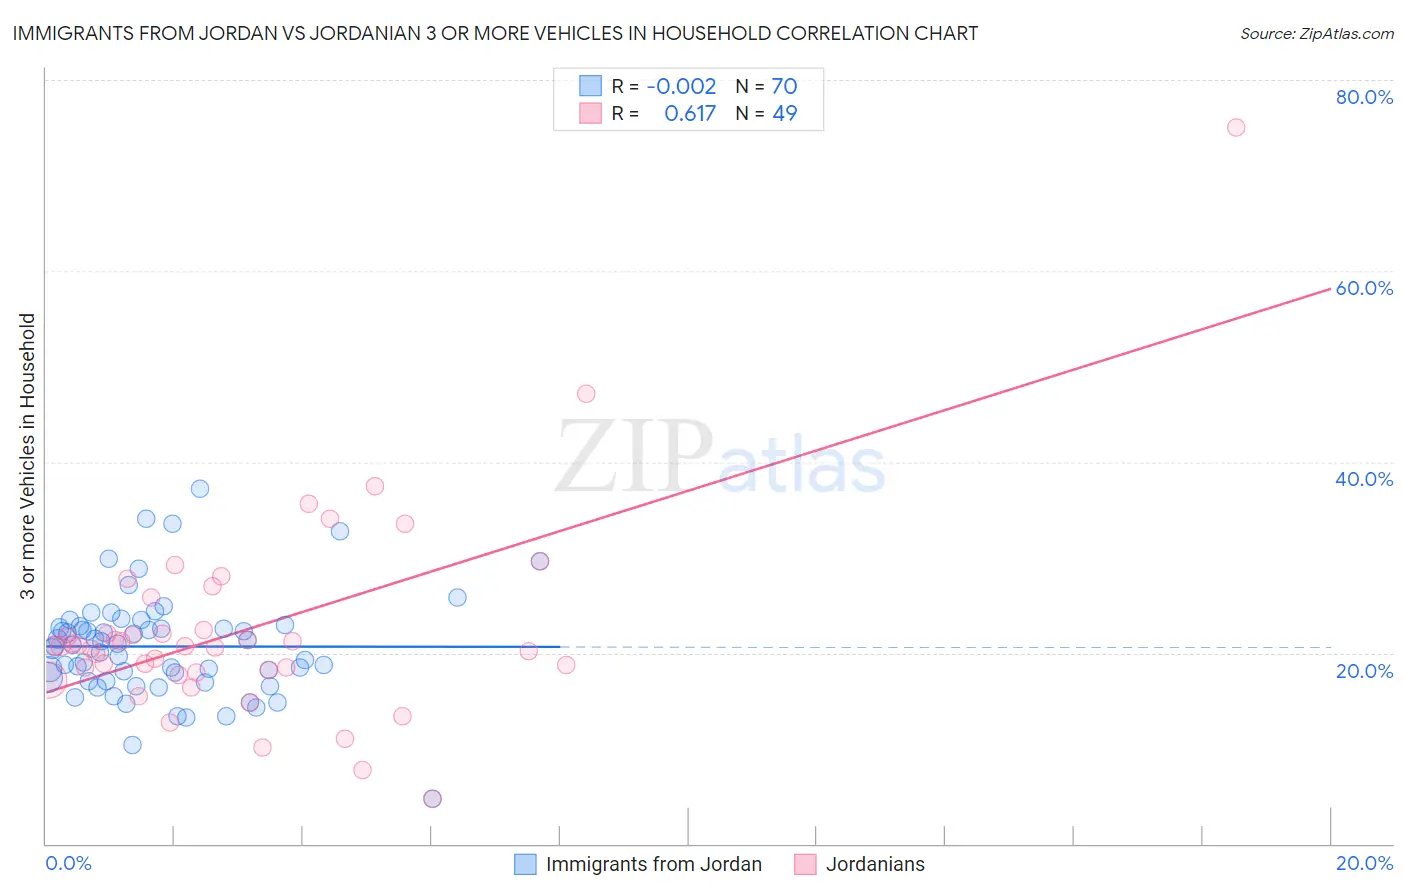
Immigrants from Jordan vs Jordanian 3 or more Vehicles in Household Correlation Chart
The statistical analysis conducted on geographies consisting of 181,207,315 people shows no correlation between the proportion of Immigrants from Jordan and percentage of households with 3 or more vehicles available in the United States with a correlation coefficient (R) of -0.002 and weighted average of 19.9%. Similarly, the statistical analysis conducted on geographies consisting of 166,358,031 people shows a significant positive correlation between the proportion of Jordanians and percentage of households with 3 or more vehicles available in the United States with a correlation coefficient (R) of 0.617 and weighted average of 20.1%, a difference of 1.1%.
3 or more Vehicles in Household Correlation Summary
| Measurement | Immigrants from Jordan | Jordanian |
| Minimum | 4.7% | 4.7% |
| Maximum | 37.1% | 75.0% |
| Range | 32.4% | 70.3% |
| Mean | 20.7% | 22.4% |
| Median | 20.8% | 20.7% |
| Interquartile 25% (IQ1) | 17.0% | 18.0% |
| Interquartile 75% (IQ3) | 22.8% | 24.1% |
| Interquartile Range (IQR) | 5.8% | 6.0% |
| Standard Deviation (Sample) | 5.5% | 10.8% |
| Standard Deviation (Population) | 5.5% | 10.7% |
Demographics Similar to Immigrants from Jordan and Jordanians by 3 or more Vehicles in Household
In terms of 3 or more vehicles in household, the demographic groups most similar to Immigrants from Jordan are Yuman (19.9%, a difference of 0.060%), Tlingit-Haida (19.9%, a difference of 0.15%), Thai (19.8%, a difference of 0.37%), Hungarian (19.8%, a difference of 0.42%), and Lebanese (20.0%, a difference of 0.51%). Similarly, the demographic groups most similar to Jordanians are Lithuanian (20.1%, a difference of 0.0%), Ottawa (20.1%, a difference of 0.060%), Iranian (20.1%, a difference of 0.060%), Palestinian (20.1%, a difference of 0.070%), and Australian (20.1%, a difference of 0.11%).
| Demographics | Rating | Rank | 3 or more Vehicles in Household |
| Aleuts | 86.3 /100 | #138 | Excellent 20.2% |
| Slovenes | 85.5 /100 | #139 | Excellent 20.2% |
| French American Indians | 85.3 /100 | #140 | Excellent 20.1% |
| Ottawa | 84.9 /100 | #141 | Excellent 20.1% |
| Jordanians | 84.4 /100 | #142 | Excellent 20.1% |
| Lithuanians | 84.4 /100 | #143 | Excellent 20.1% |
| Iranians | 84.0 /100 | #144 | Excellent 20.1% |
| Palestinians | 83.9 /100 | #145 | Excellent 20.1% |
| Australians | 83.6 /100 | #146 | Excellent 20.1% |
| Slovaks | 83.0 /100 | #147 | Excellent 20.1% |
| Guatemalans | 82.6 /100 | #148 | Excellent 20.1% |
| Immigrants | Iran | 80.9 /100 | #149 | Excellent 20.0% |
| Immigrants | Immigrants | 80.8 /100 | #150 | Excellent 20.0% |
| Taiwanese | 80.6 /100 | #151 | Excellent 20.0% |
| Lebanese | 79.8 /100 | #152 | Good 20.0% |
| Yuman | 75.6 /100 | #153 | Good 19.9% |
| Immigrants | Jordan | 75.0 /100 | #154 | Good 19.9% |
| Tlingit-Haida | 73.4 /100 | #155 | Good 19.9% |
| Thais | 71.1 /100 | #156 | Good 19.8% |
| Hungarians | 70.5 /100 | #157 | Good 19.8% |
| Armenians | 68.8 /100 | #158 | Good 19.8% |