Immigrants from Jordan vs Carpatho Rusyn 3 or more Vehicles in Household
COMPARE
Immigrants from Jordan
Carpatho Rusyn
3 or more Vehicles in Household
3 or more Vehicles in Household Comparison
Immigrants from Jordan
Carpatho Rusyns
19.9%
3 OR MORE VEHICLES IN HOUSEHOLD
75.0/ 100
METRIC RATING
154th/ 347
METRIC RANK
18.0%
3 OR MORE VEHICLES IN HOUSEHOLD
1.9/ 100
METRIC RATING
247th/ 347
METRIC RANK
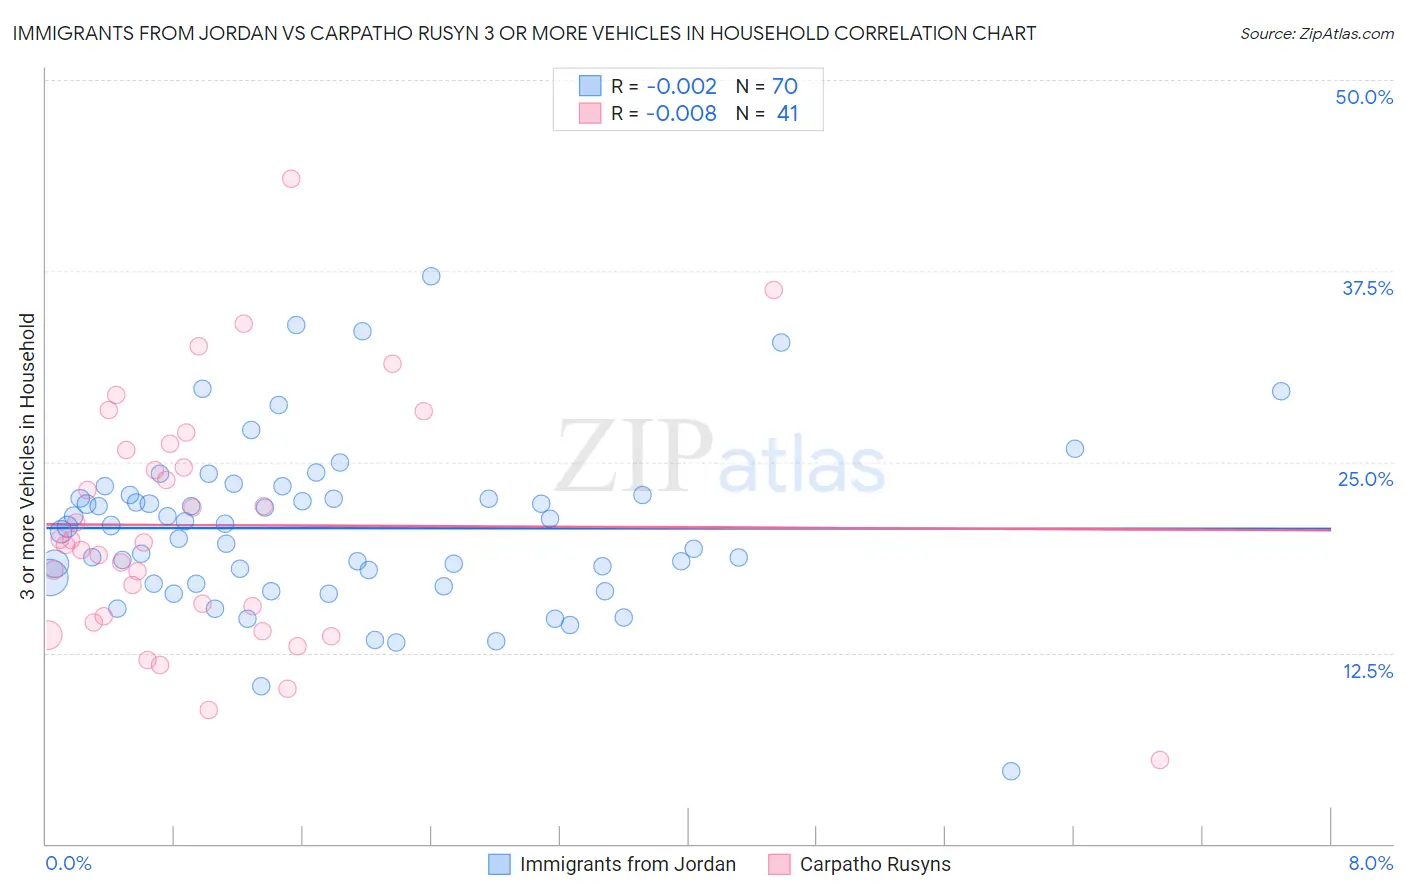
Immigrants from Jordan vs Carpatho Rusyn 3 or more Vehicles in Household Correlation Chart
The statistical analysis conducted on geographies consisting of 181,207,315 people shows no correlation between the proportion of Immigrants from Jordan and percentage of households with 3 or more vehicles available in the United States with a correlation coefficient (R) of -0.002 and weighted average of 19.9%. Similarly, the statistical analysis conducted on geographies consisting of 58,865,227 people shows no correlation between the proportion of Carpatho Rusyns and percentage of households with 3 or more vehicles available in the United States with a correlation coefficient (R) of -0.008 and weighted average of 18.0%, a difference of 10.3%.
3 or more Vehicles in Household Correlation Summary
| Measurement | Immigrants from Jordan | Carpatho Rusyn |
| Minimum | 4.7% | 5.5% |
| Maximum | 37.1% | 43.5% |
| Range | 32.4% | 38.0% |
| Mean | 20.7% | 20.9% |
| Median | 20.8% | 19.7% |
| Interquartile 25% (IQ1) | 17.0% | 14.7% |
| Interquartile 75% (IQ3) | 22.8% | 26.0% |
| Interquartile Range (IQR) | 5.8% | 11.3% |
| Standard Deviation (Sample) | 5.5% | 8.0% |
| Standard Deviation (Population) | 5.5% | 7.9% |
Similar Demographics by 3 or more Vehicles in Household
Demographics Similar to Immigrants from Jordan by 3 or more Vehicles in Household
In terms of 3 or more vehicles in household, the demographic groups most similar to Immigrants from Jordan are Yuman (19.9%, a difference of 0.060%), Tlingit-Haida (19.9%, a difference of 0.15%), Thai (19.8%, a difference of 0.37%), Hungarian (19.8%, a difference of 0.42%), and Lebanese (20.0%, a difference of 0.51%).
| Demographics | Rating | Rank | 3 or more Vehicles in Household |
| Slovaks | 83.0 /100 | #147 | Excellent 20.1% |
| Guatemalans | 82.6 /100 | #148 | Excellent 20.1% |
| Immigrants | Iran | 80.9 /100 | #149 | Excellent 20.0% |
| Immigrants | Immigrants | 80.8 /100 | #150 | Excellent 20.0% |
| Taiwanese | 80.6 /100 | #151 | Excellent 20.0% |
| Lebanese | 79.8 /100 | #152 | Good 20.0% |
| Yuman | 75.6 /100 | #153 | Good 19.9% |
| Immigrants | Jordan | 75.0 /100 | #154 | Good 19.9% |
| Tlingit-Haida | 73.4 /100 | #155 | Good 19.9% |
| Thais | 71.1 /100 | #156 | Good 19.8% |
| Hungarians | 70.5 /100 | #157 | Good 19.8% |
| Armenians | 68.8 /100 | #158 | Good 19.8% |
| Immigrants | Pakistan | 68.2 /100 | #159 | Good 19.8% |
| Immigrants | Lebanon | 67.6 /100 | #160 | Good 19.8% |
| Immigrants | Guatemala | 65.6 /100 | #161 | Good 19.7% |
Demographics Similar to Carpatho Rusyns by 3 or more Vehicles in Household
In terms of 3 or more vehicles in household, the demographic groups most similar to Carpatho Rusyns are Immigrants from Eastern Africa (18.0%, a difference of 0.13%), Immigrants from Australia (18.1%, a difference of 0.16%), Immigrants from Saudi Arabia (18.0%, a difference of 0.19%), Venezuelan (18.0%, a difference of 0.21%), and Immigrants from Belize (18.1%, a difference of 0.23%).
| Demographics | Rating | Rank | 3 or more Vehicles in Household |
| Immigrants | China | 2.9 /100 | #240 | Tragic 18.2% |
| Africans | 2.7 /100 | #241 | Tragic 18.2% |
| Hopi | 2.5 /100 | #242 | Tragic 18.2% |
| Immigrants | Europe | 2.4 /100 | #243 | Tragic 18.1% |
| Mongolians | 2.3 /100 | #244 | Tragic 18.1% |
| Immigrants | Belize | 2.1 /100 | #245 | Tragic 18.1% |
| Immigrants | Australia | 2.0 /100 | #246 | Tragic 18.1% |
| Carpatho Rusyns | 1.9 /100 | #247 | Tragic 18.0% |
| Immigrants | Eastern Africa | 1.8 /100 | #248 | Tragic 18.0% |
| Immigrants | Saudi Arabia | 1.7 /100 | #249 | Tragic 18.0% |
| Venezuelans | 1.7 /100 | #250 | Tragic 18.0% |
| Alsatians | 1.5 /100 | #251 | Tragic 18.0% |
| Immigrants | Southern Europe | 1.4 /100 | #252 | Tragic 17.9% |
| Immigrants | Ethiopia | 1.3 /100 | #253 | Tragic 17.9% |
| Ethiopians | 1.2 /100 | #254 | Tragic 17.9% |