Immigrants from Jordan vs White/Caucasian 3 or more Vehicles in Household
COMPARE
Immigrants from Jordan
White/Caucasian
3 or more Vehicles in Household
3 or more Vehicles in Household Comparison
Immigrants from Jordan
Whites/Caucasians
19.9%
3 OR MORE VEHICLES IN HOUSEHOLD
75.0/ 100
METRIC RATING
154th/ 347
METRIC RANK
22.6%
3 OR MORE VEHICLES IN HOUSEHOLD
100.0/ 100
METRIC RATING
51st/ 347
METRIC RANK
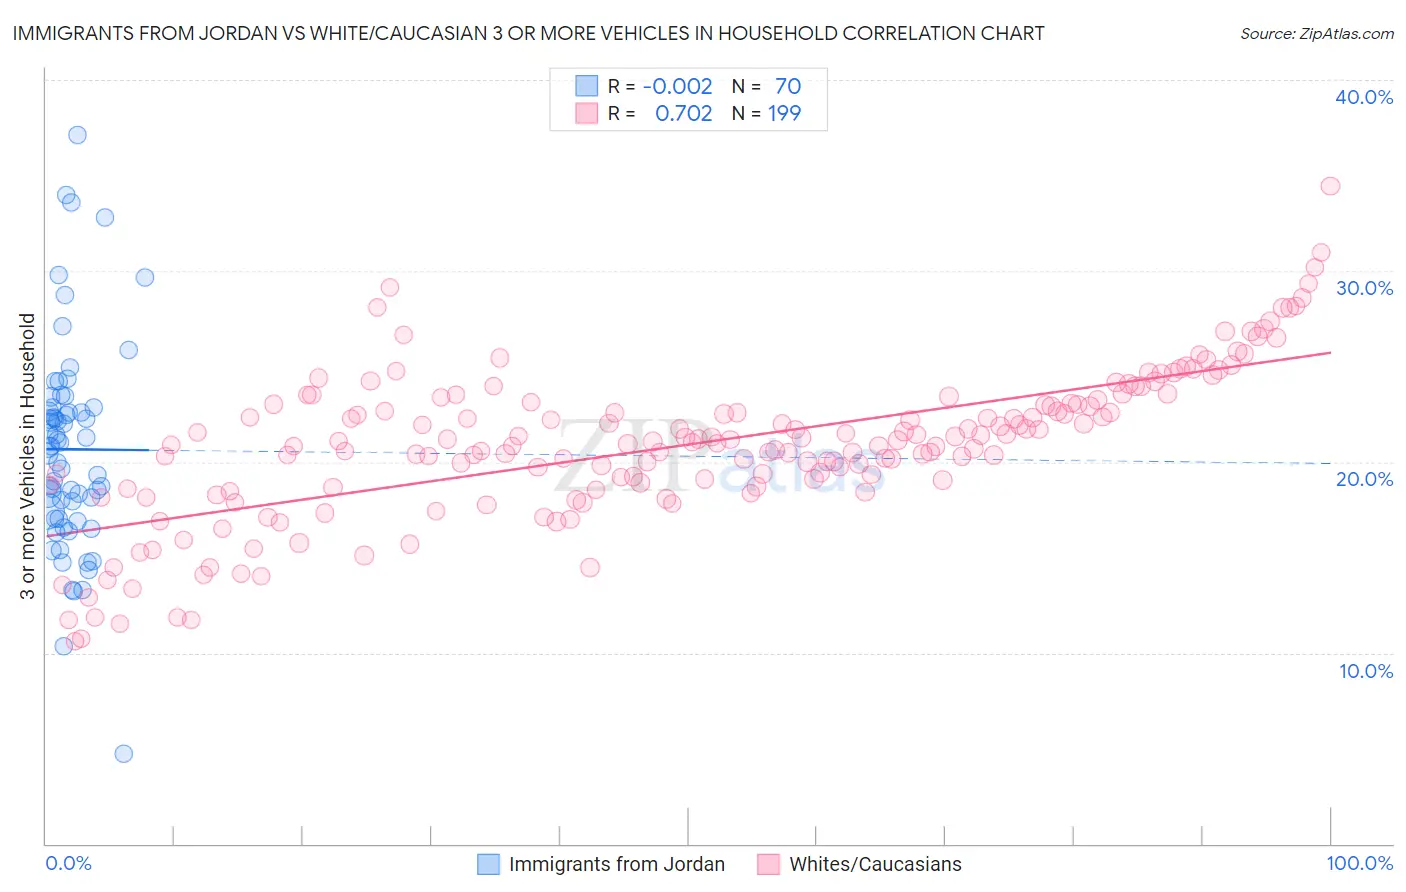
Immigrants from Jordan vs White/Caucasian 3 or more Vehicles in Household Correlation Chart
The statistical analysis conducted on geographies consisting of 181,207,315 people shows no correlation between the proportion of Immigrants from Jordan and percentage of households with 3 or more vehicles available in the United States with a correlation coefficient (R) of -0.002 and weighted average of 19.9%. Similarly, the statistical analysis conducted on geographies consisting of 571,274,380 people shows a strong positive correlation between the proportion of Whites/Caucasians and percentage of households with 3 or more vehicles available in the United States with a correlation coefficient (R) of 0.702 and weighted average of 22.6%, a difference of 13.4%.
3 or more Vehicles in Household Correlation Summary
| Measurement | Immigrants from Jordan | White/Caucasian |
| Minimum | 4.7% | 10.6% |
| Maximum | 37.1% | 34.4% |
| Range | 32.4% | 23.8% |
| Mean | 20.7% | 20.9% |
| Median | 20.8% | 21.1% |
| Interquartile 25% (IQ1) | 17.0% | 18.8% |
| Interquartile 75% (IQ3) | 22.8% | 23.1% |
| Interquartile Range (IQR) | 5.8% | 4.3% |
| Standard Deviation (Sample) | 5.5% | 4.0% |
| Standard Deviation (Population) | 5.5% | 4.0% |
Similar Demographics by 3 or more Vehicles in Household
Demographics Similar to Immigrants from Jordan by 3 or more Vehicles in Household
In terms of 3 or more vehicles in household, the demographic groups most similar to Immigrants from Jordan are Yuman (19.9%, a difference of 0.060%), Tlingit-Haida (19.9%, a difference of 0.15%), Thai (19.8%, a difference of 0.37%), Hungarian (19.8%, a difference of 0.42%), and Lebanese (20.0%, a difference of 0.51%).
| Demographics | Rating | Rank | 3 or more Vehicles in Household |
| Slovaks | 83.0 /100 | #147 | Excellent 20.1% |
| Guatemalans | 82.6 /100 | #148 | Excellent 20.1% |
| Immigrants | Iran | 80.9 /100 | #149 | Excellent 20.0% |
| Immigrants | Immigrants | 80.8 /100 | #150 | Excellent 20.0% |
| Taiwanese | 80.6 /100 | #151 | Excellent 20.0% |
| Lebanese | 79.8 /100 | #152 | Good 20.0% |
| Yuman | 75.6 /100 | #153 | Good 19.9% |
| Immigrants | Jordan | 75.0 /100 | #154 | Good 19.9% |
| Tlingit-Haida | 73.4 /100 | #155 | Good 19.9% |
| Thais | 71.1 /100 | #156 | Good 19.8% |
| Hungarians | 70.5 /100 | #157 | Good 19.8% |
| Armenians | 68.8 /100 | #158 | Good 19.8% |
| Immigrants | Pakistan | 68.2 /100 | #159 | Good 19.8% |
| Immigrants | Lebanon | 67.6 /100 | #160 | Good 19.8% |
| Immigrants | Guatemala | 65.6 /100 | #161 | Good 19.7% |
Demographics Similar to Whites/Caucasians by 3 or more Vehicles in Household
In terms of 3 or more vehicles in household, the demographic groups most similar to Whites/Caucasians are Sioux (22.6%, a difference of 0.010%), Welsh (22.6%, a difference of 0.040%), Scotch-Irish (22.6%, a difference of 0.060%), Scottish (22.6%, a difference of 0.17%), and Malaysian (22.6%, a difference of 0.18%).
| Demographics | Rating | Rank | 3 or more Vehicles in Household |
| Cheyenne | 100.0 /100 | #44 | Exceptional 22.7% |
| Ute | 100.0 /100 | #45 | Exceptional 22.7% |
| Americans | 100.0 /100 | #46 | Exceptional 22.6% |
| Malaysians | 100.0 /100 | #47 | Exceptional 22.6% |
| Scottish | 100.0 /100 | #48 | Exceptional 22.6% |
| Scotch-Irish | 100.0 /100 | #49 | Exceptional 22.6% |
| Sioux | 100.0 /100 | #50 | Exceptional 22.6% |
| Whites/Caucasians | 100.0 /100 | #51 | Exceptional 22.6% |
| Welsh | 100.0 /100 | #52 | Exceptional 22.6% |
| Czechs | 100.0 /100 | #53 | Exceptional 22.5% |
| Crow | 100.0 /100 | #54 | Exceptional 22.5% |
| Immigrants | Laos | 100.0 /100 | #55 | Exceptional 22.4% |
| Hispanics or Latinos | 100.0 /100 | #56 | Exceptional 22.4% |
| Pennsylvania Germans | 100.0 /100 | #57 | Exceptional 22.3% |
| Spaniards | 100.0 /100 | #58 | Exceptional 22.3% |