Immigrants from Taiwan vs Immigrants from Honduras 3 or more Vehicles in Household
COMPARE
Immigrants from Taiwan
Immigrants from Honduras
3 or more Vehicles in Household
3 or more Vehicles in Household Comparison
Immigrants from Taiwan
Immigrants from Honduras
22.1%
3 OR MORE VEHICLES IN HOUSEHOLD
99.9/ 100
METRIC RATING
64th/ 347
METRIC RANK
18.2%
3 OR MORE VEHICLES IN HOUSEHOLD
3.1/ 100
METRIC RATING
238th/ 347
METRIC RANK
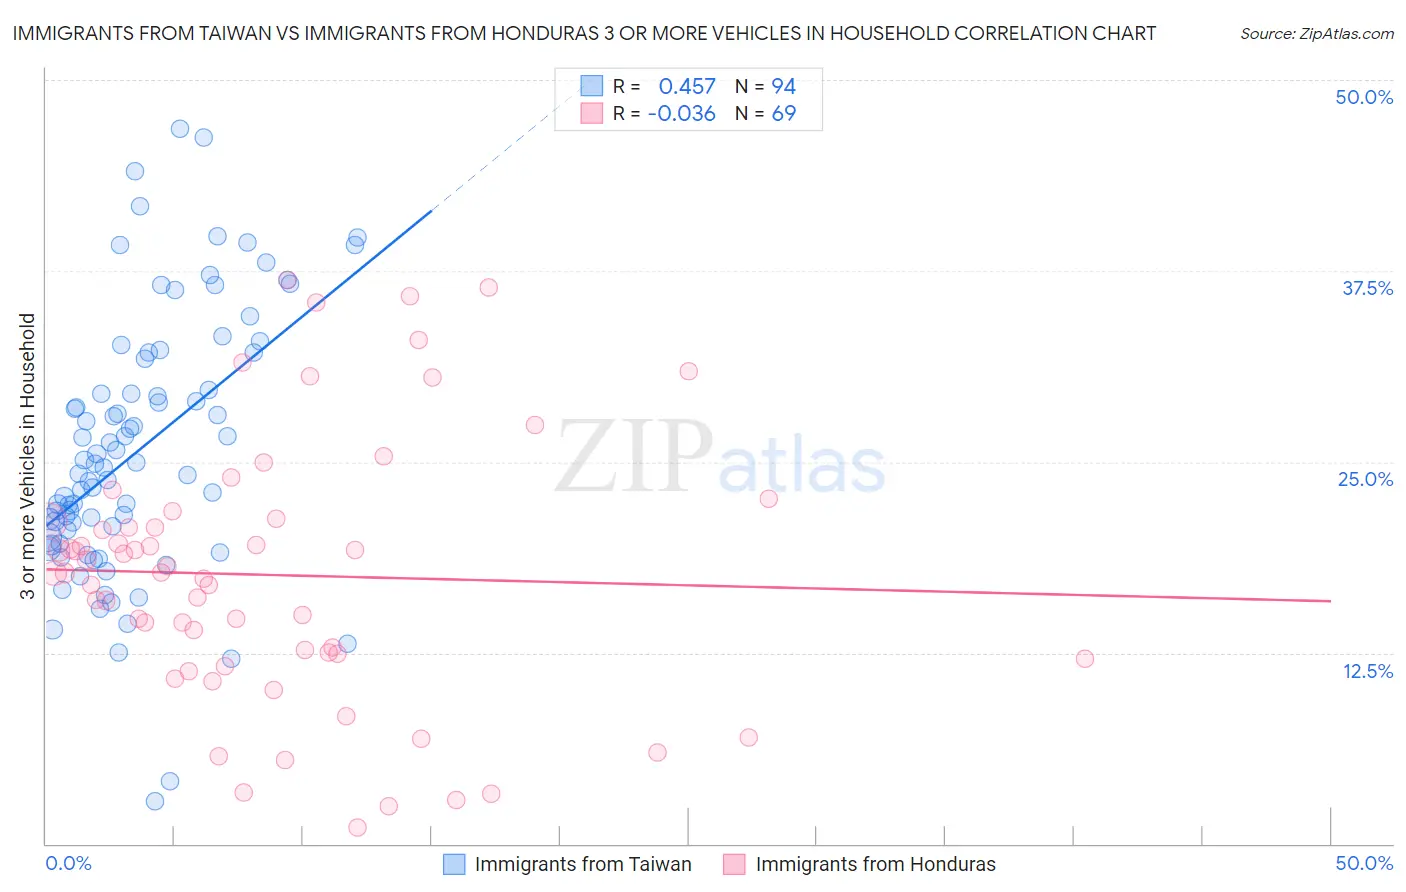
Immigrants from Taiwan vs Immigrants from Honduras 3 or more Vehicles in Household Correlation Chart
The statistical analysis conducted on geographies consisting of 298,037,283 people shows a moderate positive correlation between the proportion of Immigrants from Taiwan and percentage of households with 3 or more vehicles available in the United States with a correlation coefficient (R) of 0.457 and weighted average of 22.1%. Similarly, the statistical analysis conducted on geographies consisting of 322,444,199 people shows no correlation between the proportion of Immigrants from Honduras and percentage of households with 3 or more vehicles available in the United States with a correlation coefficient (R) of -0.036 and weighted average of 18.2%, a difference of 21.3%.
3 or more Vehicles in Household Correlation Summary
| Measurement | Immigrants from Taiwan | Immigrants from Honduras |
| Minimum | 2.7% | 1.0% |
| Maximum | 46.8% | 36.9% |
| Range | 44.0% | 35.9% |
| Mean | 25.8% | 17.6% |
| Median | 24.8% | 17.7% |
| Interquartile 25% (IQ1) | 20.1% | 12.3% |
| Interquartile 75% (IQ3) | 31.7% | 21.2% |
| Interquartile Range (IQR) | 11.6% | 8.9% |
| Standard Deviation (Sample) | 8.6% | 8.6% |
| Standard Deviation (Population) | 8.6% | 8.5% |
Similar Demographics by 3 or more Vehicles in Household
Demographics Similar to Immigrants from Taiwan by 3 or more Vehicles in Household
In terms of 3 or more vehicles in household, the demographic groups most similar to Immigrants from Taiwan are Chickasaw (22.2%, a difference of 0.33%), Pima (22.0%, a difference of 0.42%), Fijian (22.2%, a difference of 0.49%), Bhutanese (22.2%, a difference of 0.54%), and Northern European (22.0%, a difference of 0.56%).
| Demographics | Rating | Rank | 3 or more Vehicles in Household |
| Pennsylvania Germans | 100.0 /100 | #57 | Exceptional 22.3% |
| Spaniards | 100.0 /100 | #58 | Exceptional 22.3% |
| Navajo | 100.0 /100 | #59 | Exceptional 22.3% |
| Finns | 99.9 /100 | #60 | Exceptional 22.3% |
| Bhutanese | 99.9 /100 | #61 | Exceptional 22.2% |
| Fijians | 99.9 /100 | #62 | Exceptional 22.2% |
| Chickasaw | 99.9 /100 | #63 | Exceptional 22.2% |
| Immigrants | Taiwan | 99.9 /100 | #64 | Exceptional 22.1% |
| Pima | 99.9 /100 | #65 | Exceptional 22.0% |
| Northern Europeans | 99.9 /100 | #66 | Exceptional 22.0% |
| Alaskan Athabascans | 99.9 /100 | #67 | Exceptional 21.9% |
| British | 99.9 /100 | #68 | Exceptional 21.9% |
| Creek | 99.9 /100 | #69 | Exceptional 21.9% |
| Bangladeshis | 99.8 /100 | #70 | Exceptional 21.9% |
| Potawatomi | 99.8 /100 | #71 | Exceptional 21.9% |
Demographics Similar to Immigrants from Honduras by 3 or more Vehicles in Household
In terms of 3 or more vehicles in household, the demographic groups most similar to Immigrants from Honduras are Immigrants from Middle Africa (18.2%, a difference of 0.010%), Immigrants from China (18.2%, a difference of 0.13%), Indonesian (18.3%, a difference of 0.23%), Immigrants from Malaysia (18.3%, a difference of 0.28%), and African (18.2%, a difference of 0.33%).
| Demographics | Rating | Rank | 3 or more Vehicles in Household |
| Immigrants | Belgium | 4.8 /100 | #231 | Tragic 18.4% |
| Immigrants | Uganda | 4.6 /100 | #232 | Tragic 18.4% |
| Hondurans | 4.6 /100 | #233 | Tragic 18.4% |
| Immigrants | North Macedonia | 4.4 /100 | #234 | Tragic 18.4% |
| Sierra Leoneans | 3.9 /100 | #235 | Tragic 18.3% |
| Immigrants | Malaysia | 3.6 /100 | #236 | Tragic 18.3% |
| Indonesians | 3.5 /100 | #237 | Tragic 18.3% |
| Immigrants | Honduras | 3.1 /100 | #238 | Tragic 18.2% |
| Immigrants | Middle Africa | 3.1 /100 | #239 | Tragic 18.2% |
| Immigrants | China | 2.9 /100 | #240 | Tragic 18.2% |
| Africans | 2.7 /100 | #241 | Tragic 18.2% |
| Hopi | 2.5 /100 | #242 | Tragic 18.2% |
| Immigrants | Europe | 2.4 /100 | #243 | Tragic 18.1% |
| Mongolians | 2.3 /100 | #244 | Tragic 18.1% |
| Immigrants | Belize | 2.1 /100 | #245 | Tragic 18.1% |