Immigrants from Jordan vs Greek 3 or more Vehicles in Household
COMPARE
Immigrants from Jordan
Greek
3 or more Vehicles in Household
3 or more Vehicles in Household Comparison
Immigrants from Jordan
Greeks
19.9%
3 OR MORE VEHICLES IN HOUSEHOLD
75.0/ 100
METRIC RATING
154th/ 347
METRIC RANK
20.3%
3 OR MORE VEHICLES IN HOUSEHOLD
88.6/ 100
METRIC RATING
130th/ 347
METRIC RANK
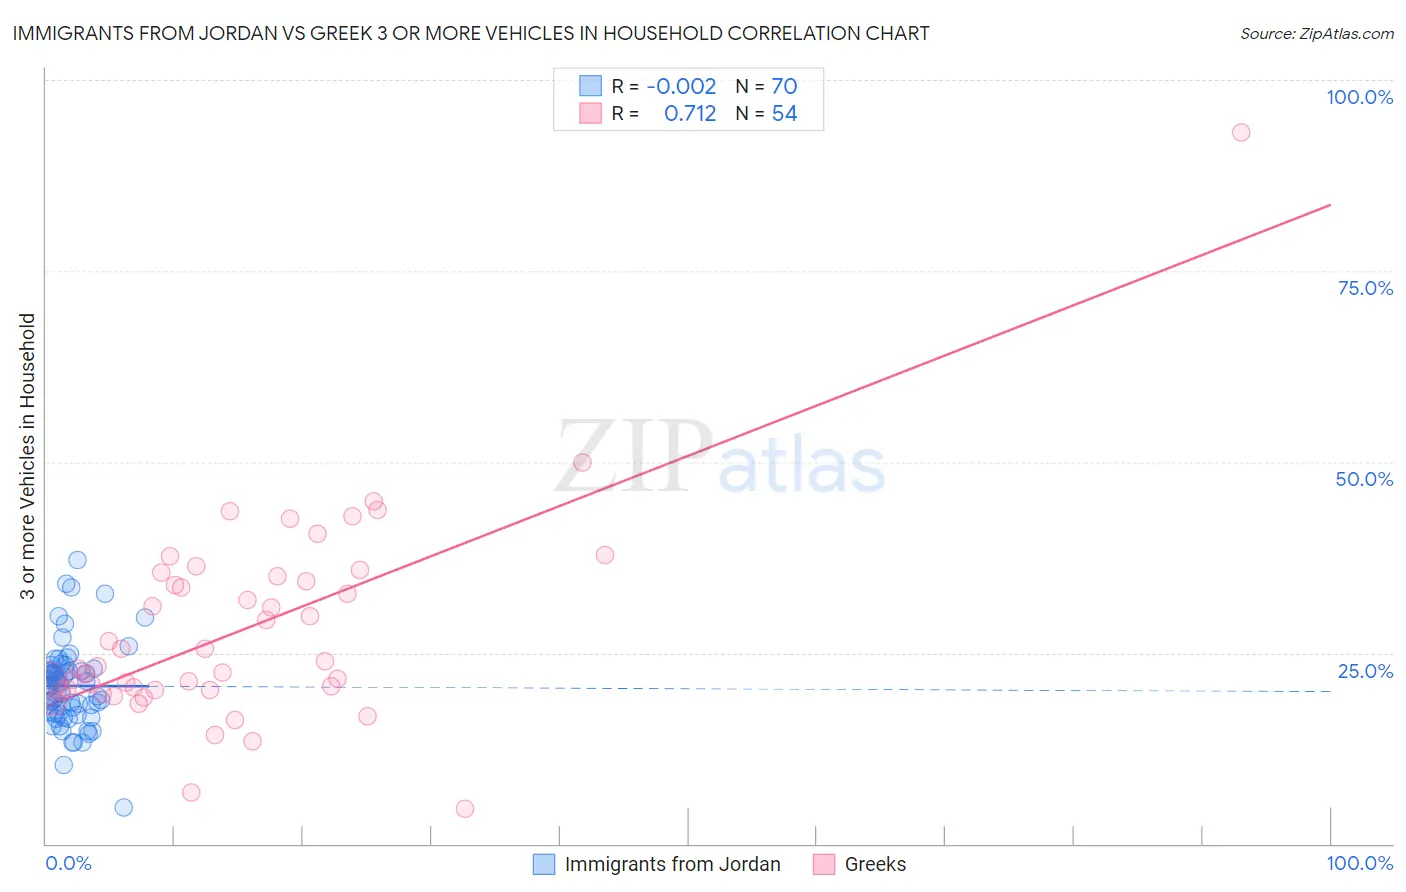
Immigrants from Jordan vs Greek 3 or more Vehicles in Household Correlation Chart
The statistical analysis conducted on geographies consisting of 181,207,315 people shows no correlation between the proportion of Immigrants from Jordan and percentage of households with 3 or more vehicles available in the United States with a correlation coefficient (R) of -0.002 and weighted average of 19.9%. Similarly, the statistical analysis conducted on geographies consisting of 482,172,821 people shows a strong positive correlation between the proportion of Greeks and percentage of households with 3 or more vehicles available in the United States with a correlation coefficient (R) of 0.712 and weighted average of 20.3%, a difference of 1.8%.
3 or more Vehicles in Household Correlation Summary
| Measurement | Immigrants from Jordan | Greek |
| Minimum | 4.7% | 4.5% |
| Maximum | 37.1% | 93.1% |
| Range | 32.4% | 88.5% |
| Mean | 20.7% | 28.0% |
| Median | 20.8% | 23.6% |
| Interquartile 25% (IQ1) | 17.0% | 20.1% |
| Interquartile 75% (IQ3) | 22.8% | 35.0% |
| Interquartile Range (IQR) | 5.8% | 14.8% |
| Standard Deviation (Sample) | 5.5% | 13.4% |
| Standard Deviation (Population) | 5.5% | 13.3% |
Similar Demographics by 3 or more Vehicles in Household
Demographics Similar to Immigrants from Jordan by 3 or more Vehicles in Household
In terms of 3 or more vehicles in household, the demographic groups most similar to Immigrants from Jordan are Yuman (19.9%, a difference of 0.060%), Tlingit-Haida (19.9%, a difference of 0.15%), Thai (19.8%, a difference of 0.37%), Hungarian (19.8%, a difference of 0.42%), and Lebanese (20.0%, a difference of 0.51%).
| Demographics | Rating | Rank | 3 or more Vehicles in Household |
| Slovaks | 83.0 /100 | #147 | Excellent 20.1% |
| Guatemalans | 82.6 /100 | #148 | Excellent 20.1% |
| Immigrants | Iran | 80.9 /100 | #149 | Excellent 20.0% |
| Immigrants | Immigrants | 80.8 /100 | #150 | Excellent 20.0% |
| Taiwanese | 80.6 /100 | #151 | Excellent 20.0% |
| Lebanese | 79.8 /100 | #152 | Good 20.0% |
| Yuman | 75.6 /100 | #153 | Good 19.9% |
| Immigrants | Jordan | 75.0 /100 | #154 | Good 19.9% |
| Tlingit-Haida | 73.4 /100 | #155 | Good 19.9% |
| Thais | 71.1 /100 | #156 | Good 19.8% |
| Hungarians | 70.5 /100 | #157 | Good 19.8% |
| Armenians | 68.8 /100 | #158 | Good 19.8% |
| Immigrants | Pakistan | 68.2 /100 | #159 | Good 19.8% |
| Immigrants | Lebanon | 67.6 /100 | #160 | Good 19.8% |
| Immigrants | Guatemala | 65.6 /100 | #161 | Good 19.7% |
Demographics Similar to Greeks by 3 or more Vehicles in Household
In terms of 3 or more vehicles in household, the demographic groups most similar to Greeks are Zimbabwean (20.3%, a difference of 0.030%), Immigrants from Asia (20.2%, a difference of 0.070%), Immigrants from Canada (20.2%, a difference of 0.13%), Immigrants from North America (20.2%, a difference of 0.13%), and Polish (20.2%, a difference of 0.22%).
| Demographics | Rating | Rank | 3 or more Vehicles in Household |
| Immigrants | Korea | 93.7 /100 | #123 | Exceptional 20.5% |
| Central Americans | 93.1 /100 | #124 | Exceptional 20.5% |
| Immigrants | Netherlands | 92.9 /100 | #125 | Exceptional 20.4% |
| Slavs | 92.1 /100 | #126 | Exceptional 20.4% |
| Immigrants | Bolivia | 92.0 /100 | #127 | Exceptional 20.4% |
| New Zealanders | 91.3 /100 | #128 | Exceptional 20.4% |
| Zimbabweans | 88.7 /100 | #129 | Excellent 20.3% |
| Greeks | 88.6 /100 | #130 | Excellent 20.3% |
| Immigrants | Asia | 88.1 /100 | #131 | Excellent 20.2% |
| Immigrants | Canada | 87.8 /100 | #132 | Excellent 20.2% |
| Immigrants | North America | 87.8 /100 | #133 | Excellent 20.2% |
| Poles | 87.3 /100 | #134 | Excellent 20.2% |
| Immigrants | India | 87.2 /100 | #135 | Excellent 20.2% |
| Immigrants | Nicaragua | 87.1 /100 | #136 | Excellent 20.2% |
| Immigrants | Iraq | 87.1 /100 | #137 | Excellent 20.2% |