Immigrants from Jordan vs Spaniard 3 or more Vehicles in Household
COMPARE
Immigrants from Jordan
Spaniard
3 or more Vehicles in Household
3 or more Vehicles in Household Comparison
Immigrants from Jordan
Spaniards
19.9%
3 OR MORE VEHICLES IN HOUSEHOLD
75.0/ 100
METRIC RATING
154th/ 347
METRIC RANK
22.3%
3 OR MORE VEHICLES IN HOUSEHOLD
100.0/ 100
METRIC RATING
58th/ 347
METRIC RANK
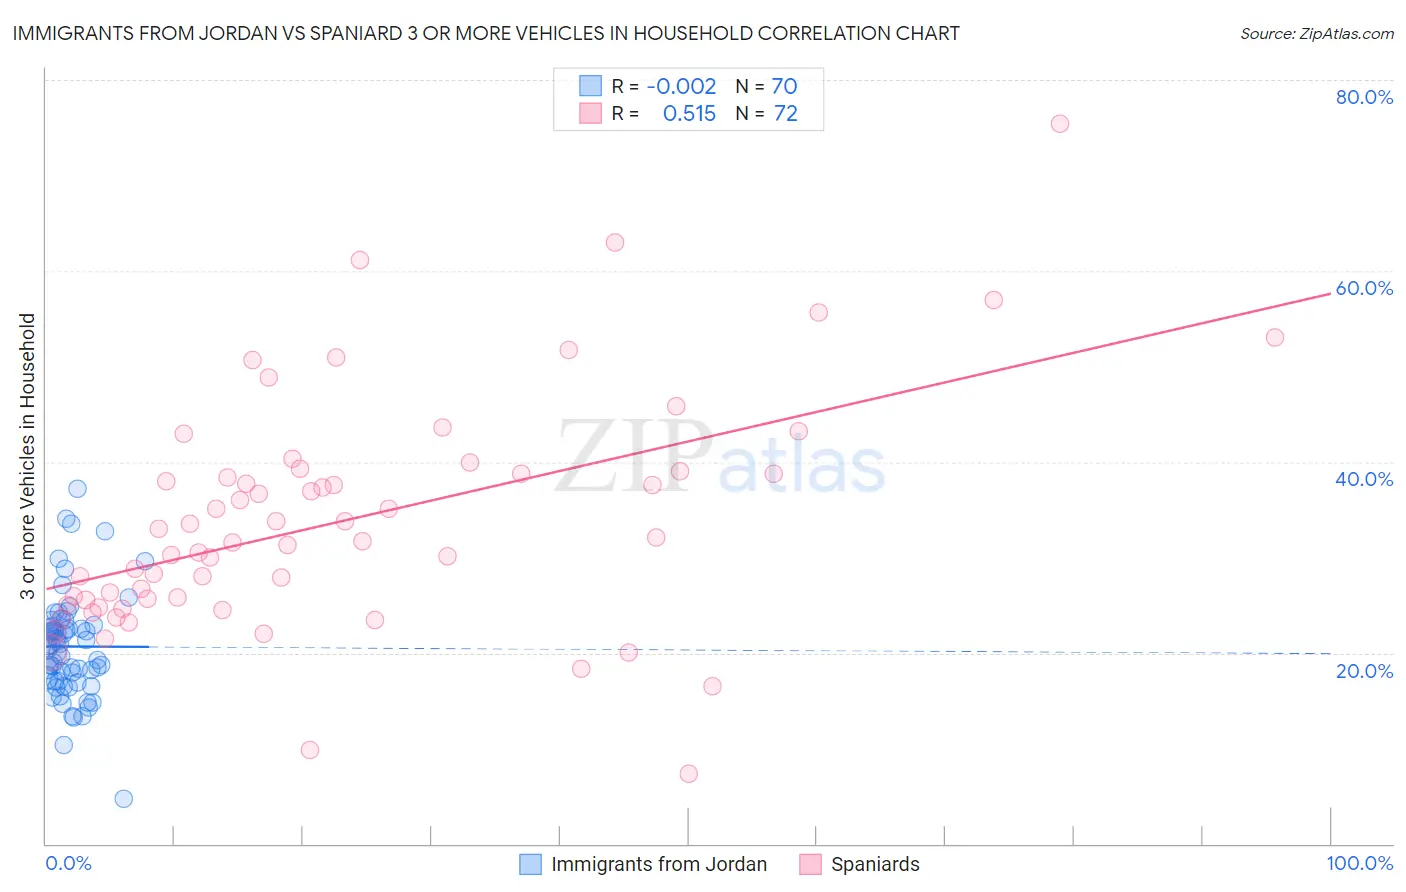
Immigrants from Jordan vs Spaniard 3 or more Vehicles in Household Correlation Chart
The statistical analysis conducted on geographies consisting of 181,207,315 people shows no correlation between the proportion of Immigrants from Jordan and percentage of households with 3 or more vehicles available in the United States with a correlation coefficient (R) of -0.002 and weighted average of 19.9%. Similarly, the statistical analysis conducted on geographies consisting of 443,028,178 people shows a substantial positive correlation between the proportion of Spaniards and percentage of households with 3 or more vehicles available in the United States with a correlation coefficient (R) of 0.515 and weighted average of 22.3%, a difference of 12.1%.
3 or more Vehicles in Household Correlation Summary
| Measurement | Immigrants from Jordan | Spaniard |
| Minimum | 4.7% | 7.3% |
| Maximum | 37.1% | 75.5% |
| Range | 32.4% | 68.2% |
| Mean | 20.7% | 33.9% |
| Median | 20.8% | 31.9% |
| Interquartile 25% (IQ1) | 17.0% | 25.3% |
| Interquartile 75% (IQ3) | 22.8% | 38.9% |
| Interquartile Range (IQR) | 5.8% | 13.6% |
| Standard Deviation (Sample) | 5.5% | 12.2% |
| Standard Deviation (Population) | 5.5% | 12.2% |
Similar Demographics by 3 or more Vehicles in Household
Demographics Similar to Immigrants from Jordan by 3 or more Vehicles in Household
In terms of 3 or more vehicles in household, the demographic groups most similar to Immigrants from Jordan are Yuman (19.9%, a difference of 0.060%), Tlingit-Haida (19.9%, a difference of 0.15%), Thai (19.8%, a difference of 0.37%), Hungarian (19.8%, a difference of 0.42%), and Lebanese (20.0%, a difference of 0.51%).
| Demographics | Rating | Rank | 3 or more Vehicles in Household |
| Slovaks | 83.0 /100 | #147 | Excellent 20.1% |
| Guatemalans | 82.6 /100 | #148 | Excellent 20.1% |
| Immigrants | Iran | 80.9 /100 | #149 | Excellent 20.0% |
| Immigrants | Immigrants | 80.8 /100 | #150 | Excellent 20.0% |
| Taiwanese | 80.6 /100 | #151 | Excellent 20.0% |
| Lebanese | 79.8 /100 | #152 | Good 20.0% |
| Yuman | 75.6 /100 | #153 | Good 19.9% |
| Immigrants | Jordan | 75.0 /100 | #154 | Good 19.9% |
| Tlingit-Haida | 73.4 /100 | #155 | Good 19.9% |
| Thais | 71.1 /100 | #156 | Good 19.8% |
| Hungarians | 70.5 /100 | #157 | Good 19.8% |
| Armenians | 68.8 /100 | #158 | Good 19.8% |
| Immigrants | Pakistan | 68.2 /100 | #159 | Good 19.8% |
| Immigrants | Lebanon | 67.6 /100 | #160 | Good 19.8% |
| Immigrants | Guatemala | 65.6 /100 | #161 | Good 19.7% |
Demographics Similar to Spaniards by 3 or more Vehicles in Household
In terms of 3 or more vehicles in household, the demographic groups most similar to Spaniards are Navajo (22.3%, a difference of 0.060%), Pennsylvania German (22.3%, a difference of 0.13%), Finnish (22.3%, a difference of 0.15%), Hispanic or Latino (22.4%, a difference of 0.29%), and Bhutanese (22.2%, a difference of 0.30%).
| Demographics | Rating | Rank | 3 or more Vehicles in Household |
| Whites/Caucasians | 100.0 /100 | #51 | Exceptional 22.6% |
| Welsh | 100.0 /100 | #52 | Exceptional 22.6% |
| Czechs | 100.0 /100 | #53 | Exceptional 22.5% |
| Crow | 100.0 /100 | #54 | Exceptional 22.5% |
| Immigrants | Laos | 100.0 /100 | #55 | Exceptional 22.4% |
| Hispanics or Latinos | 100.0 /100 | #56 | Exceptional 22.4% |
| Pennsylvania Germans | 100.0 /100 | #57 | Exceptional 22.3% |
| Spaniards | 100.0 /100 | #58 | Exceptional 22.3% |
| Navajo | 100.0 /100 | #59 | Exceptional 22.3% |
| Finns | 99.9 /100 | #60 | Exceptional 22.3% |
| Bhutanese | 99.9 /100 | #61 | Exceptional 22.2% |
| Fijians | 99.9 /100 | #62 | Exceptional 22.2% |
| Chickasaw | 99.9 /100 | #63 | Exceptional 22.2% |
| Immigrants | Taiwan | 99.9 /100 | #64 | Exceptional 22.1% |
| Pima | 99.9 /100 | #65 | Exceptional 22.0% |