Immigrants from Jordan vs Cape Verdean 3 or more Vehicles in Household
COMPARE
Immigrants from Jordan
Cape Verdean
3 or more Vehicles in Household
3 or more Vehicles in Household Comparison
Immigrants from Jordan
Cape Verdeans
19.9%
3 OR MORE VEHICLES IN HOUSEHOLD
75.0/ 100
METRIC RATING
154th/ 347
METRIC RANK
15.0%
3 OR MORE VEHICLES IN HOUSEHOLD
0.0/ 100
METRIC RATING
319th/ 347
METRIC RANK
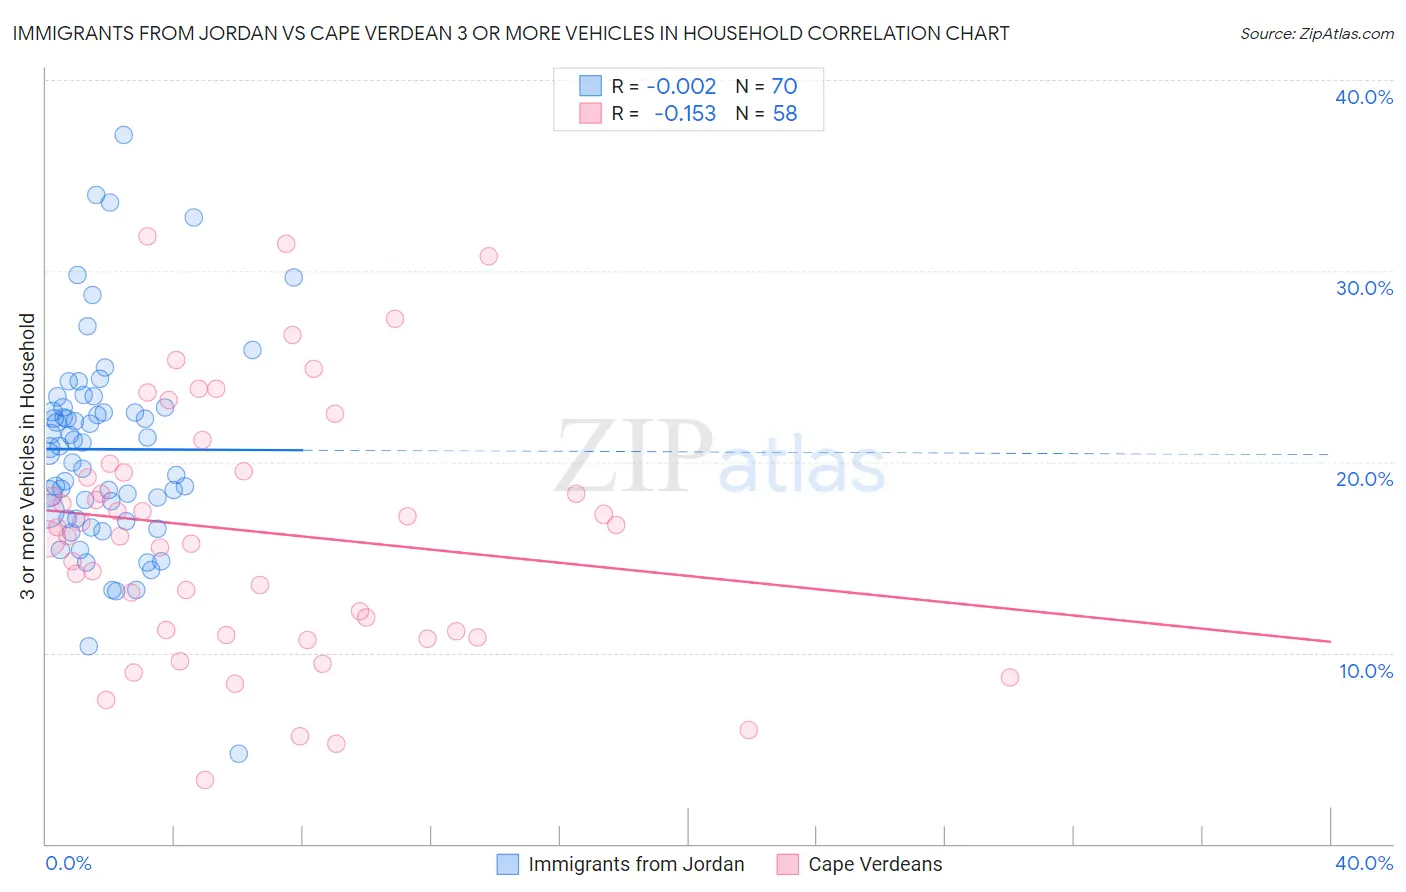
Immigrants from Jordan vs Cape Verdean 3 or more Vehicles in Household Correlation Chart
The statistical analysis conducted on geographies consisting of 181,207,315 people shows no correlation between the proportion of Immigrants from Jordan and percentage of households with 3 or more vehicles available in the United States with a correlation coefficient (R) of -0.002 and weighted average of 19.9%. Similarly, the statistical analysis conducted on geographies consisting of 107,543,887 people shows a poor negative correlation between the proportion of Cape Verdeans and percentage of households with 3 or more vehicles available in the United States with a correlation coefficient (R) of -0.153 and weighted average of 15.0%, a difference of 32.7%.
3 or more Vehicles in Household Correlation Summary
| Measurement | Immigrants from Jordan | Cape Verdean |
| Minimum | 4.7% | 3.3% |
| Maximum | 37.1% | 31.8% |
| Range | 32.4% | 28.5% |
| Mean | 20.7% | 16.4% |
| Median | 20.8% | 16.3% |
| Interquartile 25% (IQ1) | 17.0% | 11.2% |
| Interquartile 75% (IQ3) | 22.8% | 19.5% |
| Interquartile Range (IQR) | 5.8% | 8.4% |
| Standard Deviation (Sample) | 5.5% | 6.6% |
| Standard Deviation (Population) | 5.5% | 6.6% |
Similar Demographics by 3 or more Vehicles in Household
Demographics Similar to Immigrants from Jordan by 3 or more Vehicles in Household
In terms of 3 or more vehicles in household, the demographic groups most similar to Immigrants from Jordan are Yuman (19.9%, a difference of 0.060%), Tlingit-Haida (19.9%, a difference of 0.15%), Thai (19.8%, a difference of 0.37%), Hungarian (19.8%, a difference of 0.42%), and Lebanese (20.0%, a difference of 0.51%).
| Demographics | Rating | Rank | 3 or more Vehicles in Household |
| Slovaks | 83.0 /100 | #147 | Excellent 20.1% |
| Guatemalans | 82.6 /100 | #148 | Excellent 20.1% |
| Immigrants | Iran | 80.9 /100 | #149 | Excellent 20.0% |
| Immigrants | Immigrants | 80.8 /100 | #150 | Excellent 20.0% |
| Taiwanese | 80.6 /100 | #151 | Excellent 20.0% |
| Lebanese | 79.8 /100 | #152 | Good 20.0% |
| Yuman | 75.6 /100 | #153 | Good 19.9% |
| Immigrants | Jordan | 75.0 /100 | #154 | Good 19.9% |
| Tlingit-Haida | 73.4 /100 | #155 | Good 19.9% |
| Thais | 71.1 /100 | #156 | Good 19.8% |
| Hungarians | 70.5 /100 | #157 | Good 19.8% |
| Armenians | 68.8 /100 | #158 | Good 19.8% |
| Immigrants | Pakistan | 68.2 /100 | #159 | Good 19.8% |
| Immigrants | Lebanon | 67.6 /100 | #160 | Good 19.8% |
| Immigrants | Guatemala | 65.6 /100 | #161 | Good 19.7% |
Demographics Similar to Cape Verdeans by 3 or more Vehicles in Household
In terms of 3 or more vehicles in household, the demographic groups most similar to Cape Verdeans are Yup'ik (14.8%, a difference of 1.1%), Immigrants from Haiti (15.2%, a difference of 1.2%), Jamaican (15.2%, a difference of 1.4%), Immigrants from Jamaica (14.7%, a difference of 2.2%), and Immigrants from West Indies (14.6%, a difference of 2.5%).
| Demographics | Rating | Rank | 3 or more Vehicles in Household |
| Puerto Ricans | 0.0 /100 | #312 | Tragic 15.6% |
| Immigrants | Israel | 0.0 /100 | #313 | Tragic 15.6% |
| Immigrants | Belarus | 0.0 /100 | #314 | Tragic 15.5% |
| Haitians | 0.0 /100 | #315 | Tragic 15.5% |
| U.S. Virgin Islanders | 0.0 /100 | #316 | Tragic 15.4% |
| Jamaicans | 0.0 /100 | #317 | Tragic 15.2% |
| Immigrants | Haiti | 0.0 /100 | #318 | Tragic 15.2% |
| Cape Verdeans | 0.0 /100 | #319 | Tragic 15.0% |
| Yup'ik | 0.0 /100 | #320 | Tragic 14.8% |
| Immigrants | Jamaica | 0.0 /100 | #321 | Tragic 14.7% |
| Immigrants | West Indies | 0.0 /100 | #322 | Tragic 14.6% |
| Immigrants | Caribbean | 0.0 /100 | #323 | Tragic 14.6% |
| Immigrants | Yemen | 0.0 /100 | #324 | Tragic 14.2% |
| Senegalese | 0.0 /100 | #325 | Tragic 14.2% |
| Soviet Union | 0.0 /100 | #326 | Tragic 14.2% |