Immigrants from Jordan vs Immigrants from Thailand 3 or more Vehicles in Household
COMPARE
Immigrants from Jordan
Immigrants from Thailand
3 or more Vehicles in Household
3 or more Vehicles in Household Comparison
Immigrants from Jordan
Immigrants from Thailand
19.9%
3 OR MORE VEHICLES IN HOUSEHOLD
75.0/ 100
METRIC RATING
154th/ 347
METRIC RANK
20.5%
3 OR MORE VEHICLES IN HOUSEHOLD
93.8/ 100
METRIC RATING
121st/ 347
METRIC RANK
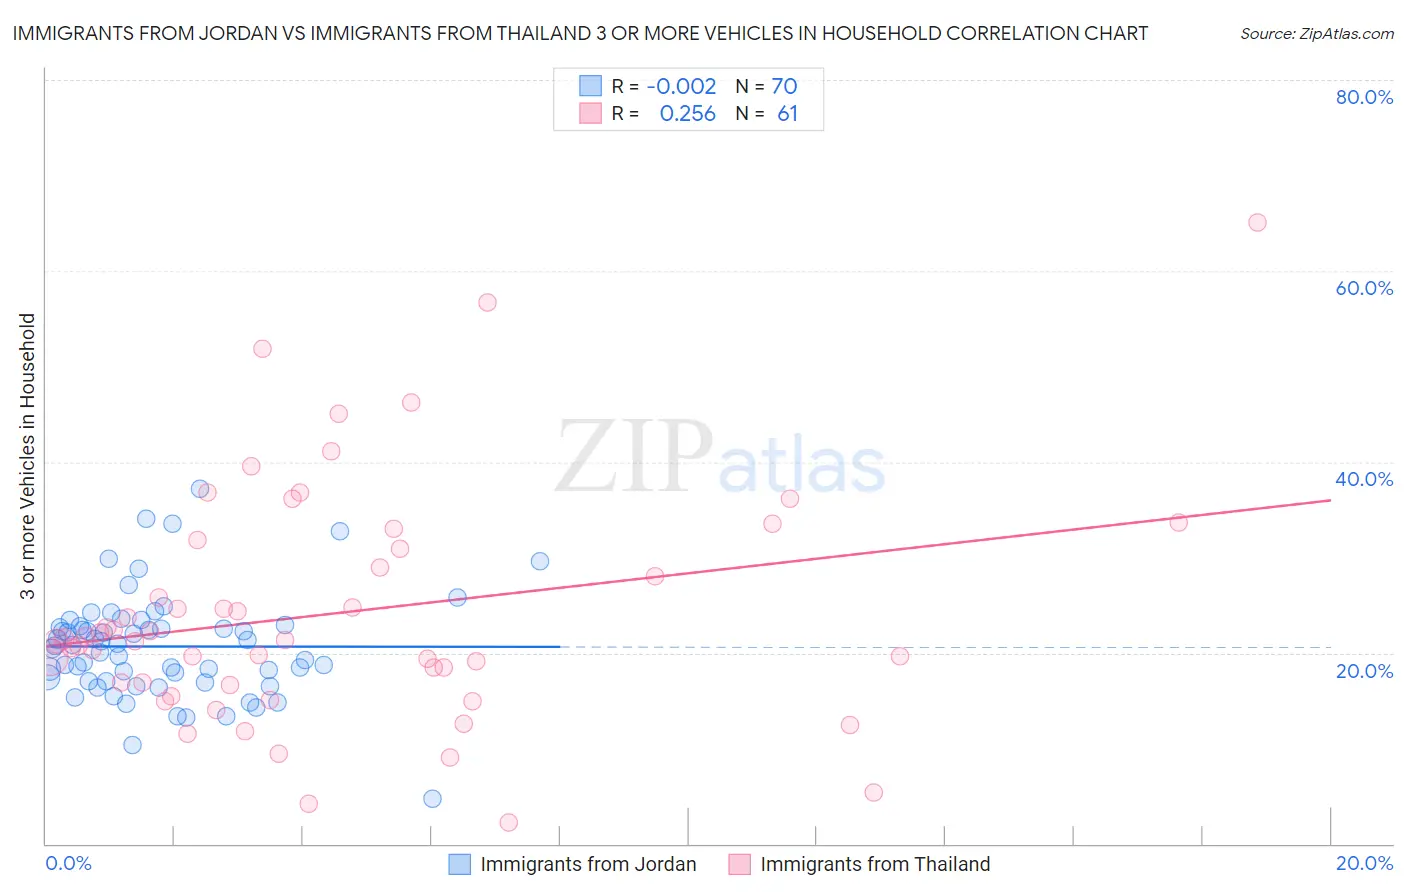
Immigrants from Jordan vs Immigrants from Thailand 3 or more Vehicles in Household Correlation Chart
The statistical analysis conducted on geographies consisting of 181,207,315 people shows no correlation between the proportion of Immigrants from Jordan and percentage of households with 3 or more vehicles available in the United States with a correlation coefficient (R) of -0.002 and weighted average of 19.9%. Similarly, the statistical analysis conducted on geographies consisting of 316,892,438 people shows a weak positive correlation between the proportion of Immigrants from Thailand and percentage of households with 3 or more vehicles available in the United States with a correlation coefficient (R) of 0.256 and weighted average of 20.5%, a difference of 3.0%.
3 or more Vehicles in Household Correlation Summary
| Measurement | Immigrants from Jordan | Immigrants from Thailand |
| Minimum | 4.7% | 2.3% |
| Maximum | 37.1% | 65.1% |
| Range | 32.4% | 62.9% |
| Mean | 20.7% | 24.2% |
| Median | 20.8% | 21.4% |
| Interquartile 25% (IQ1) | 17.0% | 16.7% |
| Interquartile 75% (IQ3) | 22.8% | 31.3% |
| Interquartile Range (IQR) | 5.8% | 14.6% |
| Standard Deviation (Sample) | 5.5% | 12.3% |
| Standard Deviation (Population) | 5.5% | 12.2% |
Similar Demographics by 3 or more Vehicles in Household
Demographics Similar to Immigrants from Jordan by 3 or more Vehicles in Household
In terms of 3 or more vehicles in household, the demographic groups most similar to Immigrants from Jordan are Yuman (19.9%, a difference of 0.060%), Tlingit-Haida (19.9%, a difference of 0.15%), Thai (19.8%, a difference of 0.37%), Hungarian (19.8%, a difference of 0.42%), and Lebanese (20.0%, a difference of 0.51%).
| Demographics | Rating | Rank | 3 or more Vehicles in Household |
| Slovaks | 83.0 /100 | #147 | Excellent 20.1% |
| Guatemalans | 82.6 /100 | #148 | Excellent 20.1% |
| Immigrants | Iran | 80.9 /100 | #149 | Excellent 20.0% |
| Immigrants | Immigrants | 80.8 /100 | #150 | Excellent 20.0% |
| Taiwanese | 80.6 /100 | #151 | Excellent 20.0% |
| Lebanese | 79.8 /100 | #152 | Good 20.0% |
| Yuman | 75.6 /100 | #153 | Good 19.9% |
| Immigrants | Jordan | 75.0 /100 | #154 | Good 19.9% |
| Tlingit-Haida | 73.4 /100 | #155 | Good 19.9% |
| Thais | 71.1 /100 | #156 | Good 19.8% |
| Hungarians | 70.5 /100 | #157 | Good 19.8% |
| Armenians | 68.8 /100 | #158 | Good 19.8% |
| Immigrants | Pakistan | 68.2 /100 | #159 | Good 19.8% |
| Immigrants | Lebanon | 67.6 /100 | #160 | Good 19.8% |
| Immigrants | Guatemala | 65.6 /100 | #161 | Good 19.7% |
Demographics Similar to Immigrants from Thailand by 3 or more Vehicles in Household
In terms of 3 or more vehicles in household, the demographic groups most similar to Immigrants from Thailand are Maltese (20.5%, a difference of 0.010%), German Russian (20.5%, a difference of 0.040%), Immigrants from Korea (20.5%, a difference of 0.050%), Immigrants from Latin America (20.5%, a difference of 0.21%), and Central American (20.5%, a difference of 0.22%).
| Demographics | Rating | Rank | 3 or more Vehicles in Household |
| Burmese | 95.8 /100 | #114 | Exceptional 20.6% |
| French Canadians | 95.0 /100 | #115 | Exceptional 20.6% |
| Italians | 94.9 /100 | #116 | Exceptional 20.6% |
| Croatians | 94.9 /100 | #117 | Exceptional 20.6% |
| Costa Ricans | 94.6 /100 | #118 | Exceptional 20.6% |
| Immigrants | Latin America | 94.5 /100 | #119 | Exceptional 20.5% |
| Maltese | 93.9 /100 | #120 | Exceptional 20.5% |
| Immigrants | Thailand | 93.8 /100 | #121 | Exceptional 20.5% |
| German Russians | 93.7 /100 | #122 | Exceptional 20.5% |
| Immigrants | Korea | 93.7 /100 | #123 | Exceptional 20.5% |
| Central Americans | 93.1 /100 | #124 | Exceptional 20.5% |
| Immigrants | Netherlands | 92.9 /100 | #125 | Exceptional 20.4% |
| Slavs | 92.1 /100 | #126 | Exceptional 20.4% |
| Immigrants | Bolivia | 92.0 /100 | #127 | Exceptional 20.4% |
| New Zealanders | 91.3 /100 | #128 | Exceptional 20.4% |