Native/Alaskan Unemployment
COMPARE
Native/Alaskan
Select to Compare
Unemployment
Native/Alaskan Unemployment
7.0%
UNEMPLOYMENT
0.0/ 100
METRIC RATING
325th/ 347
METRIC RANK
Native/Alaskan Unemployment Correlation Chart
The statistical analysis conducted on geographies consisting of 511,272,865 people shows a significant positive correlation between the proportion of Natives/Alaskans and unemployment in the United States with a correlation coefficient (R) of 0.682 and weighted average of 7.0%. On average, for every 1% (one percent) increase in Natives/Alaskans within a typical geography, there is an increase of 0.13% in unemployment.
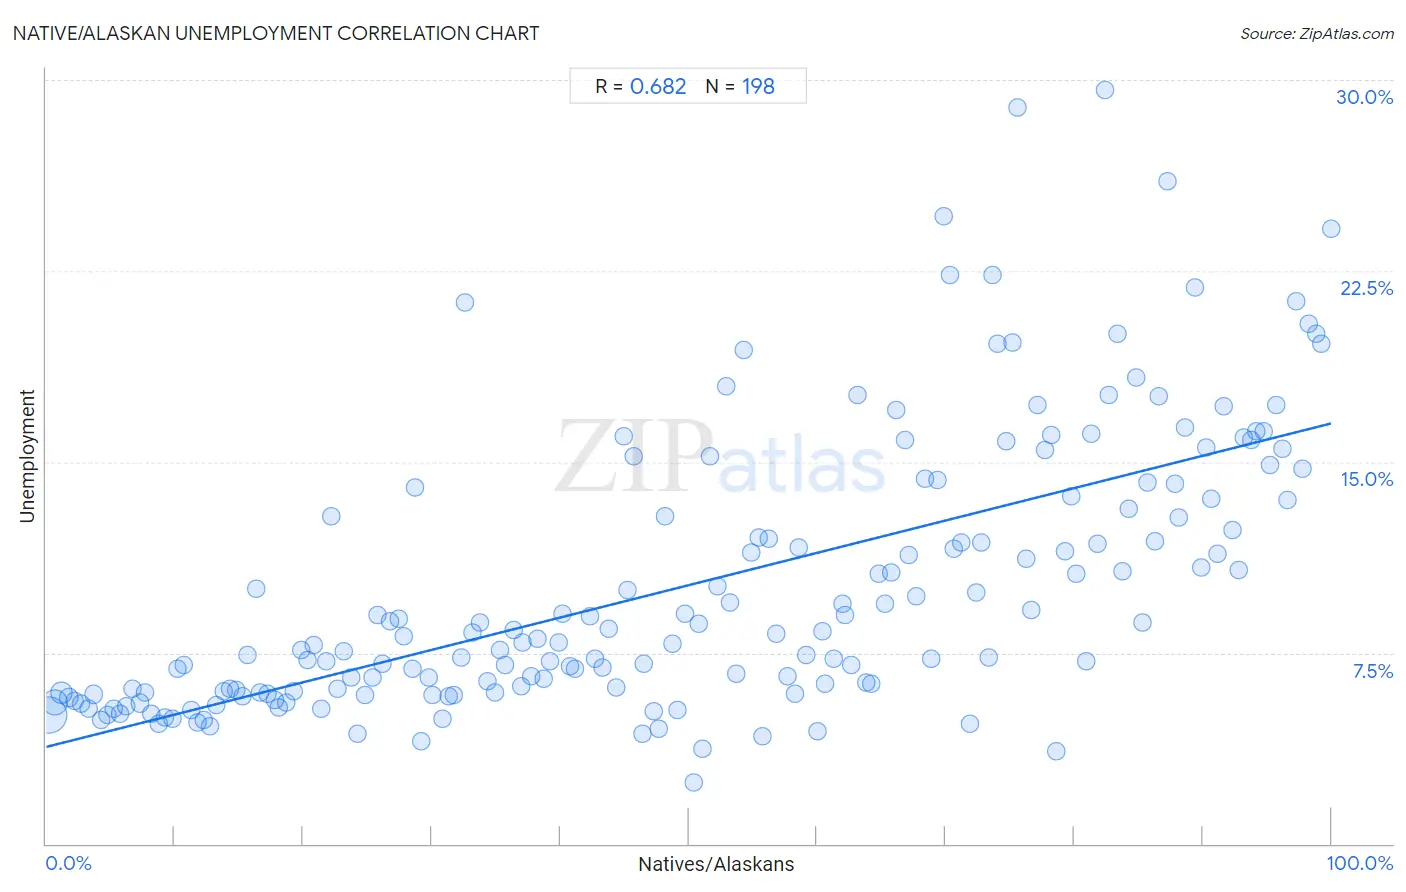
It is essential to understand that the correlation between the percentage of Natives/Alaskans and unemployment does not imply a direct cause-and-effect relationship. It remains uncertain whether the presence of Natives/Alaskans influences an upward or downward trend in the level of unemployment within an area, or if Natives/Alaskans simply ended up residing in those areas with higher or lower levels of unemployment due to other factors.
Demographics Similar to Natives/Alaskans by Unemployment
In terms of unemployment, the demographic groups most similar to Natives/Alaskans are Immigrants from Armenia (7.0%, a difference of 0.56%), Paiute (7.1%, a difference of 1.1%), Pueblo (7.2%, a difference of 1.7%), Immigrants from Grenada (6.9%, a difference of 1.7%), and Guyanese (6.9%, a difference of 2.1%).
| Demographics | Rating | Rank | Unemployment |
| Immigrants from Cabo Verde | 0.0 /100 | #318 | Tragic 6.8% |
| British West Indians | 0.0 /100 | #319 | Tragic 6.8% |
| Immigrants from St. Vincent and the Grenadines | 0.0 /100 | #320 | Tragic 6.9% |
| Immigrants from Guyana | 0.0 /100 | #321 | Tragic 6.9% |
| Guyanese | 0.0 /100 | #322 | Tragic 6.9% |
| Immigrants from Grenada | 0.0 /100 | #323 | Tragic 6.9% |
| Immigrants from Armenia | 0.0 /100 | #324 | Tragic 7.0% |
| Natives/Alaskans | 0.0 /100 | #325 | Tragic 7.0% |
| Paiute | 0.0 /100 | #326 | Tragic 7.1% |
| Pueblo | 0.0 /100 | #327 | Tragic 7.2% |
| Tsimshian | 0.0 /100 | #328 | Tragic 7.2% |
| Alaska Natives | 0.0 /100 | #329 | Tragic 7.2% |
| Yakama | 0.0 /100 | #330 | Tragic 7.3% |
| Dominicans | 0.0 /100 | #331 | Tragic 7.4% |
| Sioux | 0.0 /100 | #332 | Tragic 7.4% |
Native/Alaskan Unemployment Correlation Summary
| Measurement | Native/Alaskan Data | Unemployment Data |
| Minimum | 0.21% | 2.4% |
| Maximum | 100.0% | 29.6% |
| Range | 99.8% | 27.2% |
| Mean | 50.0% | 10.2% |
| Median | 50.0% | 8.2% |
| Interquartile 25% (IQ1) | 24.8% | 6.0% |
| Interquartile 75% (IQ3) | 75.2% | 13.5% |
| Interquartile Range (IQR) | 50.4% | 7.6% |
| Standard Deviation (Sample) | 29.1% | 5.4% |
| Standard Deviation (Population) | 29.0% | 5.4% |
Correlation Details
| Native/Alaskan Percentile | Sample Size | Unemployment |
[ 0.0% - 0.5% ] 0.21% | 288,016,345 | 5.1% |
[ 0.5% - 1.0% ] 0.71% | 118,490,281 | 5.5% |
[ 1.0% - 1.5% ] 1.20% | 51,358,169 | 5.9% |
[ 1.5% - 2.0% ] 1.72% | 18,032,435 | 5.8% |
[ 2.0% - 2.5% ] 2.20% | 10,970,854 | 5.6% |
[ 2.5% - 3.0% ] 2.71% | 4,845,224 | 5.5% |
[ 3.0% - 3.5% ] 3.26% | 4,324,009 | 5.3% |
[ 3.5% - 4.0% ] 3.72% | 2,044,332 | 5.9% |
[ 4.0% - 4.5% ] 4.26% | 2,552,414 | 4.9% |
[ 4.5% - 5.0% ] 4.76% | 1,791,649 | 5.1% |
[ 5.0% - 5.5% ] 5.22% | 664,381 | 5.3% |
[ 5.5% - 6.0% ] 5.73% | 848,347 | 5.1% |
[ 6.0% - 6.5% ] 6.25% | 643,932 | 5.4% |
[ 6.5% - 7.0% ] 6.74% | 370,202 | 6.1% |
[ 7.0% - 7.5% ] 7.32% | 691,175 | 5.5% |
[ 7.5% - 8.0% ] 7.70% | 354,828 | 6.0% |
[ 8.0% - 8.5% ] 8.21% | 377,837 | 5.1% |
[ 8.5% - 9.0% ] 8.72% | 403,513 | 4.7% |
[ 9.0% - 9.5% ] 9.23% | 270,229 | 5.0% |
[ 9.5% - 10.0% ] 9.79% | 242,649 | 4.9% |
[ 10.0% - 10.5% ] 10.26% | 147,843 | 6.9% |
[ 10.5% - 11.0% ] 10.70% | 133,912 | 7.0% |
[ 11.0% - 11.5% ] 11.33% | 176,326 | 5.2% |
[ 11.5% - 12.0% ] 11.78% | 193,836 | 4.7% |
[ 12.0% - 12.5% ] 12.23% | 229,925 | 4.8% |
[ 12.5% - 13.0% ] 12.77% | 133,771 | 4.6% |
[ 13.0% - 13.5% ] 13.27% | 94,285 | 5.4% |
[ 13.5% - 14.0% ] 13.81% | 140,731 | 6.0% |
[ 14.0% - 14.5% ] 14.28% | 72,693 | 6.1% |
[ 14.5% - 15.0% ] 14.77% | 99,299 | 6.0% |
[ 15.0% - 15.5% ] 15.24% | 112,538 | 5.8% |
[ 15.5% - 16.0% ] 15.65% | 64,098 | 7.4% |
[ 16.0% - 16.5% ] 16.33% | 32,628 | 10.0% |
[ 16.5% - 17.0% ] 16.65% | 81,480 | 5.9% |
[ 17.0% - 17.5% ] 17.22% | 86,755 | 5.9% |
[ 17.5% - 18.0% ] 17.85% | 98,863 | 5.6% |
[ 18.0% - 18.5% ] 18.13% | 125,658 | 5.4% |
[ 18.5% - 19.0% ] 18.70% | 38,810 | 5.5% |
[ 19.0% - 19.5% ] 19.30% | 89,302 | 6.0% |
[ 19.5% - 20.0% ] 19.81% | 47,014 | 7.6% |
[ 20.0% - 20.5% ] 20.31% | 43,547 | 7.2% |
[ 20.5% - 21.0% ] 20.85% | 31,331 | 7.8% |
[ 21.0% - 21.5% ] 21.40% | 27,291 | 5.3% |
[ 21.5% - 22.0% ] 21.81% | 39,617 | 7.2% |
[ 22.0% - 22.5% ] 22.19% | 8,729 | 12.9% |
[ 22.5% - 23.0% ] 22.65% | 34,793 | 6.1% |
[ 23.0% - 23.5% ] 23.18% | 15,680 | 7.5% |
[ 23.5% - 24.0% ] 23.72% | 22,991 | 6.5% |
[ 24.0% - 24.5% ] 24.25% | 25,324 | 4.3% |
[ 24.5% - 25.0% ] 24.78% | 19,361 | 5.8% |
[ 25.0% - 25.5% ] 25.40% | 15,016 | 6.5% |
[ 25.5% - 26.0% ] 25.78% | 13,738 | 9.0% |
[ 26.0% - 26.5% ] 26.20% | 13,140 | 7.1% |
[ 26.5% - 27.0% ] 26.72% | 7,395 | 8.7% |
[ 27.0% - 27.5% ] 27.46% | 15,131 | 8.8% |
[ 27.5% - 28.0% ] 27.81% | 17,538 | 8.1% |
[ 28.0% - 28.5% ] 28.48% | 55,487 | 6.9% |
[ 28.5% - 29.0% ] 28.66% | 4,592 | 14.0% |
[ 29.0% - 29.5% ] 29.21% | 7,858 | 4.0% |
[ 29.5% - 30.0% ] 29.80% | 34,683 | 6.5% |
[ 30.0% - 30.5% ] 30.10% | 29,726 | 5.9% |
[ 30.5% - 31.0% ] 30.81% | 9,260 | 4.9% |
[ 31.0% - 31.5% ] 31.35% | 9,336 | 5.8% |
[ 31.5% - 32.0% ] 31.69% | 5,986 | 5.8% |
[ 32.0% - 32.5% ] 32.28% | 19,540 | 7.3% |
[ 32.5% - 33.0% ] 32.60% | 5,611 | 21.2% |
[ 33.0% - 33.5% ] 33.17% | 59,303 | 8.3% |
[ 33.5% - 34.0% ] 33.79% | 7,751 | 8.7% |
[ 34.0% - 34.5% ] 34.32% | 37,016 | 6.4% |
[ 34.5% - 35.0% ] 34.88% | 11,799 | 6.0% |
[ 35.0% - 35.5% ] 35.34% | 5,458 | 7.6% |
[ 35.5% - 36.0% ] 35.71% | 18,130 | 7.0% |
[ 36.0% - 36.5% ] 36.35% | 4,039 | 8.4% |
[ 36.5% - 37.0% ] 36.93% | 1,725 | 6.2% |
[ 37.0% - 37.5% ] 37.08% | 10,277 | 7.9% |
[ 37.5% - 38.0% ] 37.77% | 12,032 | 6.6% |
[ 38.0% - 38.5% ] 38.24% | 11,157 | 8.1% |
[ 38.5% - 39.0% ] 38.69% | 9,868 | 6.5% |
[ 39.0% - 39.5% ] 39.21% | 7,639 | 7.2% |
[ 39.5% - 40.0% ] 39.91% | 4,445 | 7.9% |
[ 40.0% - 40.5% ] 40.18% | 4,828 | 9.0% |
[ 40.5% - 41.0% ] 40.72% | 1,444 | 7.0% |
[ 41.0% - 41.5% ] 41.15% | 3,582 | 6.9% |
[ 42.0% - 42.5% ] 42.29% | 1,783 | 8.9% |
[ 42.5% - 43.0% ] 42.70% | 5,953 | 7.3% |
[ 43.0% - 43.5% ] 43.28% | 2,112 | 6.9% |
[ 43.5% - 44.0% ] 43.75% | 2,928 | 8.4% |
[ 44.0% - 44.5% ] 44.38% | 365 | 6.2% |
[ 44.5% - 45.0% ] 44.90% | 7,459 | 16.0% |
[ 45.0% - 45.5% ] 45.26% | 2,329 | 10.0% |
[ 45.5% - 46.0% ] 45.69% | 348 | 15.2% |
[ 46.0% - 46.5% ] 46.36% | 770 | 4.3% |
[ 46.5% - 47.0% ] 46.55% | 14,734 | 7.1% |
[ 47.0% - 47.5% ] 47.29% | 4,060 | 5.2% |
[ 47.5% - 48.0% ] 47.68% | 23,011 | 4.5% |
[ 48.0% - 48.5% ] 48.19% | 7,190 | 12.9% |
[ 48.5% - 49.0% ] 48.69% | 1,719 | 7.8% |
[ 49.0% - 49.5% ] 49.17% | 27,556 | 5.3% |
[ 49.5% - 50.0% ] 49.73% | 5,087 | 9.0% |
[ 50.0% - 50.5% ] 50.35% | 1,011 | 2.4% |
[ 50.5% - 51.0% ] 50.82% | 6,360 | 8.7% |
[ 51.0% - 51.5% ] 51.10% | 867 | 3.7% |
[ 51.5% - 52.0% ] 51.68% | 5,371 | 15.2% |
[ 52.0% - 52.5% ] 52.27% | 2,493 | 10.1% |
[ 52.5% - 53.0% ] 52.90% | 794 | 18.0% |
[ 53.0% - 53.5% ] 53.19% | 14,688 | 9.5% |
[ 53.5% - 54.0% ] 53.70% | 17,032 | 6.7% |
[ 54.0% - 54.5% ] 54.25% | 1,329 | 19.4% |
[ 54.5% - 55.0% ] 54.91% | 5,449 | 11.4% |
[ 55.0% - 55.5% ] 55.40% | 10,830 | 12.0% |
[ 55.5% - 56.0% ] 55.72% | 10,236 | 4.2% |
[ 56.0% - 56.5% ] 56.23% | 2,440 | 12.0% |
[ 56.5% - 57.0% ] 56.80% | 2,391 | 8.3% |
[ 57.5% - 58.0% ] 57.73% | 291 | 6.6% |
[ 58.0% - 58.5% ] 58.28% | 5,666 | 5.9% |
[ 58.5% - 59.0% ] 58.59% | 1,246 | 11.6% |
[ 59.0% - 59.5% ] 59.11% | 384 | 7.4% |
[ 60.0% - 60.5% ] 60.00% | 270 | 4.4% |
[ 60.0% - 60.5% ] 60.37% | 5,846 | 8.4% |
[ 60.5% - 61.0% ] 60.62% | 8,294 | 6.3% |
[ 61.0% - 61.5% ] 61.26% | 14,313 | 7.2% |
[ 61.5% - 62.0% ] 61.94% | 3,263 | 9.4% |
[ 62.0% - 62.5% ] 62.12% | 2,117 | 9.0% |
[ 62.5% - 63.0% ] 62.62% | 4,339 | 7.0% |
[ 63.0% - 63.5% ] 63.16% | 2,481 | 17.6% |
[ 63.5% - 64.0% ] 63.80% | 11,444 | 6.3% |
[ 64.0% - 64.5% ] 64.21% | 3,663 | 6.3% |
[ 64.5% - 65.0% ] 64.77% | 12,309 | 10.6% |
[ 65.0% - 65.5% ] 65.24% | 13,874 | 9.4% |
[ 65.5% - 66.0% ] 65.78% | 1,844 | 10.6% |
[ 66.0% - 66.5% ] 66.17% | 2,663 | 17.0% |
[ 66.5% - 67.0% ] 66.80% | 1,232 | 15.9% |
[ 67.0% - 67.5% ] 67.16% | 5,826 | 11.4% |
[ 67.5% - 68.0% ] 67.71% | 11,170 | 9.7% |
[ 68.0% - 68.5% ] 68.34% | 338 | 14.3% |
[ 68.5% - 69.0% ] 68.91% | 15,811 | 7.3% |
[ 69.0% - 69.5% ] 69.37% | 4,888 | 14.3% |
[ 69.5% - 70.0% ] 69.87% | 1,580 | 24.7% |
[ 70.0% - 70.5% ] 70.33% | 765 | 22.3% |
[ 70.5% - 71.0% ] 70.65% | 1,530 | 11.6% |
[ 71.0% - 71.5% ] 71.18% | 4,143 | 11.8% |
[ 71.5% - 72.0% ] 71.85% | 2,714 | 4.7% |
[ 72.0% - 72.5% ] 72.39% | 11,661 | 9.9% |
[ 72.5% - 73.0% ] 72.79% | 724 | 11.8% |
[ 73.0% - 73.5% ] 73.31% | 18,983 | 7.3% |
[ 73.5% - 74.0% ] 73.64% | 755 | 22.3% |
[ 74.0% - 74.5% ] 74.06% | 3,632 | 19.6% |
[ 74.5% - 75.0% ] 74.75% | 7,418 | 15.8% |
[ 75.0% - 75.5% ] 75.22% | 3,248 | 19.7% |
[ 75.5% - 76.0% ] 75.59% | 299 | 28.9% |
[ 76.0% - 76.5% ] 76.29% | 5,960 | 11.2% |
[ 76.5% - 77.0% ] 76.67% | 9,084 | 9.2% |
[ 77.0% - 77.5% ] 77.18% | 7,441 | 17.2% |
[ 77.5% - 78.0% ] 77.70% | 1,623 | 15.5% |
[ 78.0% - 78.5% ] 78.19% | 2,646 | 16.0% |
[ 78.5% - 79.0% ] 78.63% | 2,209 | 3.6% |
[ 79.0% - 79.5% ] 79.26% | 11,027 | 11.5% |
[ 79.5% - 80.0% ] 79.73% | 12,198 | 13.7% |
[ 80.0% - 80.5% ] 80.16% | 7,691 | 10.6% |
[ 80.5% - 81.0% ] 80.94% | 3,263 | 7.2% |
[ 81.0% - 81.5% ] 81.33% | 2,683 | 16.1% |
[ 81.5% - 82.0% ] 81.77% | 4,136 | 11.8% |
[ 82.0% - 82.5% ] 82.43% | 882 | 29.6% |
[ 82.5% - 83.0% ] 82.68% | 7,650 | 17.6% |
[ 83.0% - 83.5% ] 83.39% | 13,924 | 20.0% |
[ 83.5% - 84.0% ] 83.72% | 9,501 | 10.7% |
[ 84.0% - 84.5% ] 84.28% | 5,101 | 13.2% |
[ 84.5% - 85.0% ] 84.84% | 25,017 | 18.3% |
[ 85.0% - 85.5% ] 85.32% | 7,702 | 8.7% |
[ 85.5% - 86.0% ] 85.70% | 9,663 | 14.2% |
[ 86.0% - 86.5% ] 86.27% | 2,323 | 11.9% |
[ 86.5% - 87.0% ] 86.61% | 7,124 | 17.6% |
[ 87.0% - 87.5% ] 87.29% | 2,109 | 26.0% |
[ 87.5% - 88.0% ] 87.86% | 7,197 | 14.1% |
[ 88.0% - 88.5% ] 88.16% | 7,303 | 12.8% |
[ 88.5% - 89.0% ] 88.67% | 18,954 | 16.3% |
[ 89.0% - 89.5% ] 89.36% | 10,270 | 21.9% |
[ 89.5% - 90.0% ] 89.86% | 2,752 | 10.9% |
[ 90.0% - 90.5% ] 90.30% | 11,861 | 15.6% |
[ 90.5% - 91.0% ] 90.63% | 21,005 | 13.5% |
[ 91.0% - 91.5% ] 91.17% | 14,432 | 11.4% |
[ 91.5% - 92.0% ] 91.68% | 9,544 | 17.2% |
[ 92.0% - 92.5% ] 92.28% | 17,938 | 12.3% |
[ 92.5% - 93.0% ] 92.84% | 38,008 | 10.7% |
[ 93.0% - 93.5% ] 93.16% | 20,901 | 16.0% |
[ 93.5% - 94.0% ] 93.78% | 28,962 | 15.9% |
[ 94.0% - 94.5% ] 94.17% | 16,722 | 16.2% |
[ 94.5% - 95.0% ] 94.74% | 36,093 | 16.2% |
[ 95.0% - 95.5% ] 95.19% | 23,870 | 14.9% |
[ 95.5% - 96.0% ] 95.70% | 32,853 | 17.3% |
[ 96.0% - 96.5% ] 96.25% | 20,486 | 15.5% |
[ 96.5% - 97.0% ] 96.57% | 24,189 | 13.5% |
[ 97.0% - 97.5% ] 97.26% | 13,951 | 21.3% |
[ 97.5% - 98.0% ] 97.75% | 32,793 | 14.7% |
[ 98.0% - 98.5% ] 98.28% | 19,507 | 20.5% |
[ 98.5% - 99.0% ] 98.80% | 17,139 | 20.0% |
[ 99.0% - 99.5% ] 99.26% | 21,129 | 19.6% |
[ 99.5% - 100.0% ] 99.99% | 28,564 | 24.1% |