Native/Alaskan vs Immigrants from Australia Unemployment Among Women with Children Ages 6 to 17 years
COMPARE
Native/Alaskan
Immigrants from Australia
Unemployment Among Women with Children Ages 6 to 17 years
Unemployment Among Women with Children Ages 6 to 17 years Comparison
Natives/Alaskans
Immigrants from Australia
11.5%
UNEMPLOYMENT AMONG WOMEN WITH CHILDREN AGES 6 TO 17 YEARS
0.0/ 100
METRIC RATING
333rd/ 347
METRIC RANK
8.3%
UNEMPLOYMENT AMONG WOMEN WITH CHILDREN AGES 6 TO 17 YEARS
99.8/ 100
METRIC RATING
71st/ 347
METRIC RANK
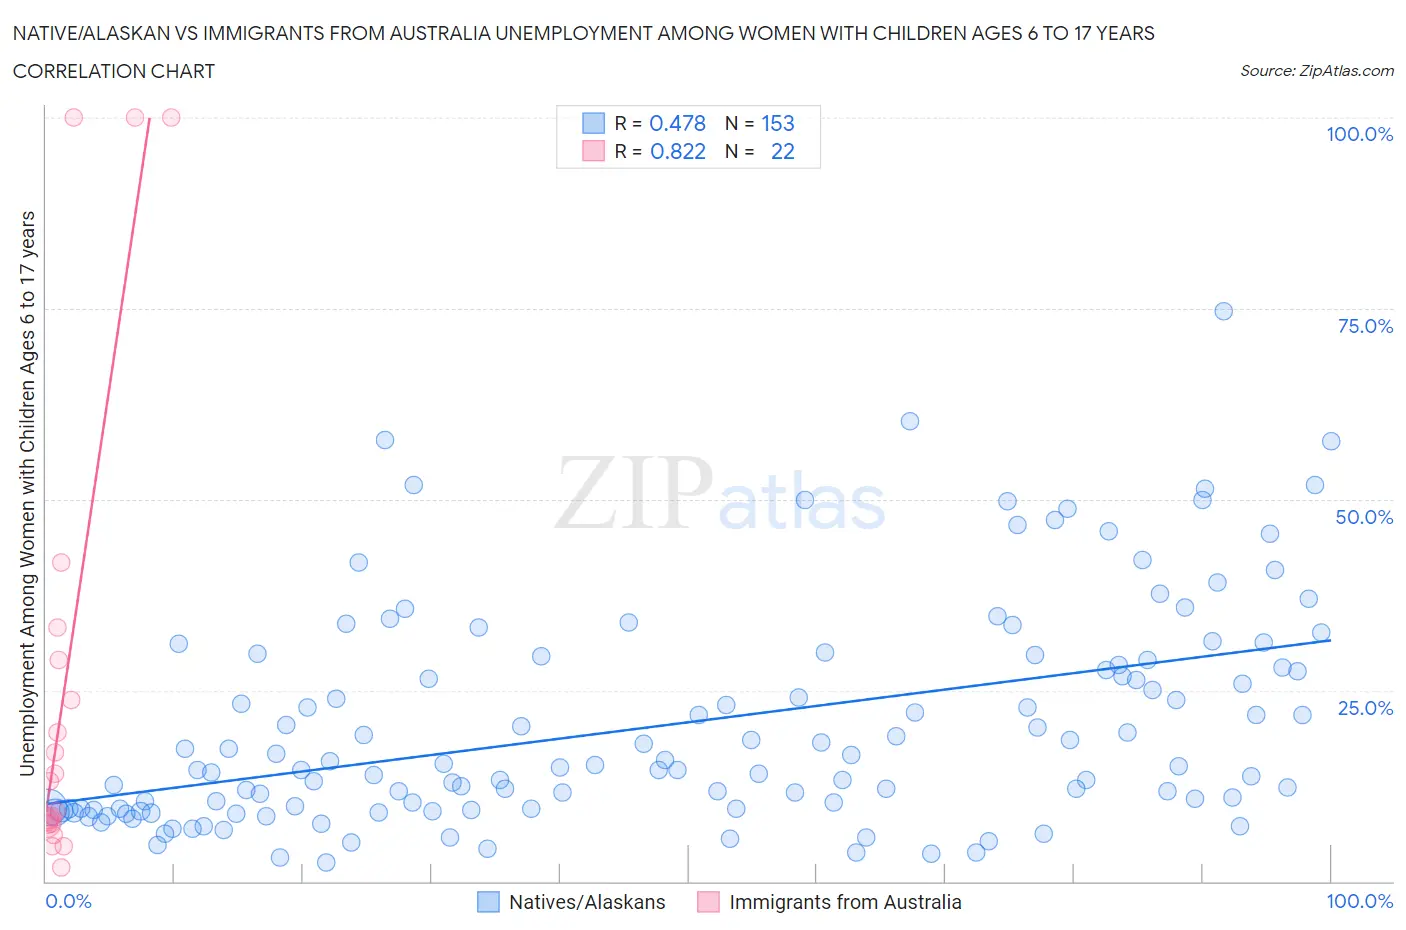
Native/Alaskan vs Immigrants from Australia Unemployment Among Women with Children Ages 6 to 17 years Correlation Chart
The statistical analysis conducted on geographies consisting of 344,398,137 people shows a moderate positive correlation between the proportion of Natives/Alaskans and unemployment rate among women with children between the ages 6 and 17 in the United States with a correlation coefficient (R) of 0.478 and weighted average of 11.5%. Similarly, the statistical analysis conducted on geographies consisting of 174,255,035 people shows a very strong positive correlation between the proportion of Immigrants from Australia and unemployment rate among women with children between the ages 6 and 17 in the United States with a correlation coefficient (R) of 0.822 and weighted average of 8.3%, a difference of 37.8%.
Unemployment Among Women with Children Ages 6 to 17 years Correlation Summary
| Measurement | Native/Alaskan | Immigrants from Australia |
| Minimum | 2.5% | 1.8% |
| Maximum | 74.6% | 100.0% |
| Range | 72.1% | 98.2% |
| Mean | 20.5% | 25.7% |
| Median | 15.1% | 11.2% |
| Interquartile 25% (IQ1) | 9.5% | 7.6% |
| Interquartile 75% (IQ3) | 28.6% | 29.0% |
| Interquartile Range (IQR) | 19.1% | 21.5% |
| Standard Deviation (Sample) | 14.4% | 31.9% |
| Standard Deviation (Population) | 14.3% | 31.1% |
Similar Demographics by Unemployment Among Women with Children Ages 6 to 17 years
Demographics Similar to Natives/Alaskans by Unemployment Among Women with Children Ages 6 to 17 years
In terms of unemployment among women with children ages 6 to 17 years, the demographic groups most similar to Natives/Alaskans are Tsimshian (11.4%, a difference of 0.63%), Black/African American (11.4%, a difference of 0.74%), Chippewa (11.1%, a difference of 3.4%), Pennsylvania German (11.0%, a difference of 3.9%), and Ugandan (12.0%, a difference of 4.9%).
| Demographics | Rating | Rank | Unemployment Among Women with Children Ages 6 to 17 years |
| Liberians | 0.0 /100 | #326 | Tragic 10.8% |
| Cape Verdeans | 0.0 /100 | #327 | Tragic 10.9% |
| Ottawa | 0.0 /100 | #328 | Tragic 10.9% |
| Pennsylvania Germans | 0.0 /100 | #329 | Tragic 11.0% |
| Chippewa | 0.0 /100 | #330 | Tragic 11.1% |
| Blacks/African Americans | 0.0 /100 | #331 | Tragic 11.4% |
| Tsimshian | 0.0 /100 | #332 | Tragic 11.4% |
| Natives/Alaskans | 0.0 /100 | #333 | Tragic 11.5% |
| Ugandans | 0.0 /100 | #334 | Tragic 12.0% |
| Colville | 0.0 /100 | #335 | Tragic 12.3% |
| Houma | 0.0 /100 | #336 | Tragic 12.5% |
| Immigrants | Yemen | 0.0 /100 | #337 | Tragic 12.7% |
| Hopi | 0.0 /100 | #338 | Tragic 12.9% |
| Sioux | 0.0 /100 | #339 | Tragic 13.2% |
| Puerto Ricans | 0.0 /100 | #340 | Tragic 13.9% |
Demographics Similar to Immigrants from Australia by Unemployment Among Women with Children Ages 6 to 17 years
In terms of unemployment among women with children ages 6 to 17 years, the demographic groups most similar to Immigrants from Australia are Immigrants from Nepal (8.3%, a difference of 0.040%), Norwegian (8.3%, a difference of 0.060%), Immigrants from Thailand (8.3%, a difference of 0.15%), Marshallese (8.3%, a difference of 0.18%), and Armenian (8.3%, a difference of 0.26%).
| Demographics | Rating | Rank | Unemployment Among Women with Children Ages 6 to 17 years |
| Immigrants | Kuwait | 99.9 /100 | #64 | Exceptional 8.3% |
| Immigrants | Albania | 99.9 /100 | #65 | Exceptional 8.3% |
| Luxembourgers | 99.9 /100 | #66 | Exceptional 8.3% |
| Armenians | 99.9 /100 | #67 | Exceptional 8.3% |
| Marshallese | 99.9 /100 | #68 | Exceptional 8.3% |
| Immigrants | Thailand | 99.9 /100 | #69 | Exceptional 8.3% |
| Norwegians | 99.9 /100 | #70 | Exceptional 8.3% |
| Immigrants | Australia | 99.8 /100 | #71 | Exceptional 8.3% |
| Immigrants | Nepal | 99.8 /100 | #72 | Exceptional 8.3% |
| Spanish Americans | 99.8 /100 | #73 | Exceptional 8.4% |
| Samoans | 99.7 /100 | #74 | Exceptional 8.4% |
| Immigrants | Sri Lanka | 99.7 /100 | #75 | Exceptional 8.4% |
| Immigrants | Moldova | 99.7 /100 | #76 | Exceptional 8.4% |
| Iraqis | 99.7 /100 | #77 | Exceptional 8.4% |
| Pakistanis | 99.6 /100 | #78 | Exceptional 8.4% |