Native/Alaskan vs Immigrants from Ecuador Unemployment Among Women with Children Ages 6 to 17 years
COMPARE
Native/Alaskan
Immigrants from Ecuador
Unemployment Among Women with Children Ages 6 to 17 years
Unemployment Among Women with Children Ages 6 to 17 years Comparison
Natives/Alaskans
Immigrants from Ecuador
11.5%
UNEMPLOYMENT AMONG WOMEN WITH CHILDREN AGES 6 TO 17 YEARS
0.0/ 100
METRIC RATING
333rd/ 347
METRIC RANK
10.2%
UNEMPLOYMENT AMONG WOMEN WITH CHILDREN AGES 6 TO 17 YEARS
0.0/ 100
METRIC RATING
303rd/ 347
METRIC RANK
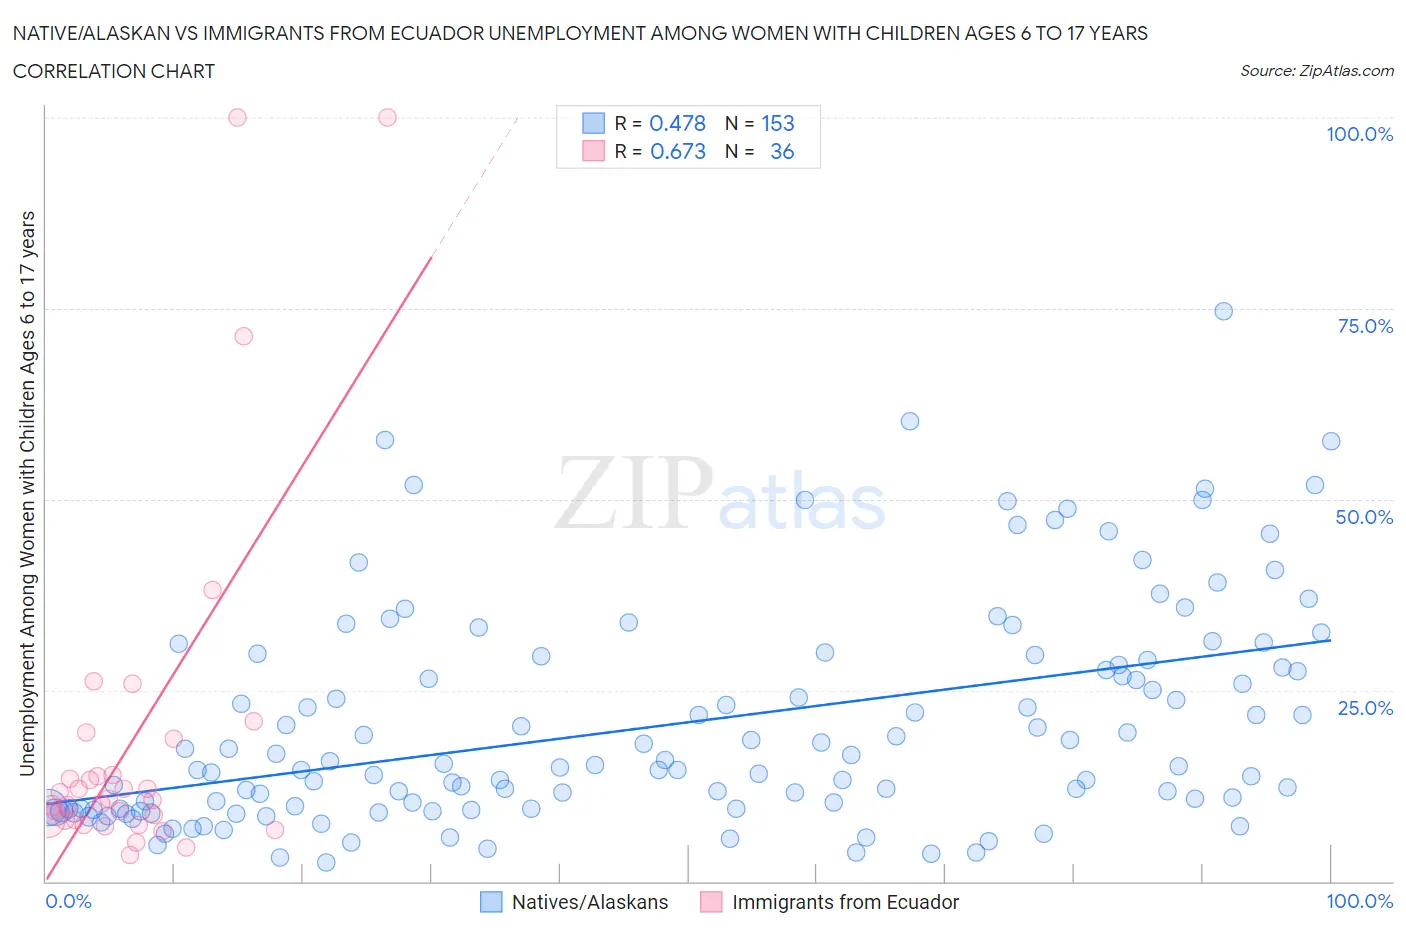
Native/Alaskan vs Immigrants from Ecuador Unemployment Among Women with Children Ages 6 to 17 years Correlation Chart
The statistical analysis conducted on geographies consisting of 344,398,137 people shows a moderate positive correlation between the proportion of Natives/Alaskans and unemployment rate among women with children between the ages 6 and 17 in the United States with a correlation coefficient (R) of 0.478 and weighted average of 11.5%. Similarly, the statistical analysis conducted on geographies consisting of 212,439,622 people shows a significant positive correlation between the proportion of Immigrants from Ecuador and unemployment rate among women with children between the ages 6 and 17 in the United States with a correlation coefficient (R) of 0.673 and weighted average of 10.2%, a difference of 12.6%.
Unemployment Among Women with Children Ages 6 to 17 years Correlation Summary
| Measurement | Native/Alaskan | Immigrants from Ecuador |
| Minimum | 2.5% | 3.5% |
| Maximum | 74.6% | 100.0% |
| Range | 72.1% | 96.5% |
| Mean | 20.5% | 18.7% |
| Median | 15.1% | 10.7% |
| Interquartile 25% (IQ1) | 9.5% | 8.0% |
| Interquartile 75% (IQ3) | 28.6% | 16.3% |
| Interquartile Range (IQR) | 19.1% | 8.3% |
| Standard Deviation (Sample) | 14.4% | 23.3% |
| Standard Deviation (Population) | 14.3% | 23.0% |
Similar Demographics by Unemployment Among Women with Children Ages 6 to 17 years
Demographics Similar to Natives/Alaskans by Unemployment Among Women with Children Ages 6 to 17 years
In terms of unemployment among women with children ages 6 to 17 years, the demographic groups most similar to Natives/Alaskans are Tsimshian (11.4%, a difference of 0.63%), Black/African American (11.4%, a difference of 0.74%), Chippewa (11.1%, a difference of 3.4%), Pennsylvania German (11.0%, a difference of 3.9%), and Ugandan (12.0%, a difference of 4.9%).
| Demographics | Rating | Rank | Unemployment Among Women with Children Ages 6 to 17 years |
| Liberians | 0.0 /100 | #326 | Tragic 10.8% |
| Cape Verdeans | 0.0 /100 | #327 | Tragic 10.9% |
| Ottawa | 0.0 /100 | #328 | Tragic 10.9% |
| Pennsylvania Germans | 0.0 /100 | #329 | Tragic 11.0% |
| Chippewa | 0.0 /100 | #330 | Tragic 11.1% |
| Blacks/African Americans | 0.0 /100 | #331 | Tragic 11.4% |
| Tsimshian | 0.0 /100 | #332 | Tragic 11.4% |
| Natives/Alaskans | 0.0 /100 | #333 | Tragic 11.5% |
| Ugandans | 0.0 /100 | #334 | Tragic 12.0% |
| Colville | 0.0 /100 | #335 | Tragic 12.3% |
| Houma | 0.0 /100 | #336 | Tragic 12.5% |
| Immigrants | Yemen | 0.0 /100 | #337 | Tragic 12.7% |
| Hopi | 0.0 /100 | #338 | Tragic 12.9% |
| Sioux | 0.0 /100 | #339 | Tragic 13.2% |
| Puerto Ricans | 0.0 /100 | #340 | Tragic 13.9% |
Demographics Similar to Immigrants from Ecuador by Unemployment Among Women with Children Ages 6 to 17 years
In terms of unemployment among women with children ages 6 to 17 years, the demographic groups most similar to Immigrants from Ecuador are Immigrants from Venezuela (10.2%, a difference of 0.090%), Immigrants from Nigeria (10.2%, a difference of 0.15%), Venezuelan (10.2%, a difference of 0.17%), Paraguayan (10.2%, a difference of 0.44%), and Immigrants from Bahamas (10.1%, a difference of 0.62%).
| Demographics | Rating | Rank | Unemployment Among Women with Children Ages 6 to 17 years |
| Immigrants | Western Africa | 0.0 /100 | #296 | Tragic 10.1% |
| Immigrants | Caribbean | 0.0 /100 | #297 | Tragic 10.1% |
| Immigrants | Haiti | 0.0 /100 | #298 | Tragic 10.1% |
| Immigrants | Honduras | 0.0 /100 | #299 | Tragic 10.1% |
| Nigerians | 0.0 /100 | #300 | Tragic 10.1% |
| Immigrants | Bahamas | 0.0 /100 | #301 | Tragic 10.1% |
| Venezuelans | 0.0 /100 | #302 | Tragic 10.2% |
| Immigrants | Ecuador | 0.0 /100 | #303 | Tragic 10.2% |
| Immigrants | Venezuela | 0.0 /100 | #304 | Tragic 10.2% |
| Immigrants | Nigeria | 0.0 /100 | #305 | Tragic 10.2% |
| Paraguayans | 0.0 /100 | #306 | Tragic 10.2% |
| Immigrants | Senegal | 0.0 /100 | #307 | Tragic 10.2% |
| Dutch West Indians | 0.0 /100 | #308 | Tragic 10.2% |
| French Canadians | 0.0 /100 | #309 | Tragic 10.3% |
| Alaska Natives | 0.0 /100 | #310 | Tragic 10.3% |