Zip Codes with the Highest Percentage of Not-for-profit Organizations in Providence, RI

RELATED REPORTS & OPTIONS

Not-for-profit Organizations
Population
Families and Households
Female Fertility
Female Fertility (Unmarried)
Race (Community Size)
Race (Percentage)
Ancestry (Community Size)
AfricanAlbanianAmericanArabArgentineanArmenianAustralianAustrianBangladeshiBarbadianBelgianBelizeanBhutaneseBlackfeetBolivianBrazilianBritishBritish West IndianBurmeseCanadianCape VerdeanCentral AmericanCentral American IndianCherokeeChileanColombianCosta RicanCroatianCubanCzechCzechoslovakianDanishDominicanDutchEastern EuropeanEcuadorianEgyptianEnglishEthiopianEuropeanFilipinoFinnishFrenchFrench CanadianGermanGhanaianGreekGuatemalanGuyaneseHaitianHonduranHungarianIndian (Asian)IndonesianIranianIraqiIrishIsraeliItalianJamaicanJapaneseKenyanKoreanLaotianLatvianLebaneseLiberianLithuanianLuxembourgerMalaysianMexicanMexican American IndianMongolianMoroccanNative HawaiianNicaraguanNigerianNorthern EuropeanNorwegianOkinawanPakistaniPalestinianPanamanianPennsylvania GermanPeruvianPolishPortuguesePuerto RicanRomanianRussianSalvadoranSamoanScandinavianScotch-IrishScottishSlavicSlovakSouth AmericanSouth American IndianSpaniardSpanishSri LankanSubsaharan AfricanSwedishSwissSyrianThaiTrinidadian and TobagonianTurkishUkrainianUruguayanVenezuelanVietnameseWelshWest IndianYugoslavian
Ancestry (Percentage)
AfricanAlbanianAmericanArabArgentineanArmenianAustralianAustrianBangladeshiBarbadianBelgianBelizeanBhutaneseBlackfeetBolivianBrazilianBritishBritish West IndianBurmeseCanadianCape VerdeanCentral AmericanCentral American IndianCherokeeChileanColombianCosta RicanCroatianCubanCzechCzechoslovakianDanishDominicanDutchEastern EuropeanEcuadorianEgyptianEnglishEthiopianEuropeanFilipinoFinnishFrenchFrench CanadianGermanGhanaianGreekGuatemalanGuyaneseHaitianHonduranHungarianIndian (Asian)IndonesianIranianIraqiIrishIsraeliItalianJamaicanJapaneseKenyanKoreanLaotianLatvianLebaneseLiberianLithuanianLuxembourgerMalaysianMexicanMexican American IndianMongolianMoroccanNative HawaiianNicaraguanNigerianNorthern EuropeanNorwegianOkinawanPakistaniPalestinianPanamanianPennsylvania GermanPeruvianPolishPortuguesePuerto RicanRomanianRussianSalvadoranSamoanScandinavianScotch-IrishScottishSlavicSlovakSouth AmericanSouth American IndianSpaniardSpanishSri LankanSubsaharan AfricanSwedishSwissSyrianThaiTrinidadian and TobagonianTurkishUkrainianUruguayanVenezuelanVietnameseWelshWest IndianYugoslavian
Immigrant Origin (Total)
AfricaArgentinaArmeniaAsiaAzoresBarbadosBelarusBelgiumBoliviaBrazilBurma / MyanmarCabo VerdeCambodiaCanadaCaribbeanCentral AmericaChileChinaColombiaCubaDenmarkDominican RepublicEastern AfricaEastern AsiaEastern EuropeEcuadorEgyptEl SalvadorEnglandEritreaEuropeFranceGermanyGhanaGreeceGuatemalaGuyanaHaitiHondurasHong KongHungaryIndiaIndonesiaIranIraqIrelandIsraelItalyJamaicaJapanKenyaKoreaLaosLatin AmericaLebanonLiberiaMalaysiaMexicoMiddle AfricaMoroccoNepalNetherlandsNicaraguaNigeriaNorthern AfricaNorthern EuropePakistanPanamaPeruPhilippinesPolandPortugalRomaniaRussiaSaudi ArabiaScotlandSenegalSingaporeSouth AmericaSouth Central AsiaSouth Eastern AsiaSouthern EuropeSpainSwedenSwitzerlandSyriaTaiwanThailandTrinidad and TobagoTurkeyUkraineVenezuelaVietnamWestern AfricaWestern AsiaWestern Europe
Immigrant Origin (Percentage)
AfricaArgentinaArmeniaAsiaAzoresBarbadosBelarusBelgiumBoliviaBrazilBurma / MyanmarCabo VerdeCambodiaCanadaCaribbeanCentral AmericaChileChinaColombiaCubaDenmarkDominican RepublicEastern AfricaEastern AsiaEastern EuropeEcuadorEgyptEl SalvadorEnglandEritreaEuropeFranceGermanyGhanaGreeceGuatemalaGuyanaHaitiHondurasHong KongHungaryIndiaIndonesiaIranIraqIrelandIsraelItalyJamaicaJapanKenyaKoreaLaosLatin AmericaLebanonLiberiaMalaysiaMexicoMiddle AfricaMoroccoNepalNetherlandsNicaraguaNigeriaNorthern AfricaNorthern EuropePakistanPanamaPeruPhilippinesPolandPortugalRomaniaRussiaSaudi ArabiaScotlandSenegalSingaporeSouth AmericaSouth Central AsiaSouth Eastern AsiaSouthern EuropeSpainSwedenSwitzerlandSyriaTaiwanThailandTrinidad and TobagoTurkeyUkraineVenezuelaVietnamWestern AfricaWestern AsiaWestern Europe
Income
Income (Families)
Income (Households)
Poverty
Poverty (Families)
Unemployment
Employment Occupations
Employment Industries
Employer Class
Commute Time
Commute Means
School Enrollment
Education by Degree Field
Occupancy
Finances
Physical Characteristics
Providence
Compare Zip Codes
Comparison Subject

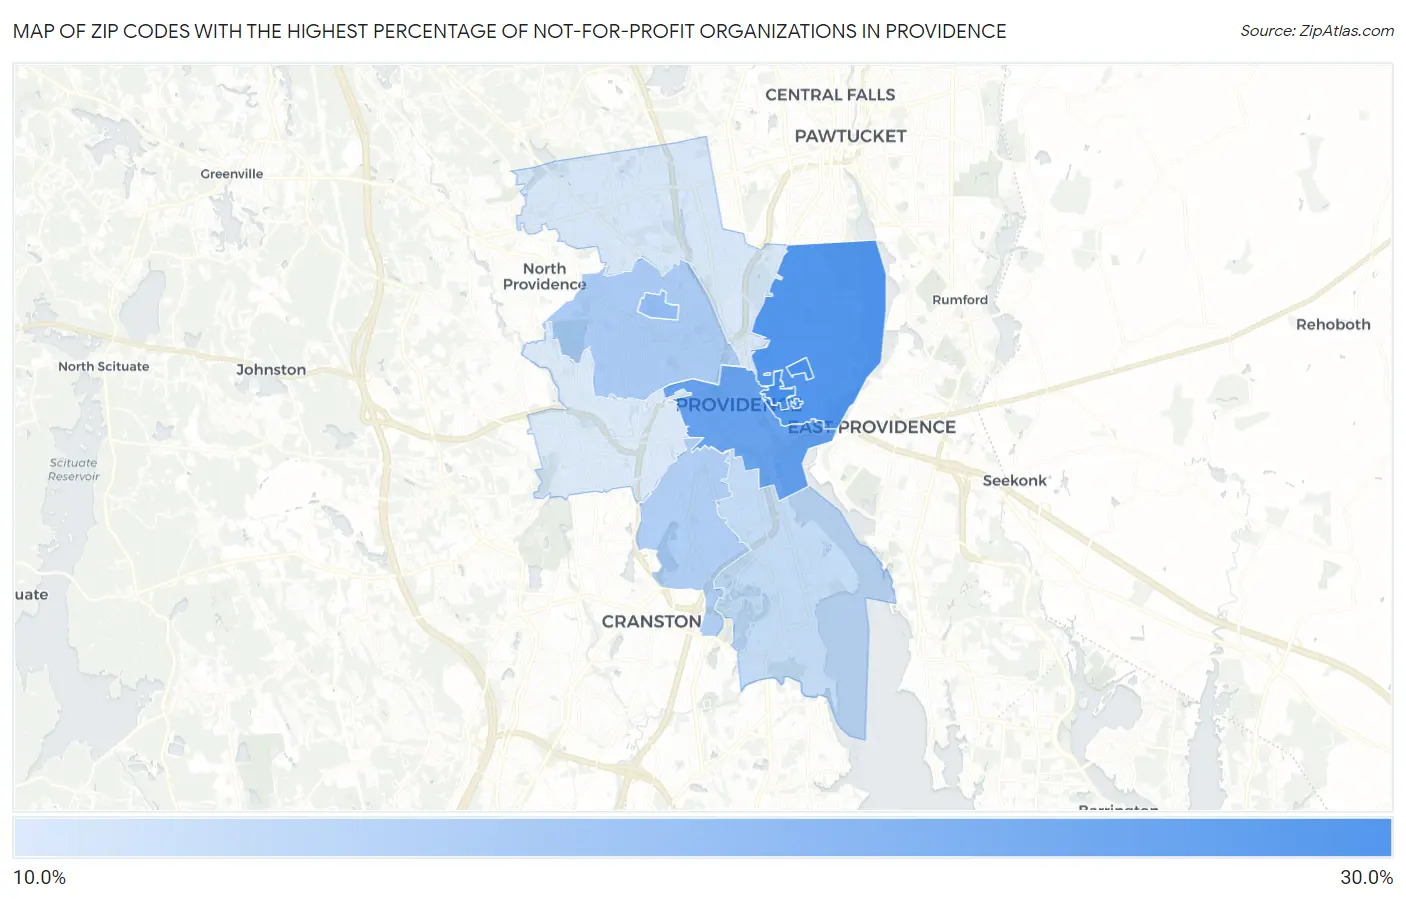
Map of Zip Codes with the Highest Percentage of Not-for-profit Organizations in Providence

0.0%
30.0%
Zip Codes with the Highest Percentage of Not-for-profit Organizations in Providence Map

Zip Codes with the Highest Percentage of Not-for-profit Organizations in Providence, RI

Zip Code % Employed in Not-for-profit vs State vs National
1.0291227.7%12.1%(+15.5)#38.4%(+19.2)#537
2.0290626.3%12.1%(+14.2)#48.4%(+17.9)#613
3.0290323.8%12.1%(+11.7)#58.4%(+15.4)#795
4.0291819.1%12.1%(+7.00)#68.4%(+10.7)#1,466
5.0290816.1%12.1%(+3.98)#118.4%(+7.65)#2,409
6.0290715.5%12.1%(+3.36)#138.4%(+7.02)#2,692
7.0290513.1%12.1%(+1.02)#228.4%(+4.68)#4,391
8.0290411.3%12.1%(-0.809)#318.4%(+2.86)#6,574
9.0290910.8%12.1%(-1.34)#378.4%(+2.32)#7,434

Common Questions

What are the Top 5 Zip Codes with the Highest Percentage of Not-for-profit Organizations in Providence, RI?
Top 5 Zip Codes with the Highest Percentage of Not-for-profit Organizations in Providence, RI are:
#1
27.7%
#2
26.3%
#3
23.8%
#4
19.1%
#5
16.1%
What zip code has the Highest Percentage of Not-for-profit Organizations in Providence, RI?
02912 has the Highest Percentage of Not-for-profit Organizations in Providence, RI with 27.7%.
What is the Percentage of Not-for-profit Organizations in Providence, RI?
Percentage of Not-for-profit Organizations in Providence is 16.7%.
What is the Percentage of Not-for-profit Organizations in Rhode Island?
Percentage of Not-for-profit Organizations in Rhode Island is 12.1%.
What is the Percentage of Not-for-profit Organizations in the United States?
Percentage of Not-for-profit Organizations in the United States is 8.4%.