Zip Codes with the Highest Percentage of Households Without a Vehicle in Mayaguez, PR
RELATED REPORTS & OPTIONS
Households without a Cars
Mayaguez
Compare Zip Codes
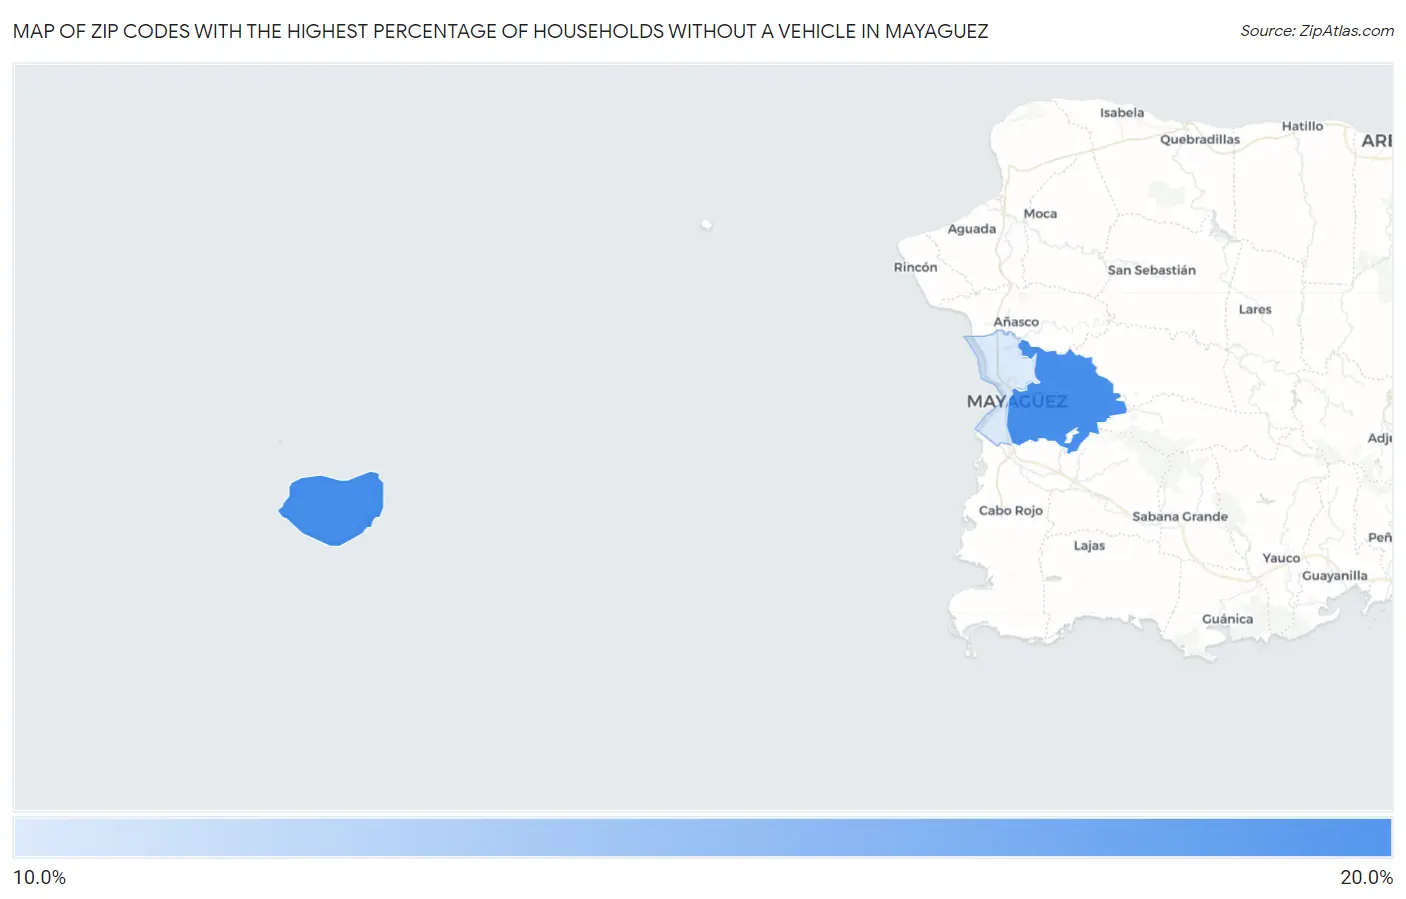
Map of Zip Codes with the Highest Percentage of Households Without a Vehicle in Mayaguez
19.1%
20.0%
Zip Codes with the Highest Percentage of Households Without a Vehicle in Mayaguez, PR
| Zip Code | Housholds Without a Car | vs State | vs National | |
| 1. | 00680 | 20.0% | 14.0%(+6.00)#22 | 8.3%(+11.7)#1,500 |
| 2. | 00682 | 19.1% | 14.0%(+5.10)#24 | 8.3%(+10.8)#1,614 |
1
Common Questions
What are the Top Zip Codes with the Highest Percentage of Households Without a Vehicle in Mayaguez, PR?
Top Zip Codes with the Highest Percentage of Households Without a Vehicle in Mayaguez, PR are:
What zip code has the Highest Percentage of Households Without a Vehicle in Mayaguez, PR?
00680 has the Highest Percentage of Households Without a Vehicle in Mayaguez, PR with 20.0%.
What is the Percentage of Households Without a Vehicle in Mayaguez, PR?
Percentage of Households Without a Vehicle in Mayaguez is 20.9%.
What is the Percentage of Households Without a Vehicle in Puerto Rico?
Percentage of Households Without a Vehicle in Puerto Rico is 14.0%.
What is the Percentage of Households Without a Vehicle in the United States?
Percentage of Households Without a Vehicle in the United States is 8.3%.