European vs Canadian Receiving Food Stamps
COMPARE
European
Canadian
Receiving Food Stamps
Receiving Food Stamps Comparison
Europeans
Canadians
9.5%
RECEIVING FOOD STAMPS
99.6/ 100
METRIC RATING
37th/ 347
METRIC RANK
10.5%
RECEIVING FOOD STAMPS
94.8/ 100
METRIC RATING
116th/ 347
METRIC RANK
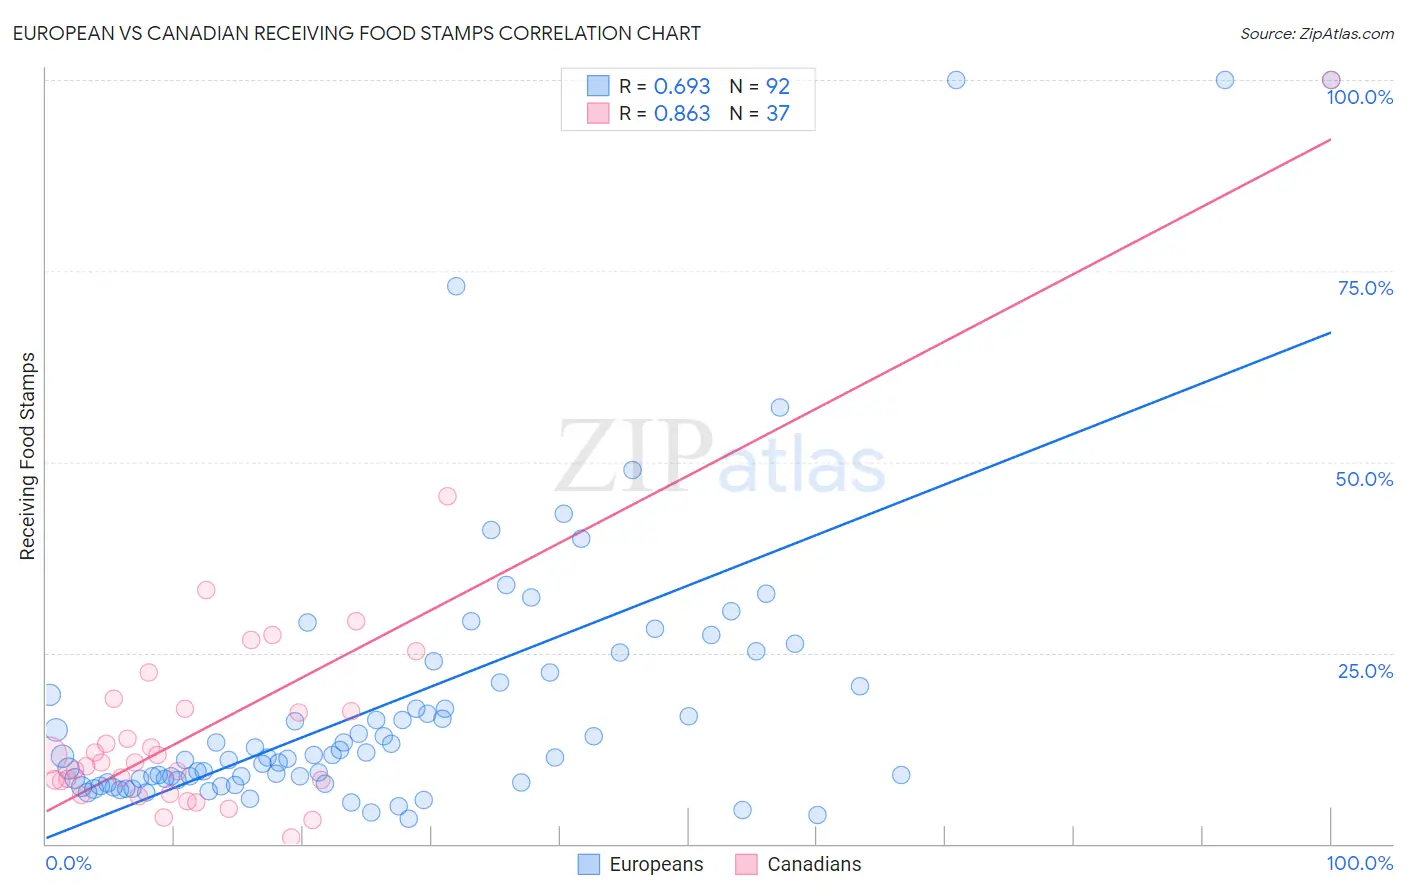
European vs Canadian Receiving Food Stamps Correlation Chart
The statistical analysis conducted on geographies consisting of 558,520,577 people shows a significant positive correlation between the proportion of Europeans and percentage of population receiving government assistance and/or food stamps in the United States with a correlation coefficient (R) of 0.693 and weighted average of 9.5%. Similarly, the statistical analysis conducted on geographies consisting of 436,119,320 people shows a very strong positive correlation between the proportion of Canadians and percentage of population receiving government assistance and/or food stamps in the United States with a correlation coefficient (R) of 0.863 and weighted average of 10.5%, a difference of 11.1%.
Receiving Food Stamps Correlation Summary
| Measurement | European | Canadian |
| Minimum | 3.2% | 0.80% |
| Maximum | 100.0% | 100.0% |
| Range | 96.8% | 99.2% |
| Mean | 18.5% | 15.9% |
| Median | 11.4% | 10.7% |
| Interquartile 25% (IQ1) | 8.2% | 7.4% |
| Interquartile 75% (IQ3) | 20.8% | 18.4% |
| Interquartile Range (IQR) | 12.6% | 11.0% |
| Standard Deviation (Sample) | 19.3% | 17.1% |
| Standard Deviation (Population) | 19.2% | 16.9% |
Similar Demographics by Receiving Food Stamps
Demographics Similar to Europeans by Receiving Food Stamps
In terms of receiving food stamps, the demographic groups most similar to Europeans are Estonian (9.5%, a difference of 0.070%), Immigrants from Austria (9.5%, a difference of 0.090%), Turkish (9.5%, a difference of 0.12%), Zimbabwean (9.5%, a difference of 0.13%), and Immigrants from Sri Lanka (9.5%, a difference of 0.29%).
| Demographics | Rating | Rank | Receiving Food Stamps |
| Immigrants | Sweden | 99.7 /100 | #30 | Exceptional 9.3% |
| Immigrants | Eastern Asia | 99.7 /100 | #31 | Exceptional 9.3% |
| Bolivians | 99.7 /100 | #32 | Exceptional 9.3% |
| Zimbabweans | 99.6 /100 | #33 | Exceptional 9.5% |
| Turks | 99.6 /100 | #34 | Exceptional 9.5% |
| Immigrants | Austria | 99.6 /100 | #35 | Exceptional 9.5% |
| Estonians | 99.6 /100 | #36 | Exceptional 9.5% |
| Europeans | 99.6 /100 | #37 | Exceptional 9.5% |
| Immigrants | Sri Lanka | 99.5 /100 | #38 | Exceptional 9.5% |
| Immigrants | Bolivia | 99.5 /100 | #39 | Exceptional 9.5% |
| Immigrants | Netherlands | 99.5 /100 | #40 | Exceptional 9.5% |
| Cambodians | 99.5 /100 | #41 | Exceptional 9.5% |
| Immigrants | China | 99.5 /100 | #42 | Exceptional 9.6% |
| Croatians | 99.5 /100 | #43 | Exceptional 9.6% |
| Immigrants | Denmark | 99.4 /100 | #44 | Exceptional 9.6% |
Demographics Similar to Canadians by Receiving Food Stamps
In terms of receiving food stamps, the demographic groups most similar to Canadians are Immigrants from Saudi Arabia (10.5%, a difference of 0.050%), Immigrants from Nepal (10.6%, a difference of 0.16%), Scotch-Irish (10.5%, a difference of 0.22%), Assyrian/Chaldean/Syriac (10.6%, a difference of 0.50%), and Icelander (10.5%, a difference of 0.52%).
| Demographics | Rating | Rank | Receiving Food Stamps |
| Immigrants | Pakistan | 96.2 /100 | #109 | Exceptional 10.4% |
| Pakistanis | 95.9 /100 | #110 | Exceptional 10.4% |
| Romanians | 95.8 /100 | #111 | Exceptional 10.4% |
| Mongolians | 95.8 /100 | #112 | Exceptional 10.5% |
| Icelanders | 95.4 /100 | #113 | Exceptional 10.5% |
| Scotch-Irish | 95.1 /100 | #114 | Exceptional 10.5% |
| Immigrants | Saudi Arabia | 94.9 /100 | #115 | Exceptional 10.5% |
| Canadians | 94.8 /100 | #116 | Exceptional 10.5% |
| Immigrants | Nepal | 94.6 /100 | #117 | Exceptional 10.6% |
| Assyrians/Chaldeans/Syriacs | 94.1 /100 | #118 | Exceptional 10.6% |
| Immigrants | Poland | 93.9 /100 | #119 | Exceptional 10.6% |
| Ethiopians | 93.9 /100 | #120 | Exceptional 10.6% |
| Slavs | 93.8 /100 | #121 | Exceptional 10.6% |
| Sri Lankans | 93.7 /100 | #122 | Exceptional 10.6% |
| Immigrants | Philippines | 93.3 /100 | #123 | Exceptional 10.7% |