European vs Iroquois Receiving Food Stamps
COMPARE
European
Iroquois
Receiving Food Stamps
Receiving Food Stamps Comparison
Europeans
Iroquois
9.5%
RECEIVING FOOD STAMPS
99.6/ 100
METRIC RATING
37th/ 347
METRIC RANK
13.5%
RECEIVING FOOD STAMPS
1.2/ 100
METRIC RATING
240th/ 347
METRIC RANK
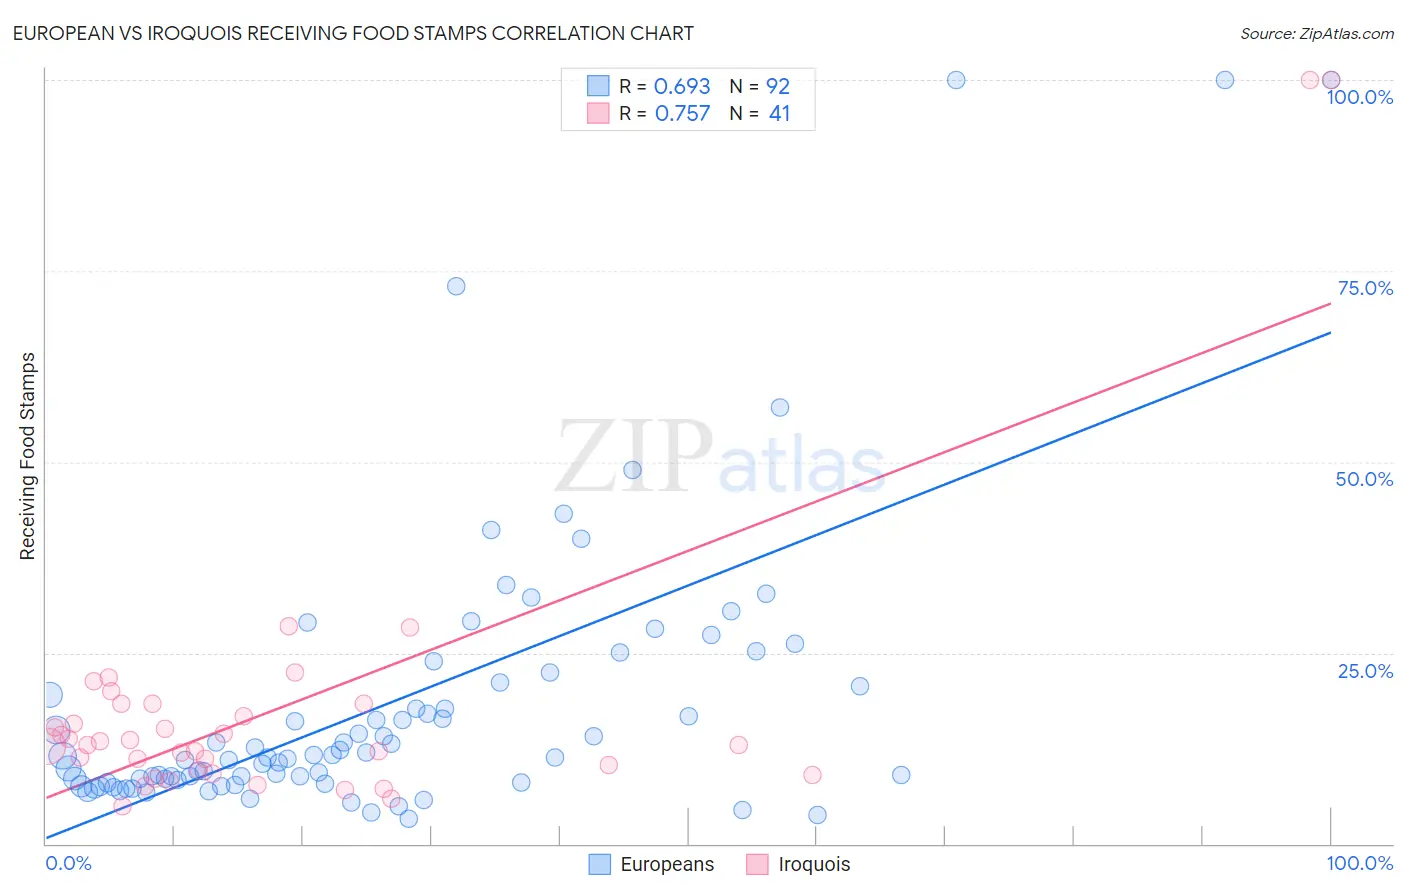
European vs Iroquois Receiving Food Stamps Correlation Chart
The statistical analysis conducted on geographies consisting of 558,520,577 people shows a significant positive correlation between the proportion of Europeans and percentage of population receiving government assistance and/or food stamps in the United States with a correlation coefficient (R) of 0.693 and weighted average of 9.5%. Similarly, the statistical analysis conducted on geographies consisting of 207,071,964 people shows a strong positive correlation between the proportion of Iroquois and percentage of population receiving government assistance and/or food stamps in the United States with a correlation coefficient (R) of 0.757 and weighted average of 13.5%, a difference of 42.7%.
Receiving Food Stamps Correlation Summary
| Measurement | European | Iroquois |
| Minimum | 3.2% | 4.9% |
| Maximum | 100.0% | 100.0% |
| Range | 96.8% | 95.1% |
| Mean | 18.5% | 17.9% |
| Median | 11.4% | 13.0% |
| Interquartile 25% (IQ1) | 8.2% | 9.5% |
| Interquartile 75% (IQ3) | 20.8% | 18.4% |
| Interquartile Range (IQR) | 12.6% | 8.9% |
| Standard Deviation (Sample) | 19.3% | 19.6% |
| Standard Deviation (Population) | 19.2% | 19.4% |
Similar Demographics by Receiving Food Stamps
Demographics Similar to Europeans by Receiving Food Stamps
In terms of receiving food stamps, the demographic groups most similar to Europeans are Estonian (9.5%, a difference of 0.070%), Immigrants from Austria (9.5%, a difference of 0.090%), Turkish (9.5%, a difference of 0.12%), Zimbabwean (9.5%, a difference of 0.13%), and Immigrants from Sri Lanka (9.5%, a difference of 0.29%).
| Demographics | Rating | Rank | Receiving Food Stamps |
| Immigrants | Sweden | 99.7 /100 | #30 | Exceptional 9.3% |
| Immigrants | Eastern Asia | 99.7 /100 | #31 | Exceptional 9.3% |
| Bolivians | 99.7 /100 | #32 | Exceptional 9.3% |
| Zimbabweans | 99.6 /100 | #33 | Exceptional 9.5% |
| Turks | 99.6 /100 | #34 | Exceptional 9.5% |
| Immigrants | Austria | 99.6 /100 | #35 | Exceptional 9.5% |
| Estonians | 99.6 /100 | #36 | Exceptional 9.5% |
| Europeans | 99.6 /100 | #37 | Exceptional 9.5% |
| Immigrants | Sri Lanka | 99.5 /100 | #38 | Exceptional 9.5% |
| Immigrants | Bolivia | 99.5 /100 | #39 | Exceptional 9.5% |
| Immigrants | Netherlands | 99.5 /100 | #40 | Exceptional 9.5% |
| Cambodians | 99.5 /100 | #41 | Exceptional 9.5% |
| Immigrants | China | 99.5 /100 | #42 | Exceptional 9.6% |
| Croatians | 99.5 /100 | #43 | Exceptional 9.6% |
| Immigrants | Denmark | 99.4 /100 | #44 | Exceptional 9.6% |
Demographics Similar to Iroquois by Receiving Food Stamps
In terms of receiving food stamps, the demographic groups most similar to Iroquois are Immigrants from Micronesia (13.5%, a difference of 0.30%), Choctaw (13.6%, a difference of 0.43%), French American Indian (13.5%, a difference of 0.53%), Immigrants from Panama (13.6%, a difference of 0.62%), and Immigrants from El Salvador (13.5%, a difference of 0.72%).
| Demographics | Rating | Rank | Receiving Food Stamps |
| Cherokee | 2.5 /100 | #233 | Tragic 13.2% |
| Comanche | 2.4 /100 | #234 | Tragic 13.3% |
| Immigrants | Zaire | 1.9 /100 | #235 | Tragic 13.4% |
| Crow | 1.6 /100 | #236 | Tragic 13.4% |
| Immigrants | El Salvador | 1.5 /100 | #237 | Tragic 13.5% |
| French American Indians | 1.4 /100 | #238 | Tragic 13.5% |
| Immigrants | Micronesia | 1.3 /100 | #239 | Tragic 13.5% |
| Iroquois | 1.2 /100 | #240 | Tragic 13.5% |
| Choctaw | 1.0 /100 | #241 | Tragic 13.6% |
| Immigrants | Panama | 1.0 /100 | #242 | Tragic 13.6% |
| Somalis | 0.9 /100 | #243 | Tragic 13.7% |
| Cajuns | 0.9 /100 | #244 | Tragic 13.7% |
| Immigrants | Somalia | 0.9 /100 | #245 | Tragic 13.7% |
| Cree | 0.8 /100 | #246 | Tragic 13.7% |
| Mexican American Indians | 0.7 /100 | #247 | Tragic 13.8% |