European vs Argentinean Receiving Food Stamps
COMPARE
European
Argentinean
Receiving Food Stamps
Receiving Food Stamps Comparison
Europeans
Argentineans
9.5%
RECEIVING FOOD STAMPS
99.6/ 100
METRIC RATING
37th/ 347
METRIC RANK
10.8%
RECEIVING FOOD STAMPS
90.2/ 100
METRIC RATING
135th/ 347
METRIC RANK
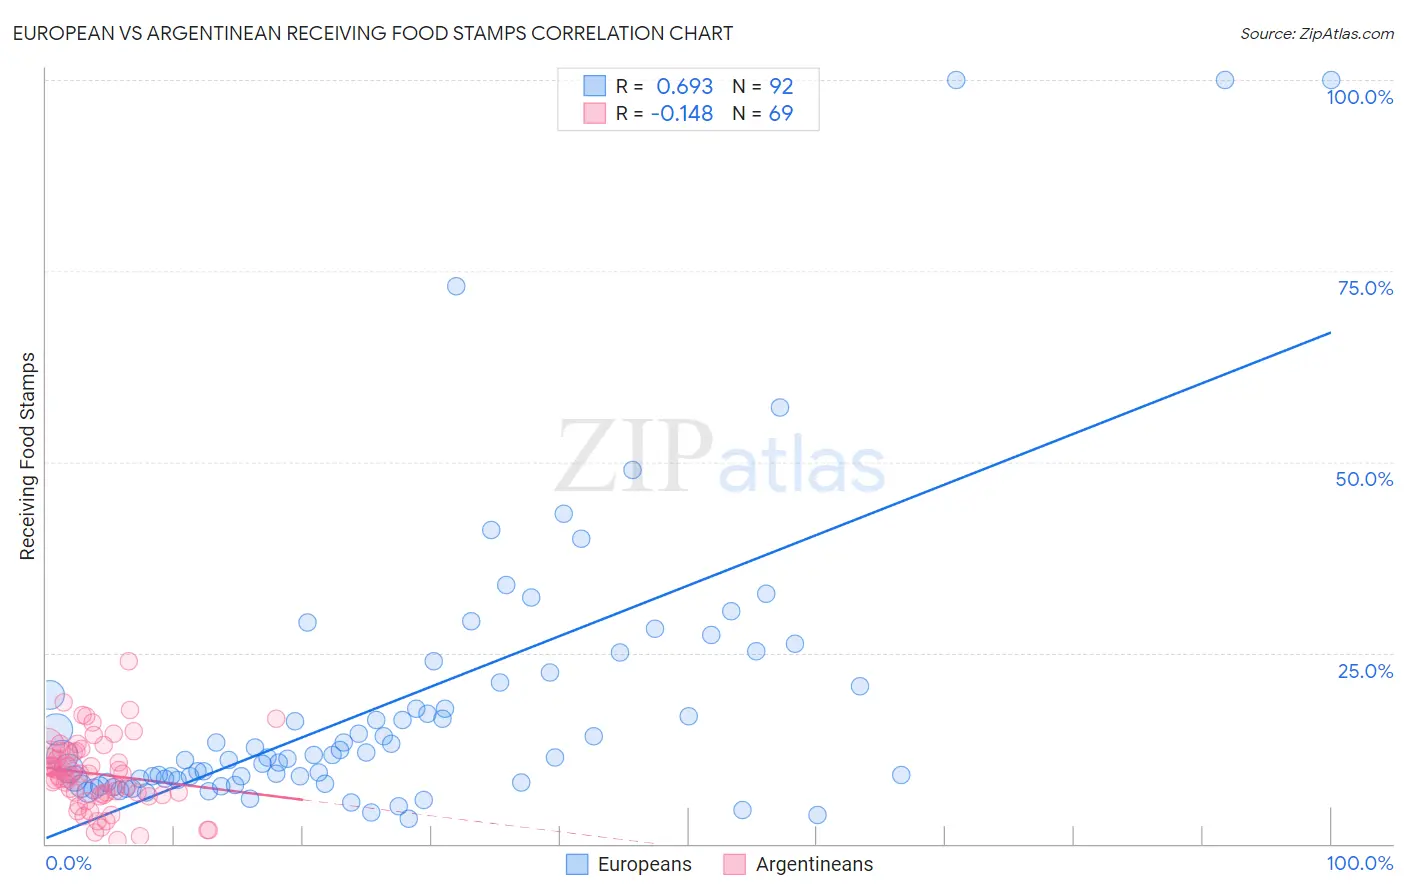
European vs Argentinean Receiving Food Stamps Correlation Chart
The statistical analysis conducted on geographies consisting of 558,520,577 people shows a significant positive correlation between the proportion of Europeans and percentage of population receiving government assistance and/or food stamps in the United States with a correlation coefficient (R) of 0.693 and weighted average of 9.5%. Similarly, the statistical analysis conducted on geographies consisting of 296,410,032 people shows a poor negative correlation between the proportion of Argentineans and percentage of population receiving government assistance and/or food stamps in the United States with a correlation coefficient (R) of -0.148 and weighted average of 10.8%, a difference of 14.0%.
Receiving Food Stamps Correlation Summary
| Measurement | European | Argentinean |
| Minimum | 3.2% | 0.50% |
| Maximum | 100.0% | 23.9% |
| Range | 96.8% | 23.4% |
| Mean | 18.5% | 9.1% |
| Median | 11.4% | 9.1% |
| Interquartile 25% (IQ1) | 8.2% | 6.4% |
| Interquartile 75% (IQ3) | 20.8% | 12.1% |
| Interquartile Range (IQR) | 12.6% | 5.7% |
| Standard Deviation (Sample) | 19.3% | 4.6% |
| Standard Deviation (Population) | 19.2% | 4.6% |
Similar Demographics by Receiving Food Stamps
Demographics Similar to Europeans by Receiving Food Stamps
In terms of receiving food stamps, the demographic groups most similar to Europeans are Estonian (9.5%, a difference of 0.070%), Immigrants from Austria (9.5%, a difference of 0.090%), Turkish (9.5%, a difference of 0.12%), Zimbabwean (9.5%, a difference of 0.13%), and Immigrants from Sri Lanka (9.5%, a difference of 0.29%).
| Demographics | Rating | Rank | Receiving Food Stamps |
| Immigrants | Sweden | 99.7 /100 | #30 | Exceptional 9.3% |
| Immigrants | Eastern Asia | 99.7 /100 | #31 | Exceptional 9.3% |
| Bolivians | 99.7 /100 | #32 | Exceptional 9.3% |
| Zimbabweans | 99.6 /100 | #33 | Exceptional 9.5% |
| Turks | 99.6 /100 | #34 | Exceptional 9.5% |
| Immigrants | Austria | 99.6 /100 | #35 | Exceptional 9.5% |
| Estonians | 99.6 /100 | #36 | Exceptional 9.5% |
| Europeans | 99.6 /100 | #37 | Exceptional 9.5% |
| Immigrants | Sri Lanka | 99.5 /100 | #38 | Exceptional 9.5% |
| Immigrants | Bolivia | 99.5 /100 | #39 | Exceptional 9.5% |
| Immigrants | Netherlands | 99.5 /100 | #40 | Exceptional 9.5% |
| Cambodians | 99.5 /100 | #41 | Exceptional 9.5% |
| Immigrants | China | 99.5 /100 | #42 | Exceptional 9.6% |
| Croatians | 99.5 /100 | #43 | Exceptional 9.6% |
| Immigrants | Denmark | 99.4 /100 | #44 | Exceptional 9.6% |
Demographics Similar to Argentineans by Receiving Food Stamps
In terms of receiving food stamps, the demographic groups most similar to Argentineans are Immigrants from Brazil (10.8%, a difference of 0.020%), Slovak (10.8%, a difference of 0.17%), Immigrants from Eastern Europe (10.8%, a difference of 0.19%), Immigrants from Russia (10.8%, a difference of 0.32%), and Immigrants from Moldova (10.9%, a difference of 0.70%).
| Demographics | Rating | Rank | Receiving Food Stamps |
| Immigrants | Jordan | 92.5 /100 | #128 | Exceptional 10.7% |
| Yugoslavians | 92.5 /100 | #129 | Exceptional 10.7% |
| Israelis | 92.4 /100 | #130 | Exceptional 10.7% |
| French | 92.3 /100 | #131 | Exceptional 10.7% |
| Immigrants | Germany | 92.0 /100 | #132 | Exceptional 10.7% |
| Immigrants | Russia | 90.9 /100 | #133 | Exceptional 10.8% |
| Immigrants | Brazil | 90.3 /100 | #134 | Exceptional 10.8% |
| Argentineans | 90.2 /100 | #135 | Exceptional 10.8% |
| Slovaks | 89.8 /100 | #136 | Excellent 10.8% |
| Immigrants | Eastern Europe | 89.8 /100 | #137 | Excellent 10.8% |
| Immigrants | Moldova | 88.5 /100 | #138 | Excellent 10.9% |
| Hmong | 88.4 /100 | #139 | Excellent 10.9% |
| Celtics | 87.8 /100 | #140 | Excellent 10.9% |
| Immigrants | Vietnam | 86.7 /100 | #141 | Excellent 11.0% |
| Chileans | 86.2 /100 | #142 | Excellent 11.0% |