European vs Chippewa Receiving Food Stamps
COMPARE
European
Chippewa
Receiving Food Stamps
Receiving Food Stamps Comparison
Europeans
Chippewa
9.5%
RECEIVING FOOD STAMPS
99.6/ 100
METRIC RATING
37th/ 347
METRIC RANK
14.7%
RECEIVING FOOD STAMPS
0.1/ 100
METRIC RATING
272nd/ 347
METRIC RANK
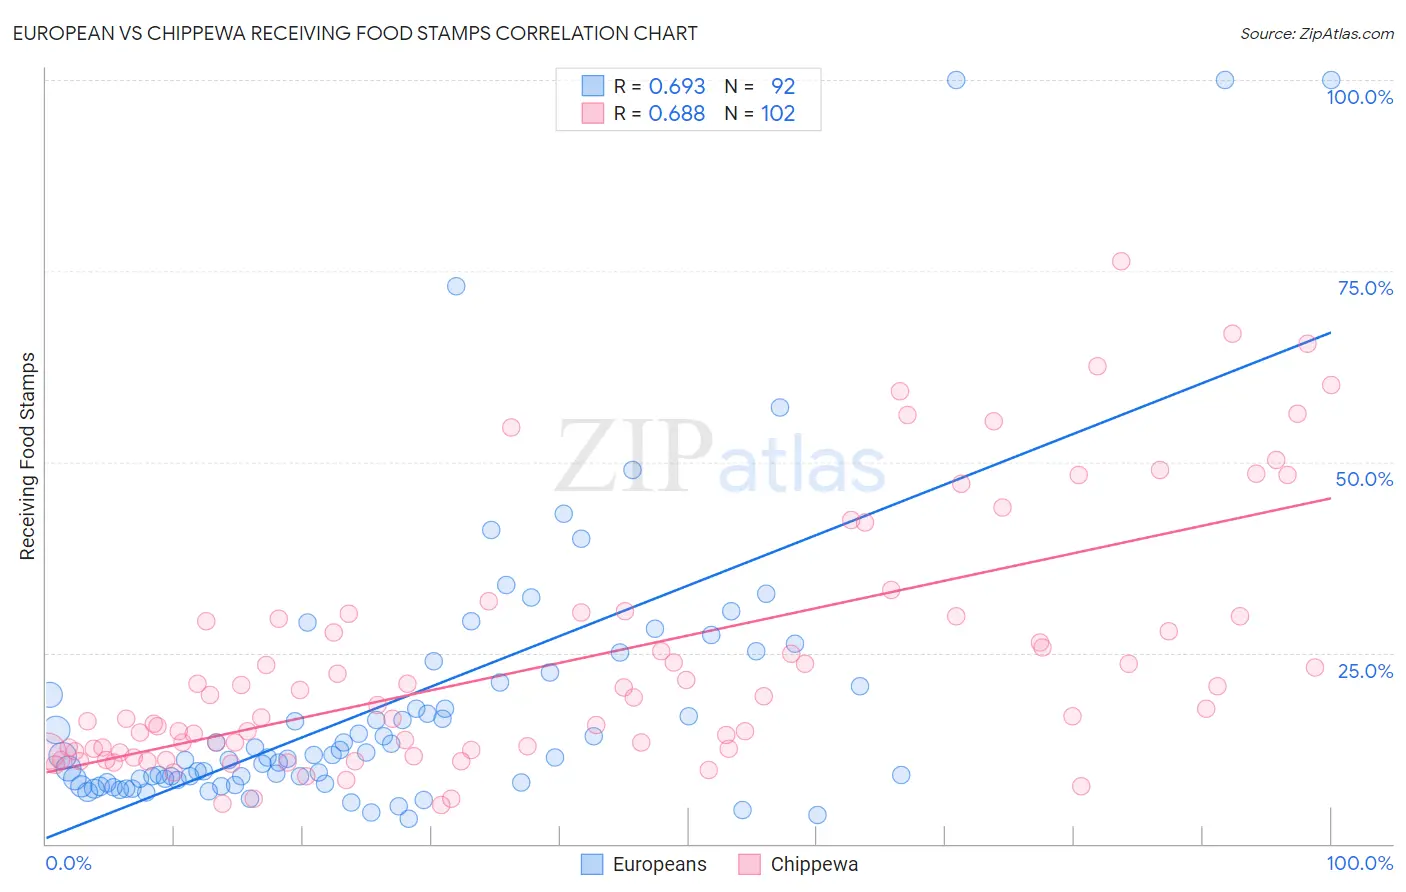
European vs Chippewa Receiving Food Stamps Correlation Chart
The statistical analysis conducted on geographies consisting of 558,520,577 people shows a significant positive correlation between the proportion of Europeans and percentage of population receiving government assistance and/or food stamps in the United States with a correlation coefficient (R) of 0.693 and weighted average of 9.5%. Similarly, the statistical analysis conducted on geographies consisting of 214,846,043 people shows a significant positive correlation between the proportion of Chippewa and percentage of population receiving government assistance and/or food stamps in the United States with a correlation coefficient (R) of 0.688 and weighted average of 14.7%, a difference of 54.6%.
Receiving Food Stamps Correlation Summary
| Measurement | European | Chippewa |
| Minimum | 3.2% | 5.0% |
| Maximum | 100.0% | 76.3% |
| Range | 96.8% | 71.3% |
| Mean | 18.5% | 24.0% |
| Median | 11.4% | 17.9% |
| Interquartile 25% (IQ1) | 8.2% | 12.3% |
| Interquartile 75% (IQ3) | 20.8% | 29.8% |
| Interquartile Range (IQR) | 12.6% | 17.5% |
| Standard Deviation (Sample) | 19.3% | 16.4% |
| Standard Deviation (Population) | 19.2% | 16.3% |
Similar Demographics by Receiving Food Stamps
Demographics Similar to Europeans by Receiving Food Stamps
In terms of receiving food stamps, the demographic groups most similar to Europeans are Estonian (9.5%, a difference of 0.070%), Immigrants from Austria (9.5%, a difference of 0.090%), Turkish (9.5%, a difference of 0.12%), Zimbabwean (9.5%, a difference of 0.13%), and Immigrants from Sri Lanka (9.5%, a difference of 0.29%).
| Demographics | Rating | Rank | Receiving Food Stamps |
| Immigrants | Sweden | 99.7 /100 | #30 | Exceptional 9.3% |
| Immigrants | Eastern Asia | 99.7 /100 | #31 | Exceptional 9.3% |
| Bolivians | 99.7 /100 | #32 | Exceptional 9.3% |
| Zimbabweans | 99.6 /100 | #33 | Exceptional 9.5% |
| Turks | 99.6 /100 | #34 | Exceptional 9.5% |
| Immigrants | Austria | 99.6 /100 | #35 | Exceptional 9.5% |
| Estonians | 99.6 /100 | #36 | Exceptional 9.5% |
| Europeans | 99.6 /100 | #37 | Exceptional 9.5% |
| Immigrants | Sri Lanka | 99.5 /100 | #38 | Exceptional 9.5% |
| Immigrants | Bolivia | 99.5 /100 | #39 | Exceptional 9.5% |
| Immigrants | Netherlands | 99.5 /100 | #40 | Exceptional 9.5% |
| Cambodians | 99.5 /100 | #41 | Exceptional 9.5% |
| Immigrants | China | 99.5 /100 | #42 | Exceptional 9.6% |
| Croatians | 99.5 /100 | #43 | Exceptional 9.6% |
| Immigrants | Denmark | 99.4 /100 | #44 | Exceptional 9.6% |
Demographics Similar to Chippewa by Receiving Food Stamps
In terms of receiving food stamps, the demographic groups most similar to Chippewa are Alaskan Athabascan (14.7%, a difference of 0.030%), Immigrants from Western Africa (14.7%, a difference of 0.050%), Ute (14.7%, a difference of 0.13%), Immigrants from Guatemala (14.6%, a difference of 0.22%), and Mexican (14.6%, a difference of 0.32%).
| Demographics | Rating | Rank | Receiving Food Stamps |
| Blackfeet | 0.2 /100 | #265 | Tragic 14.3% |
| Cheyenne | 0.2 /100 | #266 | Tragic 14.3% |
| Dutch West Indians | 0.2 /100 | #267 | Tragic 14.3% |
| Guatemalans | 0.1 /100 | #268 | Tragic 14.4% |
| Nepalese | 0.1 /100 | #269 | Tragic 14.6% |
| Mexicans | 0.1 /100 | #270 | Tragic 14.6% |
| Immigrants | Guatemala | 0.1 /100 | #271 | Tragic 14.6% |
| Chippewa | 0.1 /100 | #272 | Tragic 14.7% |
| Alaskan Athabascans | 0.1 /100 | #273 | Tragic 14.7% |
| Immigrants | Western Africa | 0.1 /100 | #274 | Tragic 14.7% |
| Ute | 0.1 /100 | #275 | Tragic 14.7% |
| Liberians | 0.1 /100 | #276 | Tragic 14.8% |
| Seminole | 0.1 /100 | #277 | Tragic 14.8% |
| Belizeans | 0.1 /100 | #278 | Tragic 14.8% |
| Kiowa | 0.0 /100 | #279 | Tragic 14.9% |