Delaware vs Immigrants from Guatemala Receiving Food Stamps
COMPARE
Delaware
Immigrants from Guatemala
Receiving Food Stamps
Receiving Food Stamps Comparison
Delaware
Immigrants from Guatemala
12.2%
RECEIVING FOOD STAMPS
26.1/ 100
METRIC RATING
197th/ 347
METRIC RANK
14.6%
RECEIVING FOOD STAMPS
0.1/ 100
METRIC RATING
271st/ 347
METRIC RANK
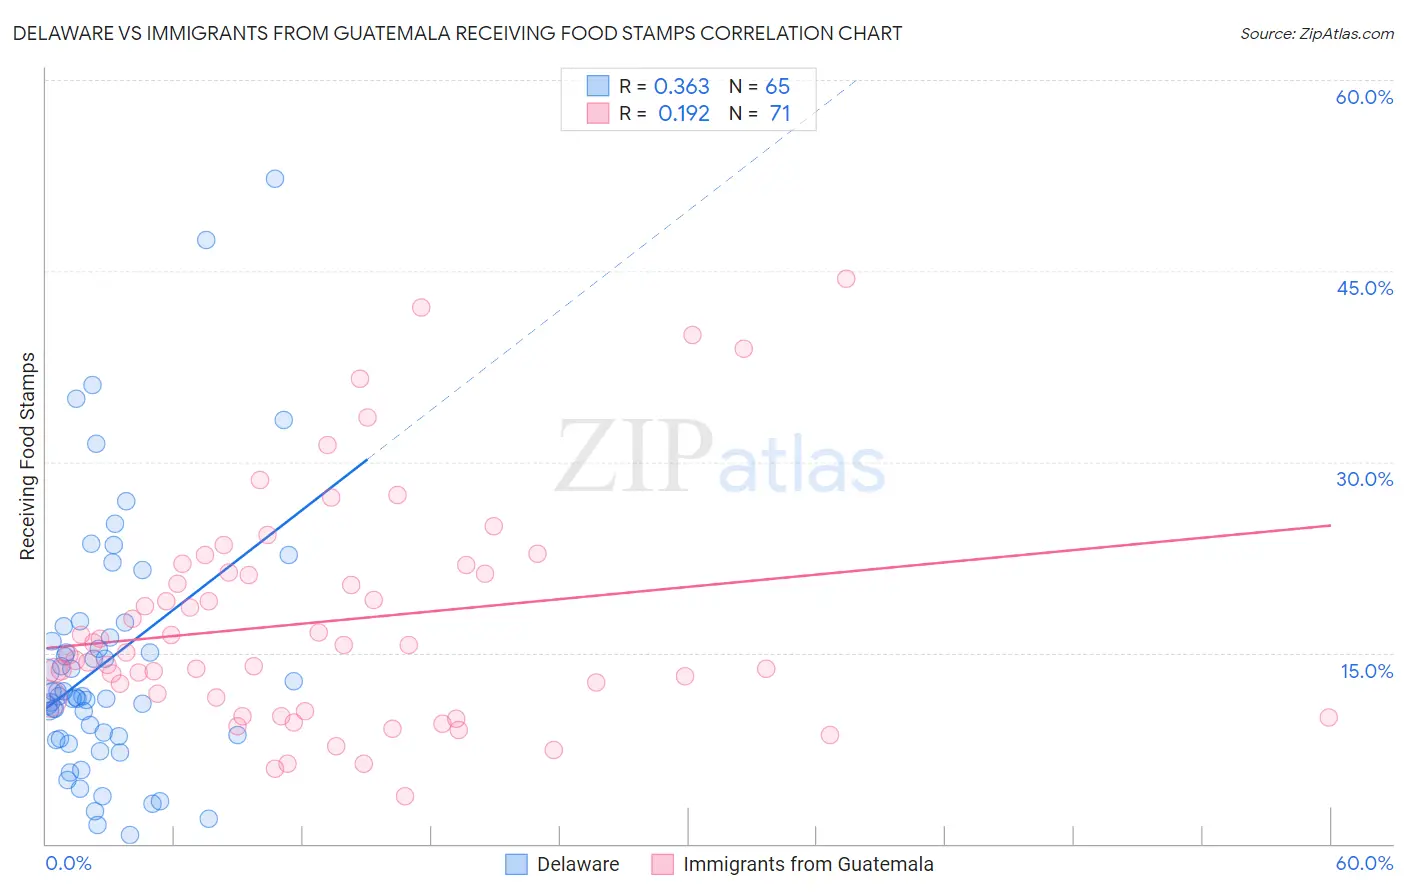
Delaware vs Immigrants from Guatemala Receiving Food Stamps Correlation Chart
The statistical analysis conducted on geographies consisting of 96,117,712 people shows a mild positive correlation between the proportion of Delaware and percentage of population receiving government assistance and/or food stamps in the United States with a correlation coefficient (R) of 0.363 and weighted average of 12.2%. Similarly, the statistical analysis conducted on geographies consisting of 376,736,274 people shows a poor positive correlation between the proportion of Immigrants from Guatemala and percentage of population receiving government assistance and/or food stamps in the United States with a correlation coefficient (R) of 0.192 and weighted average of 14.6%, a difference of 20.4%.
Receiving Food Stamps Correlation Summary
| Measurement | Delaware | Immigrants from Guatemala |
| Minimum | 0.70% | 3.7% |
| Maximum | 52.2% | 44.4% |
| Range | 51.5% | 40.7% |
| Mean | 14.3% | 17.4% |
| Median | 11.6% | 15.1% |
| Interquartile 25% (IQ1) | 8.4% | 11.4% |
| Interquartile 75% (IQ3) | 16.7% | 21.3% |
| Interquartile Range (IQR) | 8.3% | 10.0% |
| Standard Deviation (Sample) | 10.1% | 8.9% |
| Standard Deviation (Population) | 10.1% | 8.8% |
Similar Demographics by Receiving Food Stamps
Demographics Similar to Delaware by Receiving Food Stamps
In terms of receiving food stamps, the demographic groups most similar to Delaware are Iraqi (12.2%, a difference of 0.080%), American (12.2%, a difference of 0.11%), Immigrants from Costa Rica (12.2%, a difference of 0.13%), Immigrants from Sudan (12.1%, a difference of 0.17%), and Portuguese (12.2%, a difference of 0.18%).
| Demographics | Rating | Rank | Receiving Food Stamps |
| Immigrants | Peru | 32.2 /100 | #190 | Fair 12.0% |
| Venezuelans | 32.1 /100 | #191 | Fair 12.0% |
| Samoans | 31.0 /100 | #192 | Fair 12.1% |
| Immigrants | Fiji | 27.8 /100 | #193 | Fair 12.1% |
| Immigrants | Sudan | 27.1 /100 | #194 | Fair 12.1% |
| Americans | 26.7 /100 | #195 | Fair 12.2% |
| Iraqis | 26.6 /100 | #196 | Fair 12.2% |
| Delaware | 26.1 /100 | #197 | Fair 12.2% |
| Immigrants | Costa Rica | 25.4 /100 | #198 | Fair 12.2% |
| Portuguese | 25.1 /100 | #199 | Fair 12.2% |
| Sierra Leoneans | 23.6 /100 | #200 | Fair 12.2% |
| Ugandans | 22.5 /100 | #201 | Fair 12.2% |
| Immigrants | Venezuela | 20.1 /100 | #202 | Fair 12.3% |
| Shoshone | 17.7 /100 | #203 | Poor 12.4% |
| Immigrants | Nonimmigrants | 17.6 /100 | #204 | Poor 12.4% |
Demographics Similar to Immigrants from Guatemala by Receiving Food Stamps
In terms of receiving food stamps, the demographic groups most similar to Immigrants from Guatemala are Mexican (14.6%, a difference of 0.090%), Chippewa (14.7%, a difference of 0.22%), Alaskan Athabascan (14.7%, a difference of 0.25%), Immigrants from Western Africa (14.7%, a difference of 0.27%), and Nepalese (14.6%, a difference of 0.30%).
| Demographics | Rating | Rank | Receiving Food Stamps |
| Immigrants | Uzbekistan | 0.2 /100 | #264 | Tragic 14.3% |
| Blackfeet | 0.2 /100 | #265 | Tragic 14.3% |
| Cheyenne | 0.2 /100 | #266 | Tragic 14.3% |
| Dutch West Indians | 0.2 /100 | #267 | Tragic 14.3% |
| Guatemalans | 0.1 /100 | #268 | Tragic 14.4% |
| Nepalese | 0.1 /100 | #269 | Tragic 14.6% |
| Mexicans | 0.1 /100 | #270 | Tragic 14.6% |
| Immigrants | Guatemala | 0.1 /100 | #271 | Tragic 14.6% |
| Chippewa | 0.1 /100 | #272 | Tragic 14.7% |
| Alaskan Athabascans | 0.1 /100 | #273 | Tragic 14.7% |
| Immigrants | Western Africa | 0.1 /100 | #274 | Tragic 14.7% |
| Ute | 0.1 /100 | #275 | Tragic 14.7% |
| Liberians | 0.1 /100 | #276 | Tragic 14.8% |
| Seminole | 0.1 /100 | #277 | Tragic 14.8% |
| Belizeans | 0.1 /100 | #278 | Tragic 14.8% |