Delaware vs South American Receiving Food Stamps
COMPARE
Delaware
South American
Receiving Food Stamps
Receiving Food Stamps Comparison
Delaware
South Americans
12.2%
RECEIVING FOOD STAMPS
26.1/ 100
METRIC RATING
197th/ 347
METRIC RANK
12.4%
RECEIVING FOOD STAMPS
16.0/ 100
METRIC RATING
207th/ 347
METRIC RANK
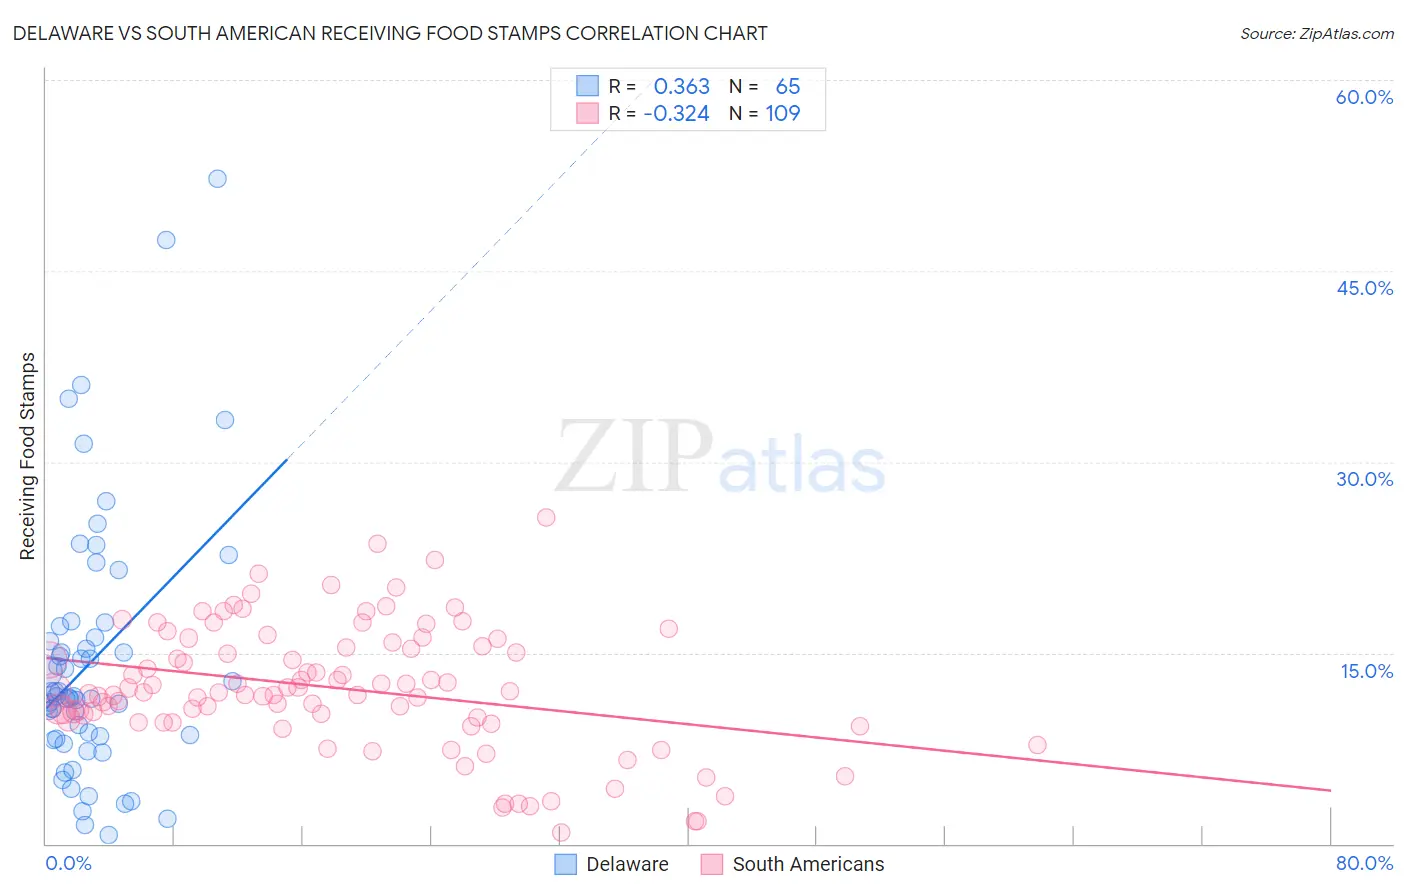
Delaware vs South American Receiving Food Stamps Correlation Chart
The statistical analysis conducted on geographies consisting of 96,117,712 people shows a mild positive correlation between the proportion of Delaware and percentage of population receiving government assistance and/or food stamps in the United States with a correlation coefficient (R) of 0.363 and weighted average of 12.2%. Similarly, the statistical analysis conducted on geographies consisting of 491,814,121 people shows a mild negative correlation between the proportion of South Americans and percentage of population receiving government assistance and/or food stamps in the United States with a correlation coefficient (R) of -0.324 and weighted average of 12.4%, a difference of 2.1%.
Receiving Food Stamps Correlation Summary
| Measurement | Delaware | South American |
| Minimum | 0.70% | 0.90% |
| Maximum | 52.2% | 25.6% |
| Range | 51.5% | 24.7% |
| Mean | 14.3% | 12.2% |
| Median | 11.6% | 11.9% |
| Interquartile 25% (IQ1) | 8.4% | 9.7% |
| Interquartile 75% (IQ3) | 16.7% | 15.6% |
| Interquartile Range (IQR) | 8.3% | 6.0% |
| Standard Deviation (Sample) | 10.1% | 4.9% |
| Standard Deviation (Population) | 10.1% | 4.9% |
Demographics Similar to Delaware and South Americans by Receiving Food Stamps
In terms of receiving food stamps, the demographic groups most similar to Delaware are Iraqi (12.2%, a difference of 0.080%), American (12.2%, a difference of 0.11%), Immigrants from Costa Rica (12.2%, a difference of 0.13%), Immigrants from Sudan (12.1%, a difference of 0.17%), and Portuguese (12.2%, a difference of 0.18%). Similarly, the demographic groups most similar to South Americans are Immigrants from Thailand (12.4%, a difference of 0.26%), Aleut (12.4%, a difference of 0.33%), Potawatomi (12.5%, a difference of 0.36%), Nonimmigrants (12.4%, a difference of 0.39%), and Shoshone (12.4%, a difference of 0.42%).
| Demographics | Rating | Rank | Receiving Food Stamps |
| Samoans | 31.0 /100 | #192 | Fair 12.1% |
| Immigrants | Fiji | 27.8 /100 | #193 | Fair 12.1% |
| Immigrants | Sudan | 27.1 /100 | #194 | Fair 12.1% |
| Americans | 26.7 /100 | #195 | Fair 12.2% |
| Iraqis | 26.6 /100 | #196 | Fair 12.2% |
| Delaware | 26.1 /100 | #197 | Fair 12.2% |
| Immigrants | Costa Rica | 25.4 /100 | #198 | Fair 12.2% |
| Portuguese | 25.1 /100 | #199 | Fair 12.2% |
| Sierra Leoneans | 23.6 /100 | #200 | Fair 12.2% |
| Ugandans | 22.5 /100 | #201 | Fair 12.2% |
| Immigrants | Venezuela | 20.1 /100 | #202 | Fair 12.3% |
| Shoshone | 17.7 /100 | #203 | Poor 12.4% |
| Immigrants | Nonimmigrants | 17.6 /100 | #204 | Poor 12.4% |
| Aleuts | 17.3 /100 | #205 | Poor 12.4% |
| Immigrants | Thailand | 17.0 /100 | #206 | Poor 12.4% |
| South Americans | 16.0 /100 | #207 | Poor 12.4% |
| Potawatomi | 14.6 /100 | #208 | Poor 12.5% |
| Immigrants | Sierra Leone | 12.9 /100 | #209 | Poor 12.5% |
| Immigrants | Uruguay | 12.8 /100 | #210 | Poor 12.5% |
| Colombians | 10.2 /100 | #211 | Poor 12.6% |
| Malaysians | 8.5 /100 | #212 | Tragic 12.7% |