Delaware vs Immigrants from the Azores Receiving Food Stamps
COMPARE
Delaware
Immigrants from the Azores
Receiving Food Stamps
Receiving Food Stamps Comparison
Delaware
Immigrants from the Azores
12.2%
RECEIVING FOOD STAMPS
26.1/ 100
METRIC RATING
197th/ 347
METRIC RANK
16.4%
RECEIVING FOOD STAMPS
0.0/ 100
METRIC RATING
305th/ 347
METRIC RANK
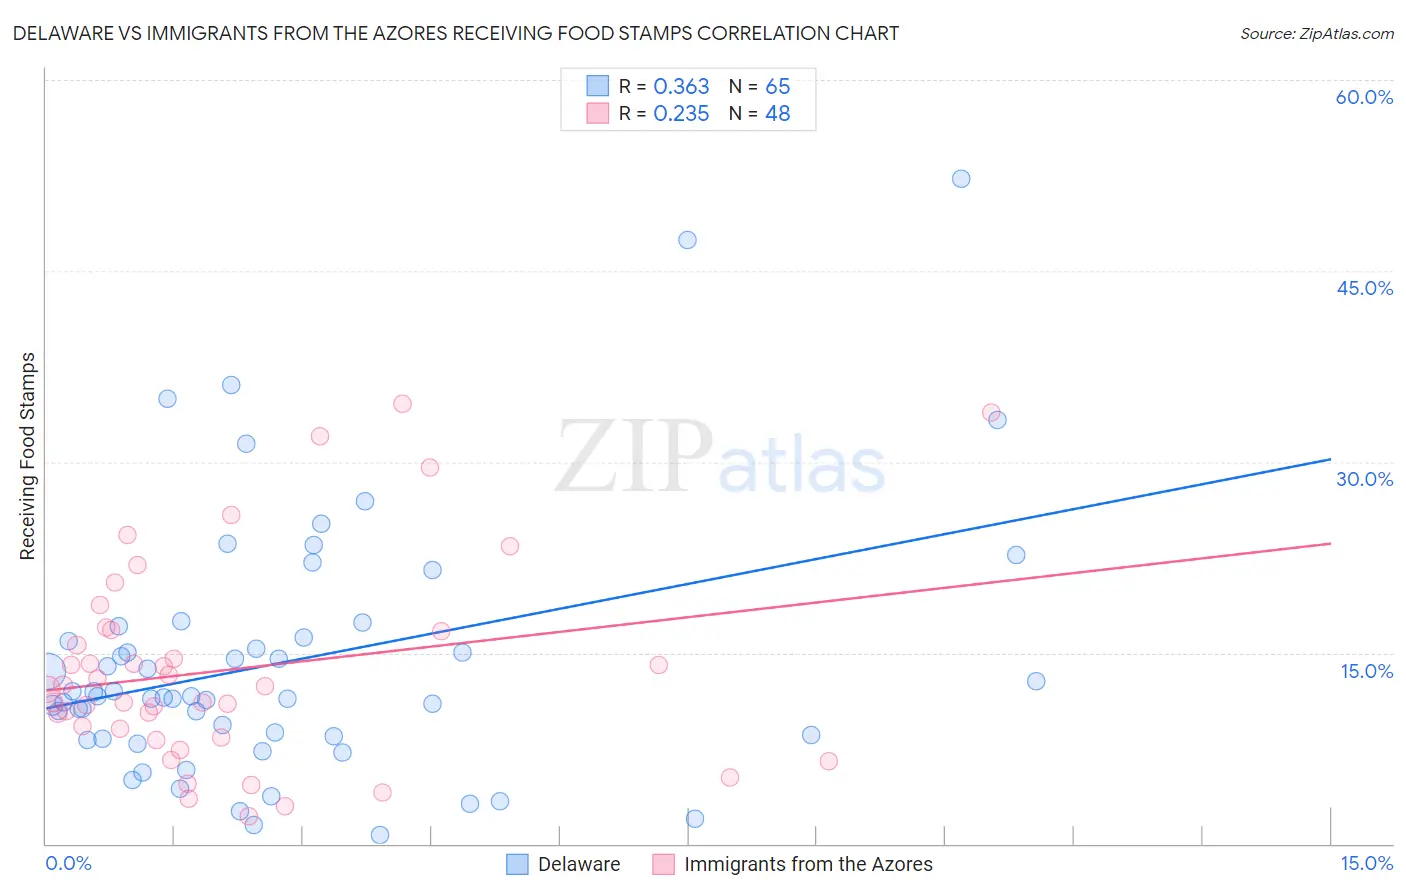
Delaware vs Immigrants from the Azores Receiving Food Stamps Correlation Chart
The statistical analysis conducted on geographies consisting of 96,117,712 people shows a mild positive correlation between the proportion of Delaware and percentage of population receiving government assistance and/or food stamps in the United States with a correlation coefficient (R) of 0.363 and weighted average of 12.2%. Similarly, the statistical analysis conducted on geographies consisting of 46,243,454 people shows a weak positive correlation between the proportion of Immigrants from the Azores and percentage of population receiving government assistance and/or food stamps in the United States with a correlation coefficient (R) of 0.235 and weighted average of 16.4%, a difference of 34.8%.
Receiving Food Stamps Correlation Summary
| Measurement | Delaware | Immigrants from the Azores |
| Minimum | 0.70% | 2.2% |
| Maximum | 52.2% | 34.6% |
| Range | 51.5% | 32.4% |
| Mean | 14.3% | 13.7% |
| Median | 11.6% | 12.3% |
| Interquartile 25% (IQ1) | 8.4% | 8.7% |
| Interquartile 75% (IQ3) | 16.7% | 16.7% |
| Interquartile Range (IQR) | 8.3% | 8.1% |
| Standard Deviation (Sample) | 10.1% | 7.9% |
| Standard Deviation (Population) | 10.1% | 7.9% |
Similar Demographics by Receiving Food Stamps
Demographics Similar to Delaware by Receiving Food Stamps
In terms of receiving food stamps, the demographic groups most similar to Delaware are Iraqi (12.2%, a difference of 0.080%), American (12.2%, a difference of 0.11%), Immigrants from Costa Rica (12.2%, a difference of 0.13%), Immigrants from Sudan (12.1%, a difference of 0.17%), and Portuguese (12.2%, a difference of 0.18%).
| Demographics | Rating | Rank | Receiving Food Stamps |
| Immigrants | Peru | 32.2 /100 | #190 | Fair 12.0% |
| Venezuelans | 32.1 /100 | #191 | Fair 12.0% |
| Samoans | 31.0 /100 | #192 | Fair 12.1% |
| Immigrants | Fiji | 27.8 /100 | #193 | Fair 12.1% |
| Immigrants | Sudan | 27.1 /100 | #194 | Fair 12.1% |
| Americans | 26.7 /100 | #195 | Fair 12.2% |
| Iraqis | 26.6 /100 | #196 | Fair 12.2% |
| Delaware | 26.1 /100 | #197 | Fair 12.2% |
| Immigrants | Costa Rica | 25.4 /100 | #198 | Fair 12.2% |
| Portuguese | 25.1 /100 | #199 | Fair 12.2% |
| Sierra Leoneans | 23.6 /100 | #200 | Fair 12.2% |
| Ugandans | 22.5 /100 | #201 | Fair 12.2% |
| Immigrants | Venezuela | 20.1 /100 | #202 | Fair 12.3% |
| Shoshone | 17.7 /100 | #203 | Poor 12.4% |
| Immigrants | Nonimmigrants | 17.6 /100 | #204 | Poor 12.4% |
Demographics Similar to Immigrants from the Azores by Receiving Food Stamps
In terms of receiving food stamps, the demographic groups most similar to Immigrants from the Azores are Jamaican (16.4%, a difference of 0.070%), Houma (16.5%, a difference of 0.35%), Barbadian (16.5%, a difference of 0.62%), U.S. Virgin Islander (16.5%, a difference of 0.86%), and West Indian (16.3%, a difference of 0.88%).
| Demographics | Rating | Rank | Receiving Food Stamps |
| Immigrants | Trinidad and Tobago | 0.0 /100 | #298 | Tragic 15.8% |
| Hispanics or Latinos | 0.0 /100 | #299 | Tragic 15.8% |
| Immigrants | Bangladesh | 0.0 /100 | #300 | Tragic 15.9% |
| Trinidadians and Tobagonians | 0.0 /100 | #301 | Tragic 16.0% |
| Immigrants | West Indies | 0.0 /100 | #302 | Tragic 16.1% |
| Nicaraguans | 0.0 /100 | #303 | Tragic 16.1% |
| West Indians | 0.0 /100 | #304 | Tragic 16.3% |
| Immigrants | Azores | 0.0 /100 | #305 | Tragic 16.4% |
| Jamaicans | 0.0 /100 | #306 | Tragic 16.4% |
| Houma | 0.0 /100 | #307 | Tragic 16.5% |
| Barbadians | 0.0 /100 | #308 | Tragic 16.5% |
| U.S. Virgin Islanders | 0.0 /100 | #309 | Tragic 16.5% |
| Immigrants | Barbados | 0.0 /100 | #310 | Tragic 16.6% |
| Guyanese | 0.0 /100 | #311 | Tragic 16.7% |
| Sioux | 0.0 /100 | #312 | Tragic 16.8% |