Delaware vs Apache Receiving Food Stamps
COMPARE
Delaware
Apache
Receiving Food Stamps
Receiving Food Stamps Comparison
Delaware
Apache
12.2%
RECEIVING FOOD STAMPS
26.1/ 100
METRIC RATING
197th/ 347
METRIC RANK
18.3%
RECEIVING FOOD STAMPS
0.0/ 100
METRIC RATING
327th/ 347
METRIC RANK
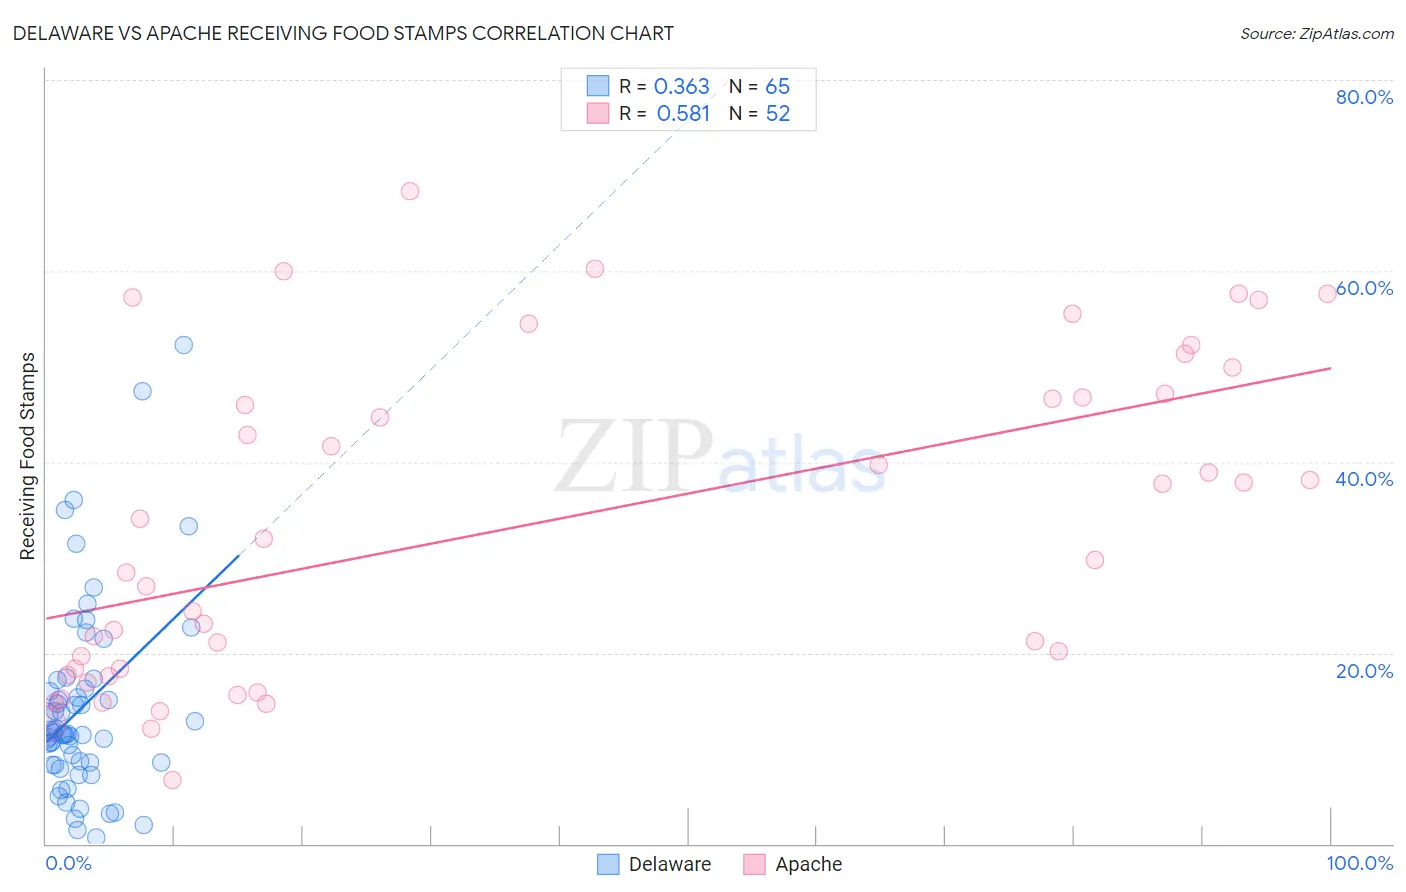
Delaware vs Apache Receiving Food Stamps Correlation Chart
The statistical analysis conducted on geographies consisting of 96,117,712 people shows a mild positive correlation between the proportion of Delaware and percentage of population receiving government assistance and/or food stamps in the United States with a correlation coefficient (R) of 0.363 and weighted average of 12.2%. Similarly, the statistical analysis conducted on geographies consisting of 230,963,565 people shows a substantial positive correlation between the proportion of Apache and percentage of population receiving government assistance and/or food stamps in the United States with a correlation coefficient (R) of 0.581 and weighted average of 18.3%, a difference of 50.3%.
Receiving Food Stamps Correlation Summary
| Measurement | Delaware | Apache |
| Minimum | 0.70% | 6.6% |
| Maximum | 52.2% | 68.4% |
| Range | 51.5% | 61.8% |
| Mean | 14.3% | 33.4% |
| Median | 11.6% | 30.8% |
| Interquartile 25% (IQ1) | 8.4% | 18.0% |
| Interquartile 75% (IQ3) | 16.7% | 47.0% |
| Interquartile Range (IQR) | 8.3% | 29.0% |
| Standard Deviation (Sample) | 10.1% | 16.8% |
| Standard Deviation (Population) | 10.1% | 16.6% |
Similar Demographics by Receiving Food Stamps
Demographics Similar to Delaware by Receiving Food Stamps
In terms of receiving food stamps, the demographic groups most similar to Delaware are Iraqi (12.2%, a difference of 0.080%), American (12.2%, a difference of 0.11%), Immigrants from Costa Rica (12.2%, a difference of 0.13%), Immigrants from Sudan (12.1%, a difference of 0.17%), and Portuguese (12.2%, a difference of 0.18%).
| Demographics | Rating | Rank | Receiving Food Stamps |
| Immigrants | Peru | 32.2 /100 | #190 | Fair 12.0% |
| Venezuelans | 32.1 /100 | #191 | Fair 12.0% |
| Samoans | 31.0 /100 | #192 | Fair 12.1% |
| Immigrants | Fiji | 27.8 /100 | #193 | Fair 12.1% |
| Immigrants | Sudan | 27.1 /100 | #194 | Fair 12.1% |
| Americans | 26.7 /100 | #195 | Fair 12.2% |
| Iraqis | 26.6 /100 | #196 | Fair 12.2% |
| Delaware | 26.1 /100 | #197 | Fair 12.2% |
| Immigrants | Costa Rica | 25.4 /100 | #198 | Fair 12.2% |
| Portuguese | 25.1 /100 | #199 | Fair 12.2% |
| Sierra Leoneans | 23.6 /100 | #200 | Fair 12.2% |
| Ugandans | 22.5 /100 | #201 | Fair 12.2% |
| Immigrants | Venezuela | 20.1 /100 | #202 | Fair 12.3% |
| Shoshone | 17.7 /100 | #203 | Poor 12.4% |
| Immigrants | Nonimmigrants | 17.6 /100 | #204 | Poor 12.4% |
Demographics Similar to Apache by Receiving Food Stamps
In terms of receiving food stamps, the demographic groups most similar to Apache are Colville (18.3%, a difference of 0.21%), Cuban (18.2%, a difference of 0.31%), Immigrants from Haiti (18.2%, a difference of 0.42%), Immigrants from Dominica (18.4%, a difference of 0.67%), and British West Indian (17.9%, a difference of 2.2%).
| Demographics | Rating | Rank | Receiving Food Stamps |
| Immigrants | Nicaragua | 0.0 /100 | #320 | Tragic 17.2% |
| Natives/Alaskans | 0.0 /100 | #321 | Tragic 17.3% |
| Immigrants | Grenada | 0.0 /100 | #322 | Tragic 17.8% |
| Haitians | 0.0 /100 | #323 | Tragic 17.8% |
| British West Indians | 0.0 /100 | #324 | Tragic 17.9% |
| Immigrants | Haiti | 0.0 /100 | #325 | Tragic 18.2% |
| Cubans | 0.0 /100 | #326 | Tragic 18.2% |
| Apache | 0.0 /100 | #327 | Tragic 18.3% |
| Colville | 0.0 /100 | #328 | Tragic 18.3% |
| Immigrants | Dominica | 0.0 /100 | #329 | Tragic 18.4% |
| Pima | 0.0 /100 | #330 | Tragic 19.0% |
| Immigrants | Caribbean | 0.0 /100 | #331 | Tragic 19.6% |
| Pueblo | 0.0 /100 | #332 | Tragic 19.9% |
| Inupiat | 0.0 /100 | #333 | Tragic 20.1% |
| Yuman | 0.0 /100 | #334 | Tragic 20.2% |