Armenian vs Jamaican Receiving Food Stamps
COMPARE
Armenian
Jamaican
Receiving Food Stamps
Receiving Food Stamps Comparison
Armenians
Jamaicans
11.1%
RECEIVING FOOD STAMPS
81.4/ 100
METRIC RATING
154th/ 347
METRIC RANK
16.4%
RECEIVING FOOD STAMPS
0.0/ 100
METRIC RATING
306th/ 347
METRIC RANK
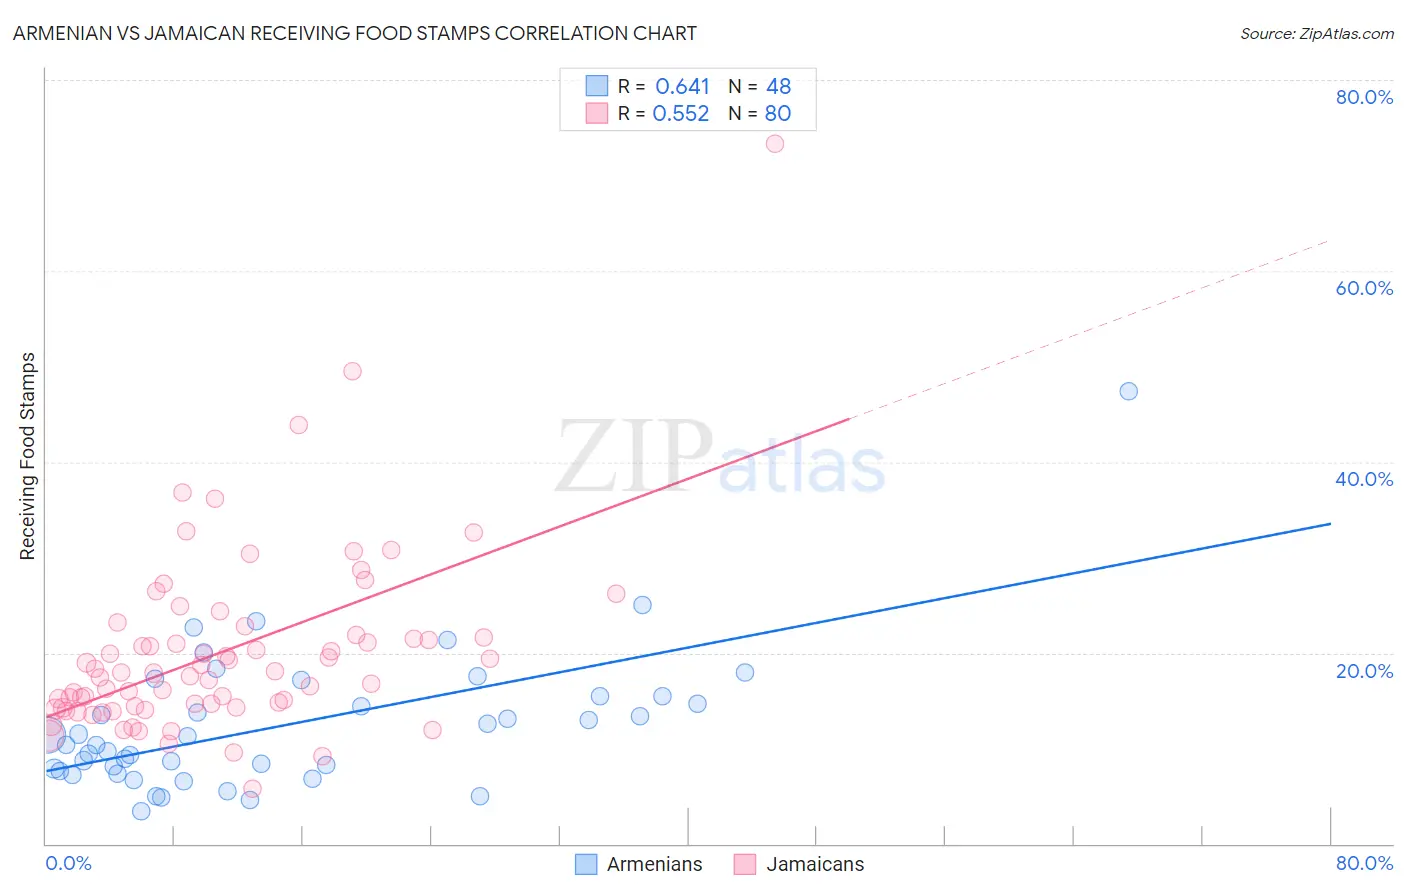
Armenian vs Jamaican Receiving Food Stamps Correlation Chart
The statistical analysis conducted on geographies consisting of 309,974,656 people shows a significant positive correlation between the proportion of Armenians and percentage of population receiving government assistance and/or food stamps in the United States with a correlation coefficient (R) of 0.641 and weighted average of 11.1%. Similarly, the statistical analysis conducted on geographies consisting of 367,071,648 people shows a substantial positive correlation between the proportion of Jamaicans and percentage of population receiving government assistance and/or food stamps in the United States with a correlation coefficient (R) of 0.552 and weighted average of 16.4%, a difference of 47.4%.
Receiving Food Stamps Correlation Summary
| Measurement | Armenian | Jamaican |
| Minimum | 3.5% | 5.8% |
| Maximum | 47.4% | 73.3% |
| Range | 43.9% | 67.5% |
| Mean | 12.5% | 20.1% |
| Median | 10.8% | 17.9% |
| Interquartile 25% (IQ1) | 7.7% | 14.4% |
| Interquartile 75% (IQ3) | 15.4% | 21.7% |
| Interquartile Range (IQR) | 7.7% | 7.3% |
| Standard Deviation (Sample) | 7.4% | 9.8% |
| Standard Deviation (Population) | 7.4% | 9.7% |
Similar Demographics by Receiving Food Stamps
Demographics Similar to Armenians by Receiving Food Stamps
In terms of receiving food stamps, the demographic groups most similar to Armenians are Lebanese (11.1%, a difference of 0.060%), Immigrants from Kazakhstan (11.1%, a difference of 0.080%), Immigrants from Spain (11.1%, a difference of 0.090%), Immigrants from Argentina (11.2%, a difference of 0.25%), and Soviet Union (11.1%, a difference of 0.45%).
| Demographics | Rating | Rank | Receiving Food Stamps |
| Whites/Caucasians | 83.9 /100 | #147 | Excellent 11.1% |
| Immigrants | South Eastern Asia | 83.3 /100 | #148 | Excellent 11.1% |
| Brazilians | 83.2 /100 | #149 | Excellent 11.1% |
| Soviet Union | 83.1 /100 | #150 | Excellent 11.1% |
| Immigrants | Spain | 81.7 /100 | #151 | Excellent 11.1% |
| Immigrants | Kazakhstan | 81.7 /100 | #152 | Excellent 11.1% |
| Lebanese | 81.6 /100 | #153 | Excellent 11.1% |
| Armenians | 81.4 /100 | #154 | Excellent 11.1% |
| Immigrants | Argentina | 80.4 /100 | #155 | Excellent 11.2% |
| Immigrants | Afghanistan | 75.6 /100 | #156 | Good 11.3% |
| Immigrants | Lebanon | 75.2 /100 | #157 | Good 11.3% |
| Immigrants | Bosnia and Herzegovina | 72.6 /100 | #158 | Good 11.3% |
| Immigrants | Oceania | 70.4 /100 | #159 | Good 11.4% |
| French Canadians | 69.5 /100 | #160 | Good 11.4% |
| Pennsylvania Germans | 68.4 /100 | #161 | Good 11.4% |
Demographics Similar to Jamaicans by Receiving Food Stamps
In terms of receiving food stamps, the demographic groups most similar to Jamaicans are Immigrants from the Azores (16.4%, a difference of 0.070%), Houma (16.5%, a difference of 0.29%), Barbadian (16.5%, a difference of 0.55%), U.S. Virgin Islander (16.5%, a difference of 0.79%), and West Indian (16.3%, a difference of 0.94%).
| Demographics | Rating | Rank | Receiving Food Stamps |
| Hispanics or Latinos | 0.0 /100 | #299 | Tragic 15.8% |
| Immigrants | Bangladesh | 0.0 /100 | #300 | Tragic 15.9% |
| Trinidadians and Tobagonians | 0.0 /100 | #301 | Tragic 16.0% |
| Immigrants | West Indies | 0.0 /100 | #302 | Tragic 16.1% |
| Nicaraguans | 0.0 /100 | #303 | Tragic 16.1% |
| West Indians | 0.0 /100 | #304 | Tragic 16.3% |
| Immigrants | Azores | 0.0 /100 | #305 | Tragic 16.4% |
| Jamaicans | 0.0 /100 | #306 | Tragic 16.4% |
| Houma | 0.0 /100 | #307 | Tragic 16.5% |
| Barbadians | 0.0 /100 | #308 | Tragic 16.5% |
| U.S. Virgin Islanders | 0.0 /100 | #309 | Tragic 16.5% |
| Immigrants | Barbados | 0.0 /100 | #310 | Tragic 16.6% |
| Guyanese | 0.0 /100 | #311 | Tragic 16.7% |
| Sioux | 0.0 /100 | #312 | Tragic 16.8% |
| Immigrants | Jamaica | 0.0 /100 | #313 | Tragic 16.9% |