Tsimshian vs South American Indian Single Female Poverty
COMPARE
Tsimshian
South American Indian
Single Female Poverty
Single Female Poverty Comparison
Tsimshian
South American Indians
19.1%
SINGLE FEMALE POVERTY
99.7/ 100
METRIC RATING
53rd/ 347
METRIC RANK
20.6%
SINGLE FEMALE POVERTY
75.7/ 100
METRIC RATING
156th/ 347
METRIC RANK
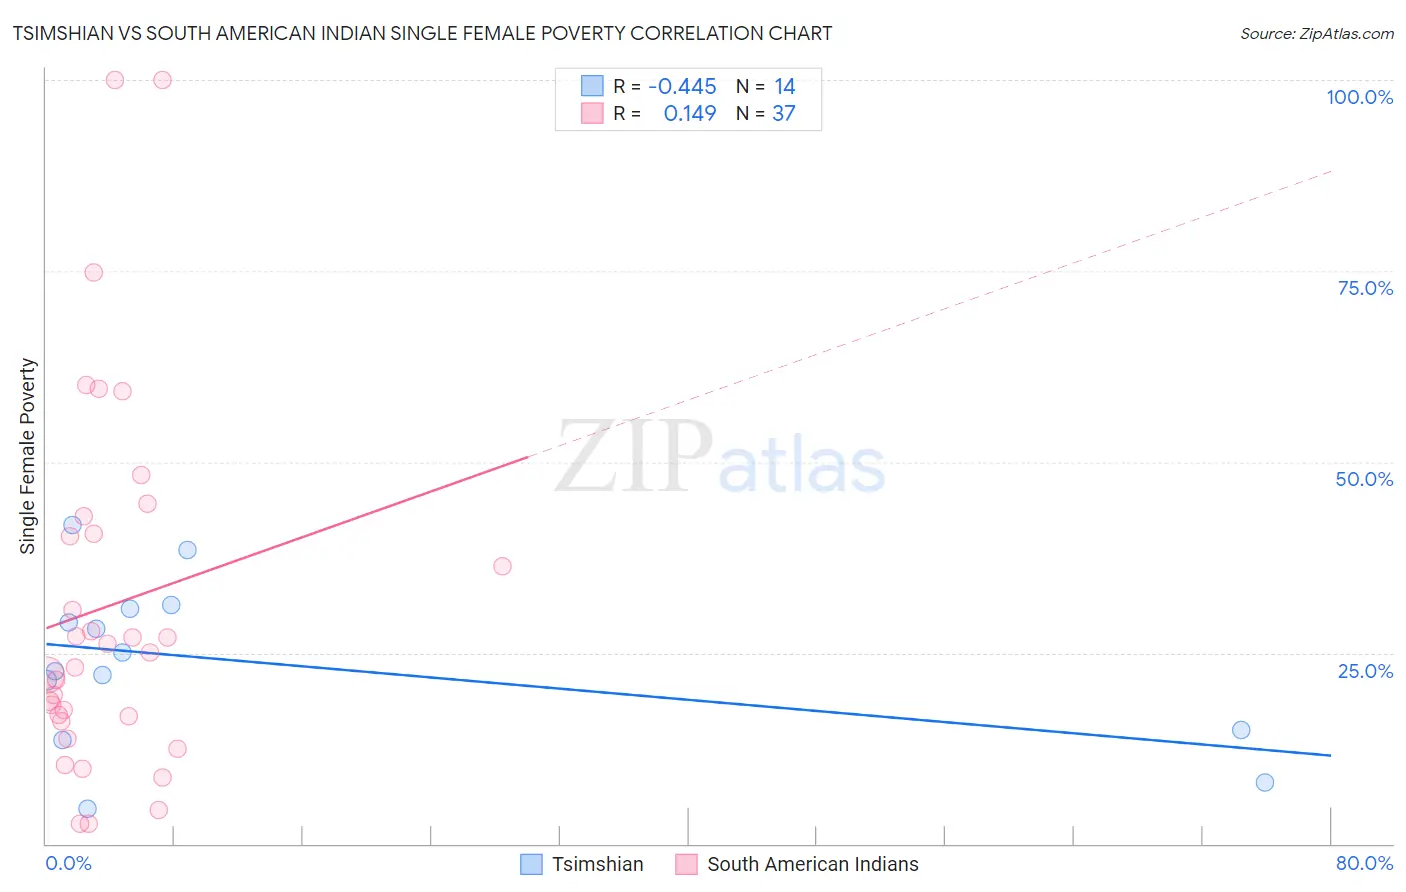
Tsimshian vs South American Indian Single Female Poverty Correlation Chart
The statistical analysis conducted on geographies consisting of 15,615,751 people shows a moderate negative correlation between the proportion of Tsimshian and poverty level among single females in the United States with a correlation coefficient (R) of -0.445 and weighted average of 19.1%. Similarly, the statistical analysis conducted on geographies consisting of 163,615,516 people shows a poor positive correlation between the proportion of South American Indians and poverty level among single females in the United States with a correlation coefficient (R) of 0.149 and weighted average of 20.6%, a difference of 8.1%.
Single Female Poverty Correlation Summary
| Measurement | Tsimshian | South American Indian |
| Minimum | 4.5% | 2.6% |
| Maximum | 41.7% | 100.0% |
| Range | 37.1% | 97.4% |
| Mean | 23.7% | 31.1% |
| Median | 23.8% | 25.0% |
| Interquartile 25% (IQ1) | 14.8% | 16.4% |
| Interquartile 75% (IQ3) | 30.8% | 41.7% |
| Interquartile Range (IQR) | 16.0% | 25.3% |
| Standard Deviation (Sample) | 10.7% | 24.0% |
| Standard Deviation (Population) | 10.4% | 23.6% |
Similar Demographics by Single Female Poverty
Demographics Similar to Tsimshian by Single Female Poverty
In terms of single female poverty, the demographic groups most similar to Tsimshian are Argentinean (19.1%, a difference of 0.010%), Immigrants from Vietnam (19.1%, a difference of 0.050%), Immigrants from Fiji (19.1%, a difference of 0.10%), Eastern European (19.1%, a difference of 0.16%), and Egyptian (19.1%, a difference of 0.21%).
| Demographics | Rating | Rank | Single Female Poverty |
| Macedonians | 99.8 /100 | #46 | Exceptional 18.9% |
| Latvians | 99.8 /100 | #47 | Exceptional 19.0% |
| Immigrants | Argentina | 99.8 /100 | #48 | Exceptional 19.0% |
| Immigrants | Czechoslovakia | 99.8 /100 | #49 | Exceptional 19.0% |
| Immigrants | Eastern Europe | 99.8 /100 | #50 | Exceptional 19.0% |
| Immigrants | Italy | 99.8 /100 | #51 | Exceptional 19.0% |
| Egyptians | 99.7 /100 | #52 | Exceptional 19.1% |
| Tsimshian | 99.7 /100 | #53 | Exceptional 19.1% |
| Argentineans | 99.7 /100 | #54 | Exceptional 19.1% |
| Immigrants | Vietnam | 99.7 /100 | #55 | Exceptional 19.1% |
| Immigrants | Fiji | 99.7 /100 | #56 | Exceptional 19.1% |
| Eastern Europeans | 99.7 /100 | #57 | Exceptional 19.1% |
| Immigrants | Bulgaria | 99.7 /100 | #58 | Exceptional 19.1% |
| Sri Lankans | 99.6 /100 | #59 | Exceptional 19.2% |
| Russians | 99.6 /100 | #60 | Exceptional 19.2% |
Demographics Similar to South American Indians by Single Female Poverty
In terms of single female poverty, the demographic groups most similar to South American Indians are Samoan (20.6%, a difference of 0.030%), Immigrants from Western Europe (20.6%, a difference of 0.10%), Immigrants from Oceania (20.7%, a difference of 0.12%), Swedish (20.6%, a difference of 0.13%), and Immigrants from Uruguay (20.6%, a difference of 0.18%).
| Demographics | Rating | Rank | Single Female Poverty |
| Portuguese | 81.5 /100 | #149 | Excellent 20.5% |
| Immigrants | Denmark | 80.5 /100 | #150 | Excellent 20.5% |
| Puget Sound Salish | 79.6 /100 | #151 | Good 20.6% |
| Immigrants | Uruguay | 77.7 /100 | #152 | Good 20.6% |
| Swedes | 77.1 /100 | #153 | Good 20.6% |
| Immigrants | Western Europe | 76.7 /100 | #154 | Good 20.6% |
| Samoans | 76.0 /100 | #155 | Good 20.6% |
| South American Indians | 75.7 /100 | #156 | Good 20.6% |
| Immigrants | Oceania | 74.3 /100 | #157 | Good 20.7% |
| Danes | 73.0 /100 | #158 | Good 20.7% |
| Costa Ricans | 71.8 /100 | #159 | Good 20.7% |
| Arabs | 70.8 /100 | #160 | Good 20.7% |
| Kenyans | 68.5 /100 | #161 | Good 20.8% |
| Northern Europeans | 68.4 /100 | #162 | Good 20.8% |
| Lebanese | 67.6 /100 | #163 | Good 20.8% |