Tsimshian vs Estonian Single Female Poverty

COMPARE

Tsimshian
Race
Ancestry
AfghanAfricanAlaska NativeAlaskan AthabascanAlbanianAleutAlsatianAmericanApacheArabArapahoArgentineanArmenianAssyrian/Chaldean/SyriacAustralianAustrianBahamianBangladeshiBarbadianBasqueBelgianBelizeanBermudanBhutaneseBlackfeetBolivianBrazilianBritishBritish West IndianBulgarianBurmeseCajunCambodianCanadianCape VerdeanCarpatho RusynCelticCentral AmericanCentral American IndianCherokeeCheyenneChickasawChileanChineseChippewaChoctawColombianColvilleComancheCosta RicanCreeCreekCroatianCrowCubanCypriotCzechCzechoslovakianDanishDelawareDominicanDutchDutch West IndianEastern EuropeanEcuadorianEgyptianEnglishEthiopianEuropeanFijianFilipinoFinnishFrenchFrench American IndianFrench CanadianGermanGerman RussianGhanaianGreekGuamanian/ChamorroGuatemalanGuyaneseHaitianHmongHonduranHopiHoumaHungarianIcelanderIndian (Asian)IndonesianInupiatIranianIraqiIrishIroquoisIsraeliItalianJamaicanJapaneseJordanianKenyanKiowaKoreanLaotianLatvianLebaneseLiberianLithuanianLumbeeLuxembourgerMacedonianMalaysianMalteseMarshalleseMenomineeMexicanMexican American IndianMongolianMoroccanNative HawaiianNavajoNepaleseNew ZealanderNicaraguanNigerianNorthern EuropeanNorwegianOkinawanOsageOttawaPaiutePakistaniPalestinianPanamanianParaguayanPennsylvania GermanPeruvianPimaPolishPortuguesePotawatomiPuebloPuerto RicanPuget Sound SalishRomanianRussianSalvadoranSamoanScandinavianScotch-IrishScottishSeminoleSenegaleseSerbianShoshoneSierra LeoneanSiouxSlavicSlovakSloveneSomaliSouth AfricanSouth AmericanSouth American IndianSoviet UnionSpaniardSpanishSpanish AmericanSpanish American IndianSri LankanSubsaharan AfricanSudaneseSwedishSwissSyrianTaiwaneseThaiTlingit-HaidaTohono O'OdhamTonganTrinidadian and TobagonianTsimshianTurkishU.S. Virgin IslanderUgandanUkrainianUruguayanUteVenezuelanVietnameseWelshWest IndianYakamaYaquiYugoslavianYumanYup'ikZimbabwean
Immigration
NonimmigrantsImmigrantsAfghanistanAfricaAlbaniaArgentinaArmeniaAsiaAustraliaAustriaBahamasBangladeshBarbadosBelarusBelgiumBelizeBoliviaBosnia and HerzegovinaBrazilBulgariaBurma/MyanmarCabo VerdeCambodiaCameroonCanadaCaribbeanCentral AmericaChileChinaColombiaCongoCosta RicaCroatiaCubaCzechoslovakiaDenmarkDominicaDominican RepublicEastern AfricaEastern AsiaEastern EuropeEcuadorEgyptEl SalvadorEnglandEritreaEthiopiaEuropeFijiFranceGermanyGhanaGreeceGrenadaGuatemalaGuyanaHaitiHondurasHong KongHungaryIndiaIndonesiaIranIraqIrelandIsraelItalyJamaicaJapanJordanKazakhstanKenyaKoreaKuwaitLaosLatin AmericaLatviaLebanonLiberiaLithuaniaMalaysiaMexicoMicronesiaMiddle AfricaMoldovaMoroccoNepalNetherlandsNicaraguaNigeriaNorth AmericaNorth MacedoniaNorthern AfricaNorthern EuropeNorwayOceaniaPakistanPanamaPeruPhilippinesPolandPortugalRomaniaRussiaSaudi ArabiaScotlandSenegalSerbiaSierra LeoneSingaporeSomaliaSouth AfricaSouth AmericaSouth Central AsiaSouth Eastern AsiaSouthern EuropeSpainSri LankaSt. Vincent and the GrenadinesSudanSwedenSwitzerlandSyriaTaiwanThailandTrinidad and TobagoTurkeyUgandaUkraineUruguayUzbekistanVenezuelaVietnamWest IndiesWestern AfricaWestern AsiaWestern EuropeYemenZaireZimbabweAzores
Estonian
Race
Ancestry
AfghanAfricanAlaska NativeAlaskan AthabascanAlbanianAleutAlsatianAmericanApacheArabArapahoArgentineanArmenianAssyrian/Chaldean/SyriacAustralianAustrianBahamianBangladeshiBarbadianBasqueBelgianBelizeanBermudanBhutaneseBlackfeetBolivianBrazilianBritishBritish West IndianBulgarianBurmeseCajunCambodianCanadianCape VerdeanCarpatho RusynCelticCentral AmericanCentral American IndianCherokeeCheyenneChickasawChileanChineseChippewaChoctawColombianColvilleComancheCosta RicanCreeCreekCroatianCrowCubanCypriotCzechCzechoslovakianDanishDelawareDominicanDutchDutch West IndianEastern EuropeanEcuadorianEgyptianEnglishEstonianEthiopianEuropeanFijianFilipinoFinnishFrenchFrench American IndianFrench CanadianGermanGerman RussianGhanaianGreekGuamanian/ChamorroGuatemalanGuyaneseHaitianHmongHonduranHopiHoumaHungarianIcelanderIndian (Asian)IndonesianInupiatIranianIraqiIrishIroquoisIsraeliItalianJamaicanJapaneseJordanianKenyanKiowaKoreanLaotianLatvianLebaneseLiberianLithuanianLumbeeLuxembourgerMacedonianMalaysianMalteseMarshalleseMenomineeMexicanMexican American IndianMongolianMoroccanNative HawaiianNavajoNepaleseNew ZealanderNicaraguanNigerianNorthern EuropeanNorwegianOkinawanOsageOttawaPaiutePakistaniPalestinianPanamanianParaguayanPennsylvania GermanPeruvianPimaPolishPortuguesePotawatomiPuebloPuerto RicanPuget Sound SalishRomanianRussianSalvadoranSamoanScandinavianScotch-IrishScottishSeminoleSenegaleseSerbianShoshoneSierra LeoneanSiouxSlavicSlovakSloveneSomaliSouth AfricanSouth AmericanSouth American IndianSoviet UnionSpaniardSpanishSpanish AmericanSpanish American IndianSri LankanSubsaharan AfricanSudaneseSwedishSwissSyrianTaiwaneseThaiTlingit-HaidaTohono O'OdhamTonganTrinidadian and TobagonianTurkishU.S. Virgin IslanderUgandanUkrainianUruguayanUteVenezuelanVietnameseWelshWest IndianYakamaYaquiYugoslavianYumanYup'ikZimbabwean
Immigration
NonimmigrantsImmigrantsAfghanistanAfricaAlbaniaArgentinaArmeniaAsiaAustraliaAustriaBahamasBangladeshBarbadosBelarusBelgiumBelizeBoliviaBosnia and HerzegovinaBrazilBulgariaBurma/MyanmarCabo VerdeCambodiaCameroonCanadaCaribbeanCentral AmericaChileChinaColombiaCongoCosta RicaCroatiaCubaCzechoslovakiaDenmarkDominicaDominican RepublicEastern AfricaEastern AsiaEastern EuropeEcuadorEgyptEl SalvadorEnglandEritreaEthiopiaEuropeFijiFranceGermanyGhanaGreeceGrenadaGuatemalaGuyanaHaitiHondurasHong KongHungaryIndiaIndonesiaIranIraqIrelandIsraelItalyJamaicaJapanJordanKazakhstanKenyaKoreaKuwaitLaosLatin AmericaLatviaLebanonLiberiaLithuaniaMalaysiaMexicoMicronesiaMiddle AfricaMoldovaMoroccoNepalNetherlandsNicaraguaNigeriaNorth AmericaNorth MacedoniaNorthern AfricaNorthern EuropeNorwayOceaniaPakistanPanamaPeruPhilippinesPolandPortugalRomaniaRussiaSaudi ArabiaScotlandSenegalSerbiaSierra LeoneSingaporeSomaliaSouth AfricaSouth AmericaSouth Central AsiaSouth Eastern AsiaSouthern EuropeSpainSri LankaSt. Vincent and the GrenadinesSudanSwedenSwitzerlandSyriaTaiwanThailandTrinidad and TobagoTurkeyUgandaUkraineUruguayUzbekistanVenezuelaVietnamWest IndiesWestern AfricaWestern AsiaWestern EuropeYemenZaireZimbabweAzores
Single Female Poverty
Income
Poverty
Unemployment
Labor Participation
Family Structure
Vehicle Availability
Education Level
Disability

Single Female Poverty Comparison

Tsimshian

Estonians

Exceptional
Exceptional
19.1%
SINGLE FEMALE POVERTY
99.7/ 100
METRIC RATING
53rd/ 347
METRIC RANK
19.7%
SINGLE FEMALE POVERTY
98.2/ 100
METRIC RATING
95th/ 347
METRIC RANK

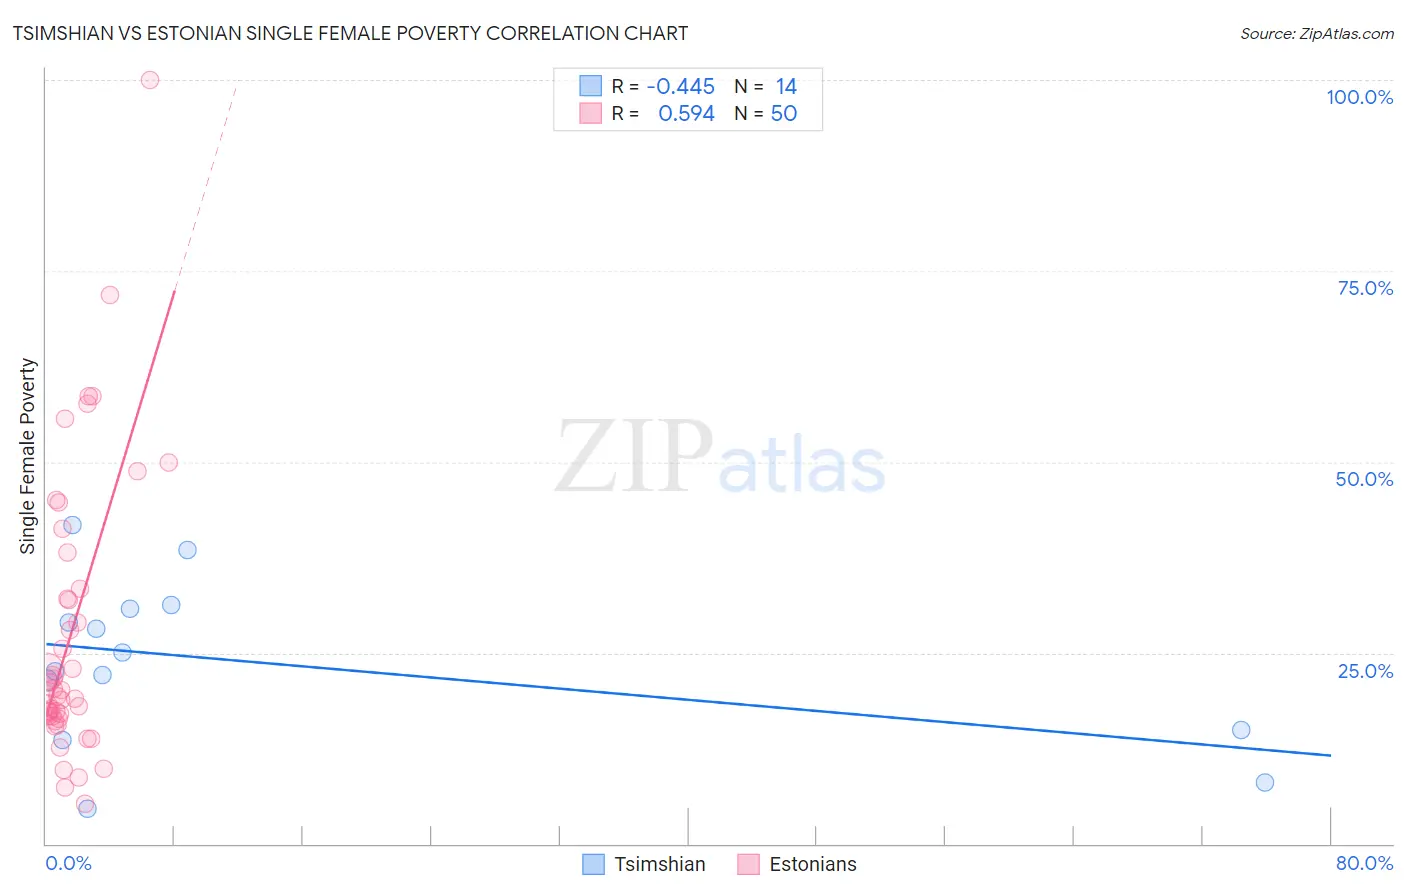
Tsimshian vs Estonian Single Female Poverty Correlation Chart

The statistical analysis conducted on geographies consisting of 15,615,751 people shows a moderate negative correlation between the proportion of Tsimshian and poverty level among single females in the United States with a correlation coefficient (R) of -0.445 and weighted average of 19.1%. Similarly, the statistical analysis conducted on geographies consisting of 122,383,678 people shows a substantial positive correlation between the proportion of Estonians and poverty level among single females in the United States with a correlation coefficient (R) of 0.594 and weighted average of 19.7%, a difference of 3.1%.
Tsimshian vs Estonian Single Female Poverty

Single Female Poverty Correlation Summary

MeasurementTsimshianEstonian
Minimum4.5%5.3%
Maximum41.7%100.0%
Range37.1%94.7%
Mean23.7%27.5%
Median23.8%19.7%
Interquartile 25% (IQ1)14.8%16.7%
Interquartile 75% (IQ3)30.8%33.3%
Interquartile Range (IQR)16.0%16.6%
Standard Deviation (Sample)10.7%18.8%
Standard Deviation (Population)10.4%18.6%

Similar Demographics by Single Female Poverty

Demographics Similar to Tsimshian by Single Female Poverty

In terms of single female poverty, the demographic groups most similar to Tsimshian are Argentinean (19.1%, a difference of 0.010%), Immigrants from Vietnam (19.1%, a difference of 0.050%), Immigrants from Fiji (19.1%, a difference of 0.10%), Eastern European (19.1%, a difference of 0.16%), and Egyptian (19.1%, a difference of 0.21%).
DemographicsRating | RankSingle Female Poverty
Macedonians
99.8
/100
|
#46
Exceptional
18.9%
Latvians
99.8
/100
|
#47
Exceptional
19.0%
Immigrants | Argentina
99.8
/100
|
#48
Exceptional
19.0%
Immigrants | Czechoslovakia
99.8
/100
|
#49
Exceptional
19.0%
Immigrants | Eastern Europe
99.8
/100
|
#50
Exceptional
19.0%
Immigrants | Italy
99.8
/100
|
#51
Exceptional
19.0%
Egyptians
99.7
/100
|
#52
Exceptional
19.1%
Tsimshian
99.7
/100
|
#53
Exceptional
19.1%
Argentineans
99.7
/100
|
#54
Exceptional
19.1%
Immigrants | Vietnam
99.7
/100
|
#55
Exceptional
19.1%
Immigrants | Fiji
99.7
/100
|
#56
Exceptional
19.1%
Eastern Europeans
99.7
/100
|
#57
Exceptional
19.1%
Immigrants | Bulgaria
99.7
/100
|
#58
Exceptional
19.1%
Sri Lankans
99.6
/100
|
#59
Exceptional
19.2%
Russians
99.6
/100
|
#60
Exceptional
19.2%

Demographics Similar to Estonians by Single Female Poverty

In terms of single female poverty, the demographic groups most similar to Estonians are Immigrants from Brazil (19.7%, a difference of 0.050%), Croatian (19.7%, a difference of 0.14%), Immigrants from France (19.7%, a difference of 0.26%), Sierra Leonean (19.7%, a difference of 0.28%), and Romanian (19.6%, a difference of 0.38%).
DemographicsRating | RankSingle Female Poverty
Afghans
99.0
/100
|
#88
Exceptional
19.5%
Immigrants | Ukraine
99.0
/100
|
#89
Exceptional
19.5%
Immigrants | Lebanon
98.8
/100
|
#90
Exceptional
19.6%
Soviet Union
98.8
/100
|
#91
Exceptional
19.6%
Italians
98.8
/100
|
#92
Exceptional
19.6%
Immigrants | Austria
98.8
/100
|
#93
Exceptional
19.6%
Romanians
98.6
/100
|
#94
Exceptional
19.6%
Estonians
98.2
/100
|
#95
Exceptional
19.7%
Immigrants | Brazil
98.2
/100
|
#96
Exceptional
19.7%
Croatians
98.1
/100
|
#97
Exceptional
19.7%
Immigrants | France
97.9
/100
|
#98
Exceptional
19.7%
Sierra Leoneans
97.9
/100
|
#99
Exceptional
19.7%
Ukrainians
97.6
/100
|
#100
Exceptional
19.8%
Immigrants | Belgium
97.3
/100
|
#101
Exceptional
19.8%
Immigrants | Cameroon
97.3
/100
|
#102
Exceptional
19.8%