Tsimshian vs Immigrants from Sierra Leone Single Female Poverty
COMPARE
Tsimshian
Immigrants from Sierra Leone
Single Female Poverty
Single Female Poverty Comparison
Tsimshian
Immigrants from Sierra Leone
19.1%
SINGLE FEMALE POVERTY
99.7/ 100
METRIC RATING
53rd/ 347
METRIC RANK
19.4%
SINGLE FEMALE POVERTY
99.3/ 100
METRIC RATING
79th/ 347
METRIC RANK
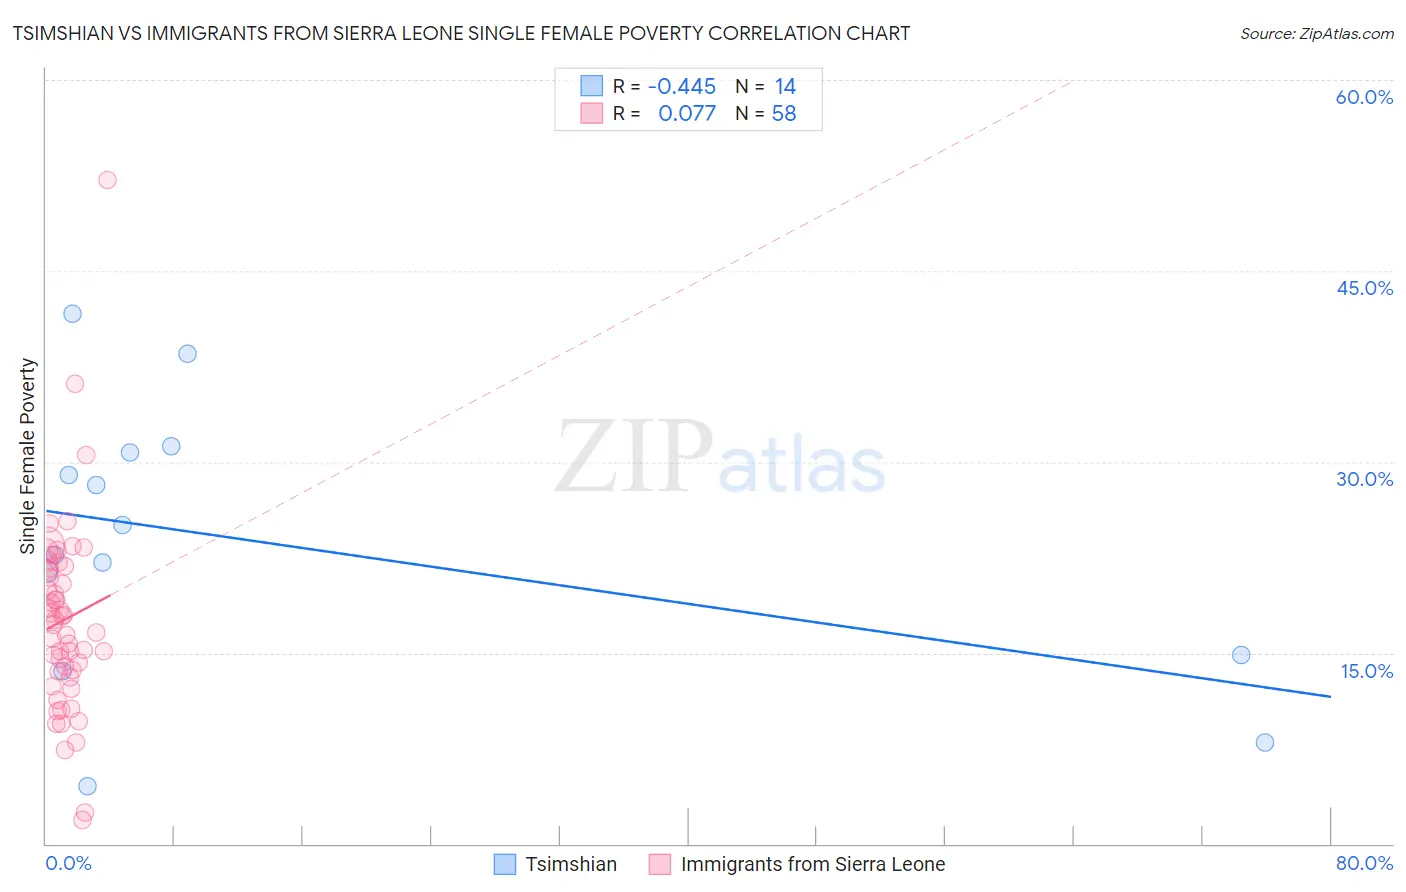
Tsimshian vs Immigrants from Sierra Leone Single Female Poverty Correlation Chart
The statistical analysis conducted on geographies consisting of 15,615,751 people shows a moderate negative correlation between the proportion of Tsimshian and poverty level among single females in the United States with a correlation coefficient (R) of -0.445 and weighted average of 19.1%. Similarly, the statistical analysis conducted on geographies consisting of 101,303,700 people shows a slight positive correlation between the proportion of Immigrants from Sierra Leone and poverty level among single females in the United States with a correlation coefficient (R) of 0.077 and weighted average of 19.4%, a difference of 1.6%.
Single Female Poverty Correlation Summary
| Measurement | Tsimshian | Immigrants from Sierra Leone |
| Minimum | 4.5% | 1.9% |
| Maximum | 41.7% | 52.1% |
| Range | 37.1% | 50.2% |
| Mean | 23.7% | 17.6% |
| Median | 23.8% | 17.4% |
| Interquartile 25% (IQ1) | 14.8% | 13.6% |
| Interquartile 75% (IQ3) | 30.8% | 21.7% |
| Interquartile Range (IQR) | 16.0% | 8.1% |
| Standard Deviation (Sample) | 10.7% | 7.7% |
| Standard Deviation (Population) | 10.4% | 7.6% |
Similar Demographics by Single Female Poverty
Demographics Similar to Tsimshian by Single Female Poverty
In terms of single female poverty, the demographic groups most similar to Tsimshian are Argentinean (19.1%, a difference of 0.010%), Immigrants from Vietnam (19.1%, a difference of 0.050%), Immigrants from Fiji (19.1%, a difference of 0.10%), Eastern European (19.1%, a difference of 0.16%), and Egyptian (19.1%, a difference of 0.21%).
| Demographics | Rating | Rank | Single Female Poverty |
| Macedonians | 99.8 /100 | #46 | Exceptional 18.9% |
| Latvians | 99.8 /100 | #47 | Exceptional 19.0% |
| Immigrants | Argentina | 99.8 /100 | #48 | Exceptional 19.0% |
| Immigrants | Czechoslovakia | 99.8 /100 | #49 | Exceptional 19.0% |
| Immigrants | Eastern Europe | 99.8 /100 | #50 | Exceptional 19.0% |
| Immigrants | Italy | 99.8 /100 | #51 | Exceptional 19.0% |
| Egyptians | 99.7 /100 | #52 | Exceptional 19.1% |
| Tsimshian | 99.7 /100 | #53 | Exceptional 19.1% |
| Argentineans | 99.7 /100 | #54 | Exceptional 19.1% |
| Immigrants | Vietnam | 99.7 /100 | #55 | Exceptional 19.1% |
| Immigrants | Fiji | 99.7 /100 | #56 | Exceptional 19.1% |
| Eastern Europeans | 99.7 /100 | #57 | Exceptional 19.1% |
| Immigrants | Bulgaria | 99.7 /100 | #58 | Exceptional 19.1% |
| Sri Lankans | 99.6 /100 | #59 | Exceptional 19.2% |
| Russians | 99.6 /100 | #60 | Exceptional 19.2% |
Demographics Similar to Immigrants from Sierra Leone by Single Female Poverty
In terms of single female poverty, the demographic groups most similar to Immigrants from Sierra Leone are Albanian (19.4%, a difference of 0.020%), Immigrants from Australia (19.4%, a difference of 0.040%), Immigrants from Scotland (19.4%, a difference of 0.060%), Immigrants from Malaysia (19.4%, a difference of 0.070%), and Taiwanese (19.4%, a difference of 0.080%).
| Demographics | Rating | Rank | Single Female Poverty |
| Immigrants | Latvia | 99.4 /100 | #72 | Exceptional 19.3% |
| Immigrants | Peru | 99.4 /100 | #73 | Exceptional 19.3% |
| Immigrants | Belarus | 99.4 /100 | #74 | Exceptional 19.3% |
| Immigrants | Turkey | 99.4 /100 | #75 | Exceptional 19.4% |
| Peruvians | 99.4 /100 | #76 | Exceptional 19.4% |
| Immigrants | Russia | 99.3 /100 | #77 | Exceptional 19.4% |
| Albanians | 99.3 /100 | #78 | Exceptional 19.4% |
| Immigrants | Sierra Leone | 99.3 /100 | #79 | Exceptional 19.4% |
| Immigrants | Australia | 99.3 /100 | #80 | Exceptional 19.4% |
| Immigrants | Scotland | 99.2 /100 | #81 | Exceptional 19.4% |
| Immigrants | Malaysia | 99.2 /100 | #82 | Exceptional 19.4% |
| Taiwanese | 99.2 /100 | #83 | Exceptional 19.4% |
| Immigrants | Sweden | 99.2 /100 | #84 | Exceptional 19.4% |
| Immigrants | Albania | 99.2 /100 | #85 | Exceptional 19.4% |
| Greeks | 99.2 /100 | #86 | Exceptional 19.4% |