Tsimshian vs European Single Female Poverty
COMPARE
Tsimshian
European
Single Female Poverty
Single Female Poverty Comparison
Tsimshian
Europeans
19.1%
SINGLE FEMALE POVERTY
99.7/ 100
METRIC RATING
53rd/ 347
METRIC RANK
21.1%
SINGLE FEMALE POVERTY
42.3/ 100
METRIC RATING
181st/ 347
METRIC RANK
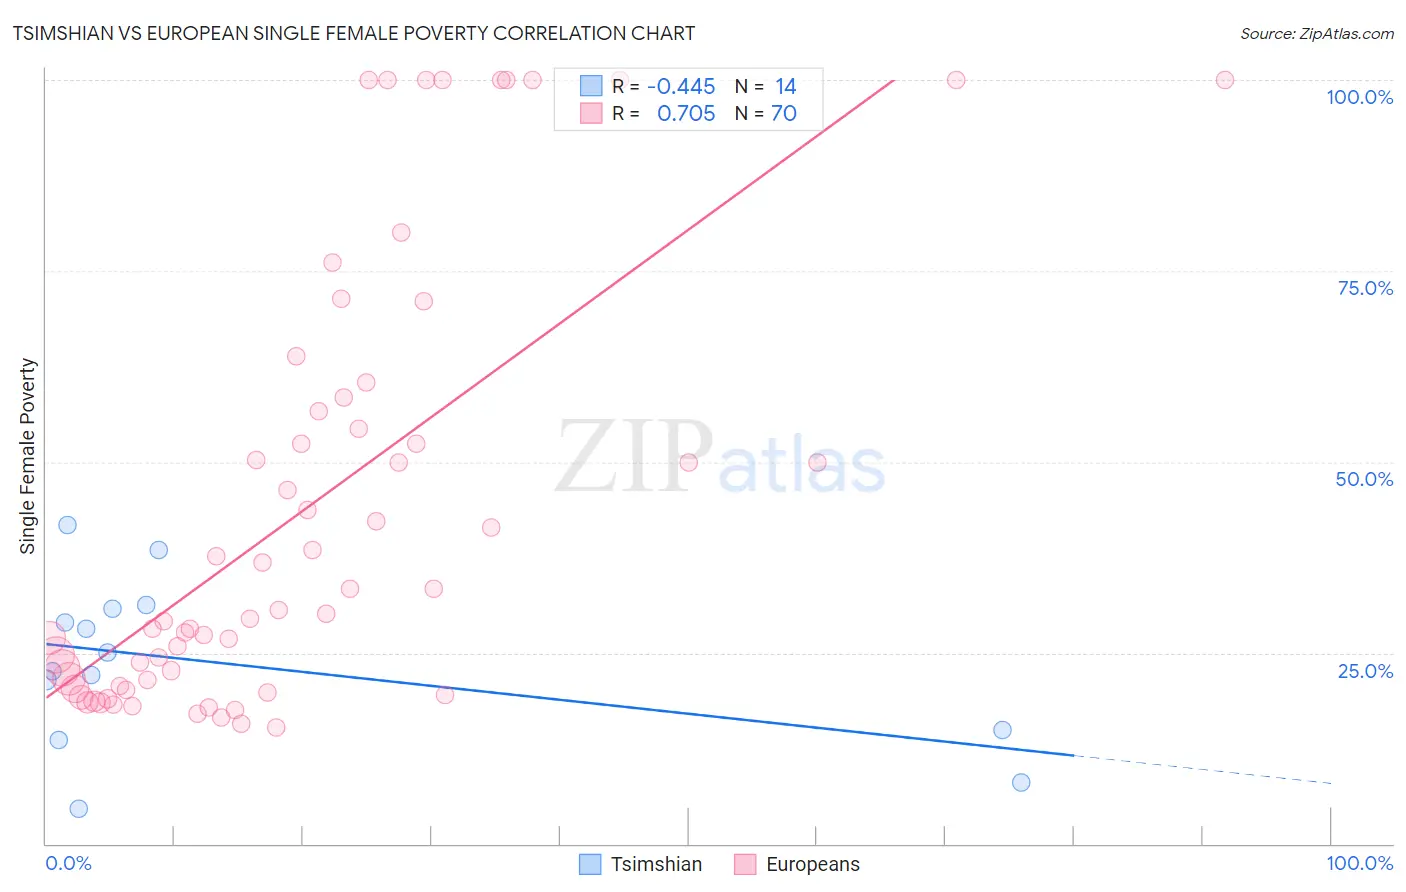
Tsimshian vs European Single Female Poverty Correlation Chart
The statistical analysis conducted on geographies consisting of 15,615,751 people shows a moderate negative correlation between the proportion of Tsimshian and poverty level among single females in the United States with a correlation coefficient (R) of -0.445 and weighted average of 19.1%. Similarly, the statistical analysis conducted on geographies consisting of 543,036,354 people shows a strong positive correlation between the proportion of Europeans and poverty level among single females in the United States with a correlation coefficient (R) of 0.705 and weighted average of 21.1%, a difference of 10.5%.
Single Female Poverty Correlation Summary
| Measurement | Tsimshian | European |
| Minimum | 4.5% | 15.3% |
| Maximum | 41.7% | 100.0% |
| Range | 37.1% | 84.7% |
| Mean | 23.7% | 43.6% |
| Median | 23.8% | 30.4% |
| Interquartile 25% (IQ1) | 14.8% | 20.6% |
| Interquartile 75% (IQ3) | 30.8% | 56.6% |
| Interquartile Range (IQR) | 16.0% | 36.0% |
| Standard Deviation (Sample) | 10.7% | 28.1% |
| Standard Deviation (Population) | 10.4% | 27.9% |
Similar Demographics by Single Female Poverty
Demographics Similar to Tsimshian by Single Female Poverty
In terms of single female poverty, the demographic groups most similar to Tsimshian are Argentinean (19.1%, a difference of 0.010%), Immigrants from Vietnam (19.1%, a difference of 0.050%), Immigrants from Fiji (19.1%, a difference of 0.10%), Eastern European (19.1%, a difference of 0.16%), and Egyptian (19.1%, a difference of 0.21%).
| Demographics | Rating | Rank | Single Female Poverty |
| Macedonians | 99.8 /100 | #46 | Exceptional 18.9% |
| Latvians | 99.8 /100 | #47 | Exceptional 19.0% |
| Immigrants | Argentina | 99.8 /100 | #48 | Exceptional 19.0% |
| Immigrants | Czechoslovakia | 99.8 /100 | #49 | Exceptional 19.0% |
| Immigrants | Eastern Europe | 99.8 /100 | #50 | Exceptional 19.0% |
| Immigrants | Italy | 99.8 /100 | #51 | Exceptional 19.0% |
| Egyptians | 99.7 /100 | #52 | Exceptional 19.1% |
| Tsimshian | 99.7 /100 | #53 | Exceptional 19.1% |
| Argentineans | 99.7 /100 | #54 | Exceptional 19.1% |
| Immigrants | Vietnam | 99.7 /100 | #55 | Exceptional 19.1% |
| Immigrants | Fiji | 99.7 /100 | #56 | Exceptional 19.1% |
| Eastern Europeans | 99.7 /100 | #57 | Exceptional 19.1% |
| Immigrants | Bulgaria | 99.7 /100 | #58 | Exceptional 19.1% |
| Sri Lankans | 99.6 /100 | #59 | Exceptional 19.2% |
| Russians | 99.6 /100 | #60 | Exceptional 19.2% |
Demographics Similar to Europeans by Single Female Poverty
In terms of single female poverty, the demographic groups most similar to Europeans are Spanish American Indian (21.1%, a difference of 0.010%), British (21.1%, a difference of 0.040%), Slavic (21.1%, a difference of 0.12%), Immigrants from Bosnia and Herzegovina (21.1%, a difference of 0.16%), and Slovak (21.1%, a difference of 0.17%).
| Demographics | Rating | Rank | Single Female Poverty |
| Cubans | 50.0 /100 | #174 | Average 21.0% |
| Czechs | 46.8 /100 | #175 | Average 21.0% |
| Canadians | 45.4 /100 | #176 | Average 21.1% |
| Scandinavians | 45.2 /100 | #177 | Average 21.1% |
| Immigrants | Bosnia and Herzegovina | 44.9 /100 | #178 | Average 21.1% |
| British | 42.9 /100 | #179 | Average 21.1% |
| Spanish American Indians | 42.5 /100 | #180 | Average 21.1% |
| Europeans | 42.3 /100 | #181 | Average 21.1% |
| Slavs | 40.5 /100 | #182 | Average 21.1% |
| Slovaks | 39.7 /100 | #183 | Fair 21.1% |
| Hungarians | 39.6 /100 | #184 | Fair 21.1% |
| Immigrants | Cambodia | 38.2 /100 | #185 | Fair 21.2% |
| Hawaiians | 37.7 /100 | #186 | Fair 21.2% |
| Immigrants | Nigeria | 36.8 /100 | #187 | Fair 21.2% |
| Yugoslavians | 35.4 /100 | #188 | Fair 21.2% |