Tsimshian vs South American Indian 6th Grade
COMPARE
Tsimshian
South American Indian
6th Grade
6th Grade Comparison
Tsimshian
South American Indians
98.3%
6TH GRADE
100.0/ 100
METRIC RATING
5th/ 347
METRIC RANK
96.7%
6TH GRADE
3.5/ 100
METRIC RATING
232nd/ 347
METRIC RANK
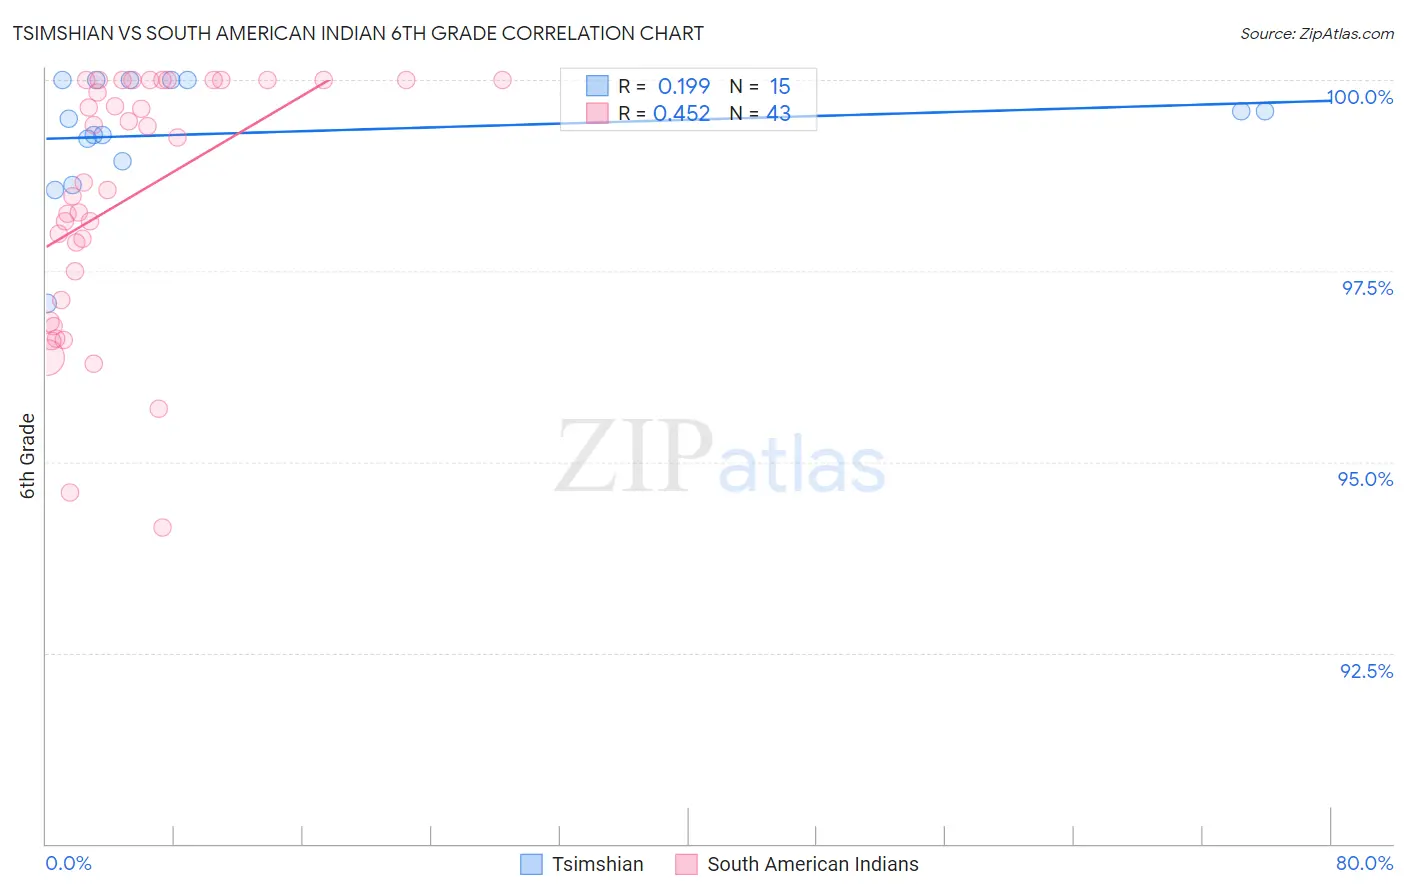
Tsimshian vs South American Indian 6th Grade Correlation Chart
The statistical analysis conducted on geographies consisting of 15,626,544 people shows a poor positive correlation between the proportion of Tsimshian and percentage of population with at least 6th grade education in the United States with a correlation coefficient (R) of 0.199 and weighted average of 98.3%. Similarly, the statistical analysis conducted on geographies consisting of 164,573,401 people shows a moderate positive correlation between the proportion of South American Indians and percentage of population with at least 6th grade education in the United States with a correlation coefficient (R) of 0.452 and weighted average of 96.7%, a difference of 1.7%.
6th Grade Correlation Summary
| Measurement | Tsimshian | South American Indian |
| Minimum | 97.1% | 94.1% |
| Maximum | 100.0% | 100.0% |
| Range | 2.9% | 5.9% |
| Mean | 99.3% | 98.5% |
| Median | 99.5% | 98.7% |
| Interquartile 25% (IQ1) | 98.9% | 97.1% |
| Interquartile 75% (IQ3) | 100.0% | 100.0% |
| Interquartile Range (IQR) | 1.1% | 2.9% |
| Standard Deviation (Sample) | 0.79% | 1.6% |
| Standard Deviation (Population) | 0.76% | 1.6% |
Similar Demographics by 6th Grade
Demographics Similar to Tsimshian by 6th Grade
In terms of 6th grade, the demographic groups most similar to Tsimshian are Norwegian (98.3%, a difference of 0.0%), German (98.2%, a difference of 0.040%), Slovak (98.2%, a difference of 0.050%), Dutch (98.4%, a difference of 0.070%), and Slovene (98.2%, a difference of 0.10%).
| Demographics | Rating | Rank | 6th Grade |
| Crow | 100.0 /100 | #1 | Exceptional 99.4% |
| Ottawa | 100.0 /100 | #2 | Exceptional 98.5% |
| Welsh | 100.0 /100 | #3 | Exceptional 98.5% |
| Dutch | 100.0 /100 | #4 | Exceptional 98.4% |
| Tsimshian | 100.0 /100 | #5 | Exceptional 98.3% |
| Norwegians | 100.0 /100 | #6 | Exceptional 98.3% |
| Germans | 100.0 /100 | #7 | Exceptional 98.2% |
| Slovaks | 100.0 /100 | #8 | Exceptional 98.2% |
| Slovenes | 100.0 /100 | #9 | Exceptional 98.2% |
| Swedes | 100.0 /100 | #10 | Exceptional 98.2% |
| English | 100.0 /100 | #11 | Exceptional 98.1% |
| Alaskan Athabascans | 100.0 /100 | #12 | Exceptional 98.1% |
| Tlingit-Haida | 100.0 /100 | #13 | Exceptional 98.1% |
| Carpatho Rusyns | 100.0 /100 | #14 | Exceptional 98.1% |
| Inupiat | 100.0 /100 | #15 | Exceptional 98.1% |
Demographics Similar to South American Indians by 6th Grade
In terms of 6th grade, the demographic groups most similar to South American Indians are Subsaharan African (96.7%, a difference of 0.0%), Yuman (96.7%, a difference of 0.010%), Immigrants from Panama (96.7%, a difference of 0.020%), Immigrants from Western Asia (96.7%, a difference of 0.020%), and Immigrants from Malaysia (96.7%, a difference of 0.020%).
| Demographics | Rating | Rank | 6th Grade |
| Immigrants | Pakistan | 4.4 /100 | #225 | Tragic 96.7% |
| Immigrants | Panama | 4.2 /100 | #226 | Tragic 96.7% |
| Immigrants | Western Asia | 4.1 /100 | #227 | Tragic 96.7% |
| Immigrants | Malaysia | 4.0 /100 | #228 | Tragic 96.7% |
| Assyrians/Chaldeans/Syriacs | 4.0 /100 | #229 | Tragic 96.7% |
| Immigrants | Eastern Asia | 4.0 /100 | #230 | Tragic 96.7% |
| Sub-Saharan Africans | 3.5 /100 | #231 | Tragic 96.7% |
| South American Indians | 3.5 /100 | #232 | Tragic 96.7% |
| Yuman | 3.2 /100 | #233 | Tragic 96.7% |
| Uruguayans | 2.5 /100 | #234 | Tragic 96.6% |
| Asians | 2.4 /100 | #235 | Tragic 96.6% |
| Immigrants | Indonesia | 2.3 /100 | #236 | Tragic 96.6% |
| Immigrants | Eastern Africa | 2.0 /100 | #237 | Tragic 96.6% |
| Nigerians | 1.9 /100 | #238 | Tragic 96.6% |
| Indians (Asian) | 1.9 /100 | #239 | Tragic 96.6% |