Tsimshian vs Kiowa Single Female Poverty
COMPARE
Tsimshian
Kiowa
Single Female Poverty
Single Female Poverty Comparison
Tsimshian
Kiowa
19.1%
SINGLE FEMALE POVERTY
99.7/ 100
METRIC RATING
53rd/ 347
METRIC RANK
26.9%
SINGLE FEMALE POVERTY
0.0/ 100
METRIC RATING
324th/ 347
METRIC RANK
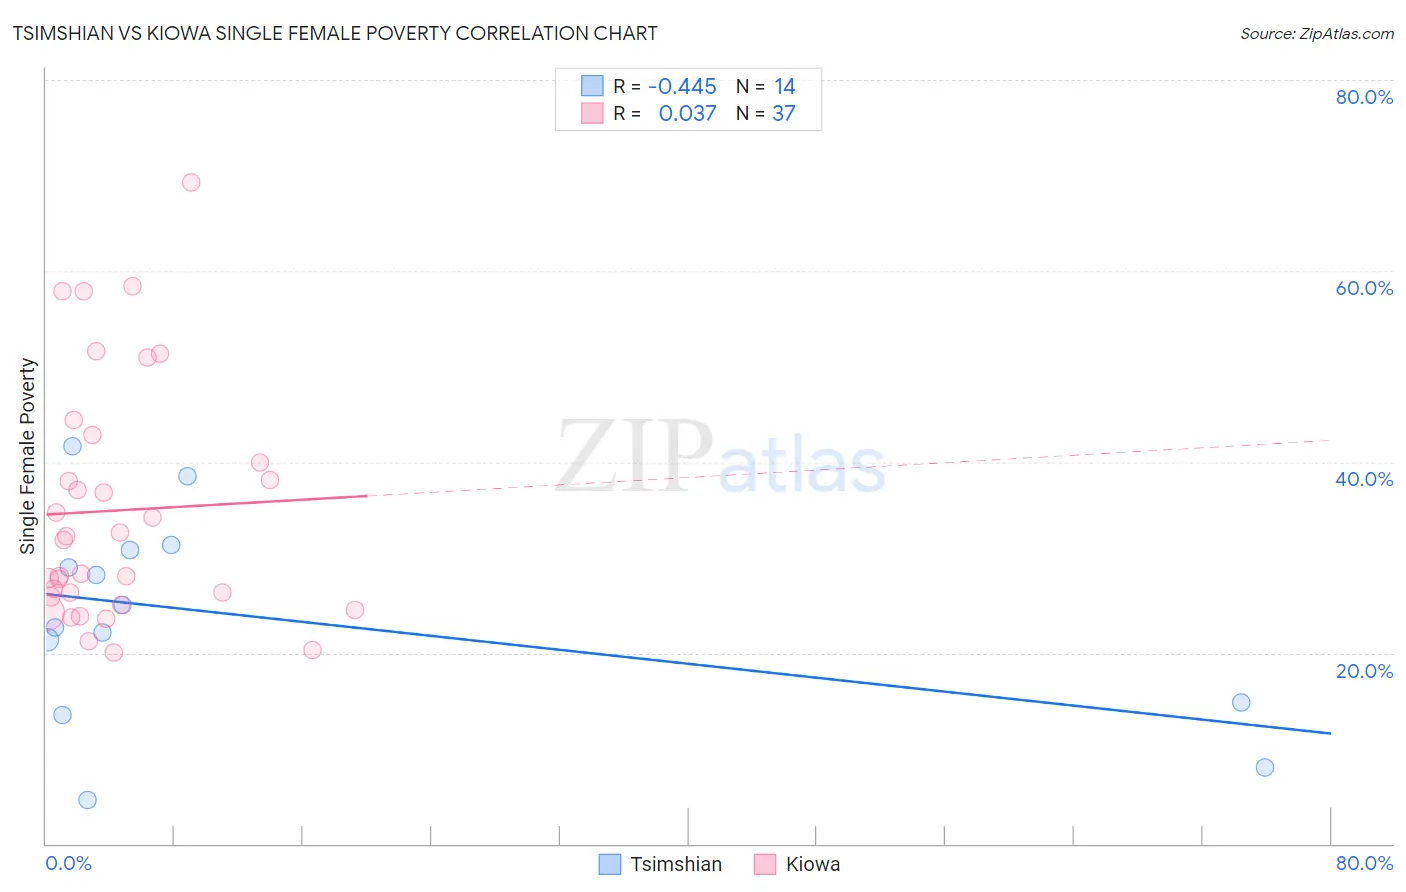
Tsimshian vs Kiowa Single Female Poverty Correlation Chart
The statistical analysis conducted on geographies consisting of 15,615,751 people shows a moderate negative correlation between the proportion of Tsimshian and poverty level among single females in the United States with a correlation coefficient (R) of -0.445 and weighted average of 19.1%. Similarly, the statistical analysis conducted on geographies consisting of 55,984,677 people shows no correlation between the proportion of Kiowa and poverty level among single females in the United States with a correlation coefficient (R) of 0.037 and weighted average of 26.9%, a difference of 41.0%.
Single Female Poverty Correlation Summary
| Measurement | Tsimshian | Kiowa |
| Minimum | 4.5% | 20.0% |
| Maximum | 41.7% | 69.2% |
| Range | 37.1% | 49.2% |
| Mean | 23.7% | 34.9% |
| Median | 23.8% | 31.9% |
| Interquartile 25% (IQ1) | 14.8% | 25.4% |
| Interquartile 75% (IQ3) | 30.8% | 41.4% |
| Interquartile Range (IQR) | 16.0% | 16.0% |
| Standard Deviation (Sample) | 10.7% | 12.6% |
| Standard Deviation (Population) | 10.4% | 12.4% |
Similar Demographics by Single Female Poverty
Demographics Similar to Tsimshian by Single Female Poverty
In terms of single female poverty, the demographic groups most similar to Tsimshian are Argentinean (19.1%, a difference of 0.010%), Immigrants from Vietnam (19.1%, a difference of 0.050%), Immigrants from Fiji (19.1%, a difference of 0.10%), Eastern European (19.1%, a difference of 0.16%), and Egyptian (19.1%, a difference of 0.21%).
| Demographics | Rating | Rank | Single Female Poverty |
| Macedonians | 99.8 /100 | #46 | Exceptional 18.9% |
| Latvians | 99.8 /100 | #47 | Exceptional 19.0% |
| Immigrants | Argentina | 99.8 /100 | #48 | Exceptional 19.0% |
| Immigrants | Czechoslovakia | 99.8 /100 | #49 | Exceptional 19.0% |
| Immigrants | Eastern Europe | 99.8 /100 | #50 | Exceptional 19.0% |
| Immigrants | Italy | 99.8 /100 | #51 | Exceptional 19.0% |
| Egyptians | 99.7 /100 | #52 | Exceptional 19.1% |
| Tsimshian | 99.7 /100 | #53 | Exceptional 19.1% |
| Argentineans | 99.7 /100 | #54 | Exceptional 19.1% |
| Immigrants | Vietnam | 99.7 /100 | #55 | Exceptional 19.1% |
| Immigrants | Fiji | 99.7 /100 | #56 | Exceptional 19.1% |
| Eastern Europeans | 99.7 /100 | #57 | Exceptional 19.1% |
| Immigrants | Bulgaria | 99.7 /100 | #58 | Exceptional 19.1% |
| Sri Lankans | 99.6 /100 | #59 | Exceptional 19.2% |
| Russians | 99.6 /100 | #60 | Exceptional 19.2% |
Demographics Similar to Kiowa by Single Female Poverty
In terms of single female poverty, the demographic groups most similar to Kiowa are Chippewa (26.8%, a difference of 0.41%), Seminole (26.8%, a difference of 0.52%), Choctaw (27.2%, a difference of 0.98%), Yup'ik (26.6%, a difference of 1.3%), and Creek (27.4%, a difference of 1.9%).
| Demographics | Rating | Rank | Single Female Poverty |
| Ottawa | 0.0 /100 | #317 | Tragic 26.0% |
| Chickasaw | 0.0 /100 | #318 | Tragic 26.3% |
| Blacks/African Americans | 0.0 /100 | #319 | Tragic 26.4% |
| Arapaho | 0.0 /100 | #320 | Tragic 26.4% |
| Yup'ik | 0.0 /100 | #321 | Tragic 26.6% |
| Seminole | 0.0 /100 | #322 | Tragic 26.8% |
| Chippewa | 0.0 /100 | #323 | Tragic 26.8% |
| Kiowa | 0.0 /100 | #324 | Tragic 26.9% |
| Choctaw | 0.0 /100 | #325 | Tragic 27.2% |
| Creek | 0.0 /100 | #326 | Tragic 27.4% |
| Dutch West Indians | 0.0 /100 | #327 | Tragic 27.5% |
| Apache | 0.0 /100 | #328 | Tragic 27.7% |
| Menominee | 0.0 /100 | #329 | Tragic 27.8% |
| Hopi | 0.0 /100 | #330 | Tragic 28.0% |
| Natives/Alaskans | 0.0 /100 | #331 | Tragic 28.2% |