Tsimshian vs White/Caucasian Single Female Poverty
COMPARE
Tsimshian
White/Caucasian
Single Female Poverty
Single Female Poverty Comparison
Tsimshian
Whites/Caucasians
19.1%
SINGLE FEMALE POVERTY
99.7/ 100
METRIC RATING
53rd/ 347
METRIC RANK
22.7%
SINGLE FEMALE POVERTY
0.6/ 100
METRIC RATING
259th/ 347
METRIC RANK
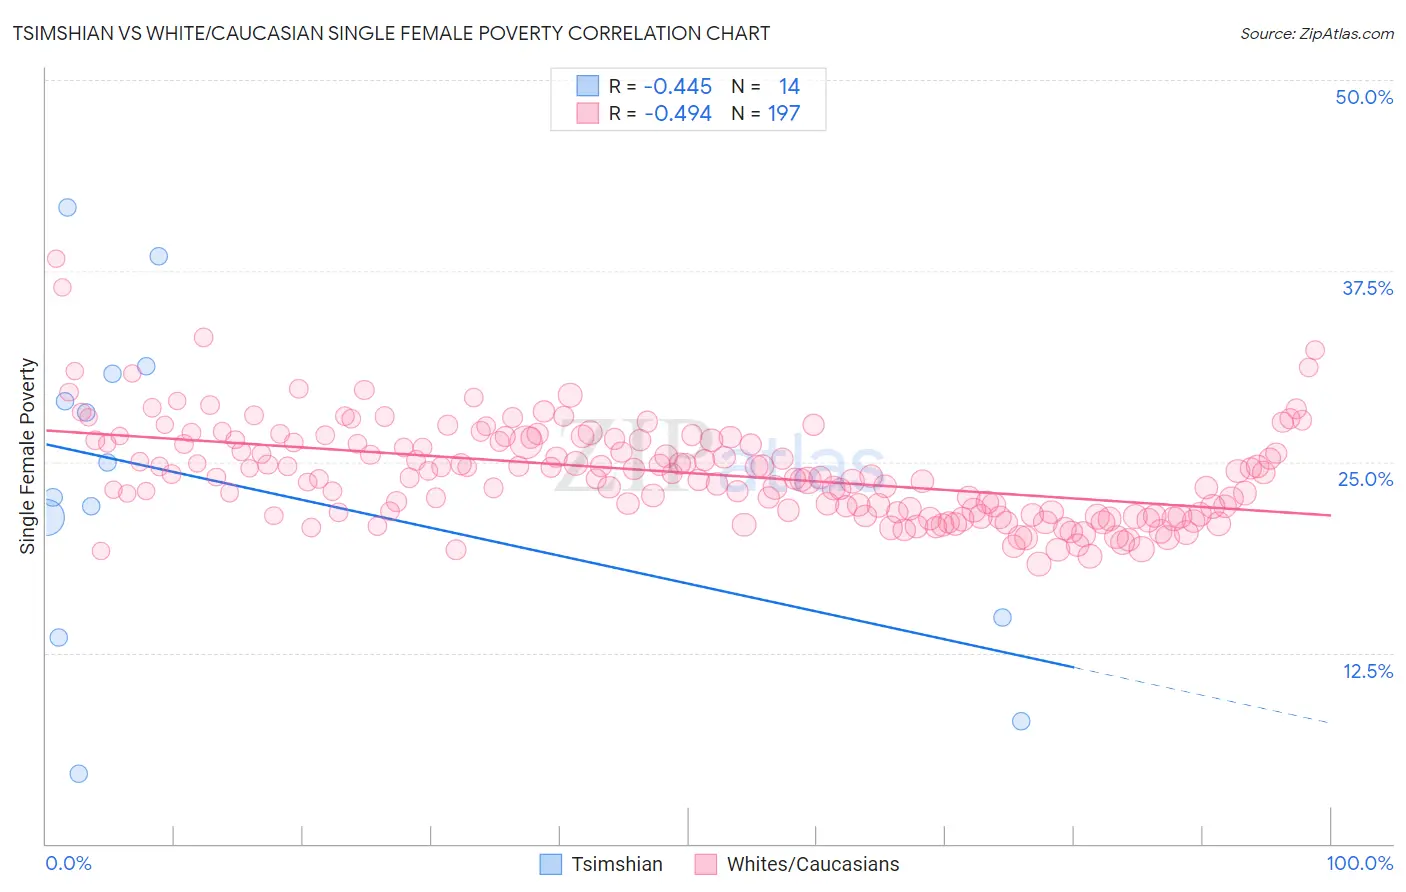
Tsimshian vs White/Caucasian Single Female Poverty Correlation Chart
The statistical analysis conducted on geographies consisting of 15,615,751 people shows a moderate negative correlation between the proportion of Tsimshian and poverty level among single females in the United States with a correlation coefficient (R) of -0.445 and weighted average of 19.1%. Similarly, the statistical analysis conducted on geographies consisting of 560,395,051 people shows a moderate negative correlation between the proportion of Whites/Caucasians and poverty level among single females in the United States with a correlation coefficient (R) of -0.494 and weighted average of 22.7%, a difference of 18.9%.
Single Female Poverty Correlation Summary
| Measurement | Tsimshian | White/Caucasian |
| Minimum | 4.5% | 18.3% |
| Maximum | 41.7% | 38.3% |
| Range | 37.1% | 20.0% |
| Mean | 23.7% | 24.3% |
| Median | 23.8% | 24.0% |
| Interquartile 25% (IQ1) | 14.8% | 21.6% |
| Interquartile 75% (IQ3) | 30.8% | 26.4% |
| Interquartile Range (IQR) | 16.0% | 4.8% |
| Standard Deviation (Sample) | 10.7% | 3.2% |
| Standard Deviation (Population) | 10.4% | 3.2% |
Similar Demographics by Single Female Poverty
Demographics Similar to Tsimshian by Single Female Poverty
In terms of single female poverty, the demographic groups most similar to Tsimshian are Argentinean (19.1%, a difference of 0.010%), Immigrants from Vietnam (19.1%, a difference of 0.050%), Immigrants from Fiji (19.1%, a difference of 0.10%), Eastern European (19.1%, a difference of 0.16%), and Egyptian (19.1%, a difference of 0.21%).
| Demographics | Rating | Rank | Single Female Poverty |
| Macedonians | 99.8 /100 | #46 | Exceptional 18.9% |
| Latvians | 99.8 /100 | #47 | Exceptional 19.0% |
| Immigrants | Argentina | 99.8 /100 | #48 | Exceptional 19.0% |
| Immigrants | Czechoslovakia | 99.8 /100 | #49 | Exceptional 19.0% |
| Immigrants | Eastern Europe | 99.8 /100 | #50 | Exceptional 19.0% |
| Immigrants | Italy | 99.8 /100 | #51 | Exceptional 19.0% |
| Egyptians | 99.7 /100 | #52 | Exceptional 19.1% |
| Tsimshian | 99.7 /100 | #53 | Exceptional 19.1% |
| Argentineans | 99.7 /100 | #54 | Exceptional 19.1% |
| Immigrants | Vietnam | 99.7 /100 | #55 | Exceptional 19.1% |
| Immigrants | Fiji | 99.7 /100 | #56 | Exceptional 19.1% |
| Eastern Europeans | 99.7 /100 | #57 | Exceptional 19.1% |
| Immigrants | Bulgaria | 99.7 /100 | #58 | Exceptional 19.1% |
| Sri Lankans | 99.6 /100 | #59 | Exceptional 19.2% |
| Russians | 99.6 /100 | #60 | Exceptional 19.2% |
Demographics Similar to Whites/Caucasians by Single Female Poverty
In terms of single female poverty, the demographic groups most similar to Whites/Caucasians are Celtic (22.7%, a difference of 0.080%), Bahamian (22.7%, a difference of 0.14%), Sudanese (22.6%, a difference of 0.34%), Immigrants from Cabo Verde (22.8%, a difference of 0.34%), and Immigrants from Belize (22.6%, a difference of 0.48%).
| Demographics | Rating | Rank | Single Female Poverty |
| Delaware | 1.0 /100 | #252 | Tragic 22.5% |
| Immigrants | Liberia | 0.9 /100 | #253 | Tragic 22.5% |
| Immigrants | Burma/Myanmar | 0.8 /100 | #254 | Tragic 22.6% |
| Immigrants | Sudan | 0.8 /100 | #255 | Tragic 22.6% |
| Immigrants | Belize | 0.8 /100 | #256 | Tragic 22.6% |
| Sudanese | 0.7 /100 | #257 | Tragic 22.6% |
| Bahamians | 0.6 /100 | #258 | Tragic 22.7% |
| Whites/Caucasians | 0.6 /100 | #259 | Tragic 22.7% |
| Celtics | 0.5 /100 | #260 | Tragic 22.7% |
| Immigrants | Cabo Verde | 0.4 /100 | #261 | Tragic 22.8% |
| British West Indians | 0.4 /100 | #262 | Tragic 22.8% |
| Scotch-Irish | 0.3 /100 | #263 | Tragic 22.9% |
| Immigrants | Laos | 0.3 /100 | #264 | Tragic 22.9% |
| Central Americans | 0.2 /100 | #265 | Tragic 23.0% |
| Immigrants | Micronesia | 0.2 /100 | #266 | Tragic 23.0% |