Immigrants from Italy vs South American Indian Single Female Poverty
COMPARE
Immigrants from Italy
South American Indian
Single Female Poverty
Single Female Poverty Comparison
Immigrants from Italy
South American Indians
19.0%
SINGLE FEMALE POVERTY
99.8/ 100
METRIC RATING
51st/ 347
METRIC RANK
20.6%
SINGLE FEMALE POVERTY
75.7/ 100
METRIC RATING
156th/ 347
METRIC RANK
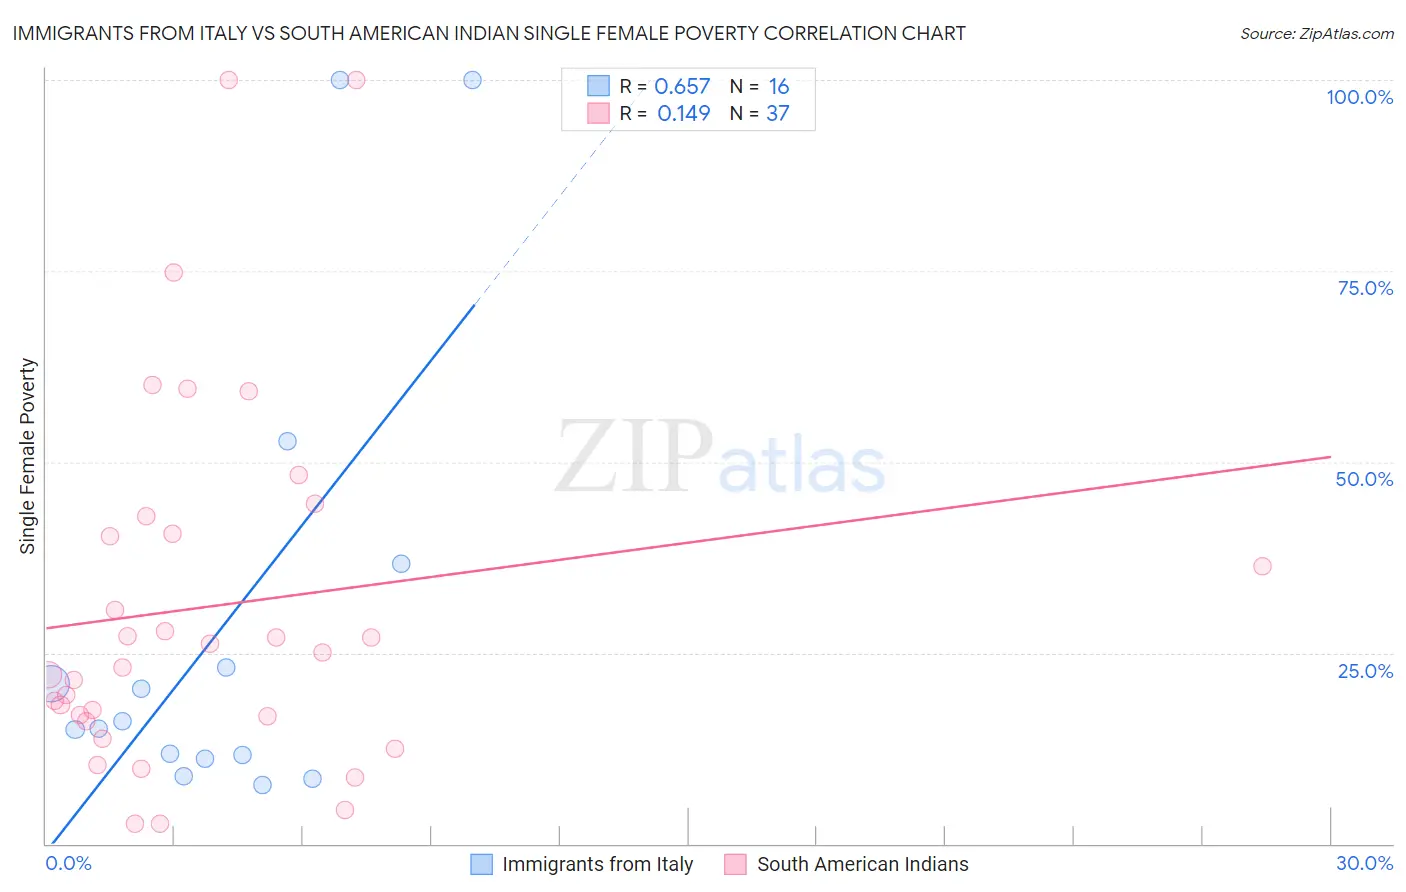
Immigrants from Italy vs South American Indian Single Female Poverty Correlation Chart
The statistical analysis conducted on geographies consisting of 318,580,979 people shows a significant positive correlation between the proportion of Immigrants from Italy and poverty level among single females in the United States with a correlation coefficient (R) of 0.657 and weighted average of 19.0%. Similarly, the statistical analysis conducted on geographies consisting of 163,615,516 people shows a poor positive correlation between the proportion of South American Indians and poverty level among single females in the United States with a correlation coefficient (R) of 0.149 and weighted average of 20.6%, a difference of 8.3%.
Single Female Poverty Correlation Summary
| Measurement | Immigrants from Italy | South American Indian |
| Minimum | 7.7% | 2.6% |
| Maximum | 100.0% | 100.0% |
| Range | 92.3% | 97.4% |
| Mean | 28.7% | 31.1% |
| Median | 15.6% | 25.0% |
| Interquartile 25% (IQ1) | 11.4% | 16.4% |
| Interquartile 75% (IQ3) | 29.9% | 41.7% |
| Interquartile Range (IQR) | 18.5% | 25.3% |
| Standard Deviation (Sample) | 30.1% | 24.0% |
| Standard Deviation (Population) | 29.2% | 23.6% |
Similar Demographics by Single Female Poverty
Demographics Similar to Immigrants from Italy by Single Female Poverty
In terms of single female poverty, the demographic groups most similar to Immigrants from Italy are Immigrants from Eastern Europe (19.0%, a difference of 0.040%), Egyptian (19.1%, a difference of 0.040%), Immigrants from Czechoslovakia (19.0%, a difference of 0.080%), Immigrants from Argentina (19.0%, a difference of 0.090%), and Tsimshian (19.1%, a difference of 0.25%).
| Demographics | Rating | Rank | Single Female Poverty |
| Immigrants | Croatia | 99.9 /100 | #44 | Exceptional 18.9% |
| Immigrants | Indonesia | 99.8 /100 | #45 | Exceptional 18.9% |
| Macedonians | 99.8 /100 | #46 | Exceptional 18.9% |
| Latvians | 99.8 /100 | #47 | Exceptional 19.0% |
| Immigrants | Argentina | 99.8 /100 | #48 | Exceptional 19.0% |
| Immigrants | Czechoslovakia | 99.8 /100 | #49 | Exceptional 19.0% |
| Immigrants | Eastern Europe | 99.8 /100 | #50 | Exceptional 19.0% |
| Immigrants | Italy | 99.8 /100 | #51 | Exceptional 19.0% |
| Egyptians | 99.7 /100 | #52 | Exceptional 19.1% |
| Tsimshian | 99.7 /100 | #53 | Exceptional 19.1% |
| Argentineans | 99.7 /100 | #54 | Exceptional 19.1% |
| Immigrants | Vietnam | 99.7 /100 | #55 | Exceptional 19.1% |
| Immigrants | Fiji | 99.7 /100 | #56 | Exceptional 19.1% |
| Eastern Europeans | 99.7 /100 | #57 | Exceptional 19.1% |
| Immigrants | Bulgaria | 99.7 /100 | #58 | Exceptional 19.1% |
Demographics Similar to South American Indians by Single Female Poverty
In terms of single female poverty, the demographic groups most similar to South American Indians are Samoan (20.6%, a difference of 0.030%), Immigrants from Western Europe (20.6%, a difference of 0.10%), Immigrants from Oceania (20.7%, a difference of 0.12%), Swedish (20.6%, a difference of 0.13%), and Immigrants from Uruguay (20.6%, a difference of 0.18%).
| Demographics | Rating | Rank | Single Female Poverty |
| Portuguese | 81.5 /100 | #149 | Excellent 20.5% |
| Immigrants | Denmark | 80.5 /100 | #150 | Excellent 20.5% |
| Puget Sound Salish | 79.6 /100 | #151 | Good 20.6% |
| Immigrants | Uruguay | 77.7 /100 | #152 | Good 20.6% |
| Swedes | 77.1 /100 | #153 | Good 20.6% |
| Immigrants | Western Europe | 76.7 /100 | #154 | Good 20.6% |
| Samoans | 76.0 /100 | #155 | Good 20.6% |
| South American Indians | 75.7 /100 | #156 | Good 20.6% |
| Immigrants | Oceania | 74.3 /100 | #157 | Good 20.7% |
| Danes | 73.0 /100 | #158 | Good 20.7% |
| Costa Ricans | 71.8 /100 | #159 | Good 20.7% |
| Arabs | 70.8 /100 | #160 | Good 20.7% |
| Kenyans | 68.5 /100 | #161 | Good 20.8% |
| Northern Europeans | 68.4 /100 | #162 | Good 20.8% |
| Lebanese | 67.6 /100 | #163 | Good 20.8% |