Tsimshian vs Jordanian Single Female Poverty
COMPARE
Tsimshian
Jordanian
Single Female Poverty
Single Female Poverty Comparison
Tsimshian
Jordanians
19.1%
SINGLE FEMALE POVERTY
99.7/ 100
METRIC RATING
53rd/ 347
METRIC RANK
18.8%
SINGLE FEMALE POVERTY
99.9/ 100
METRIC RATING
42nd/ 347
METRIC RANK
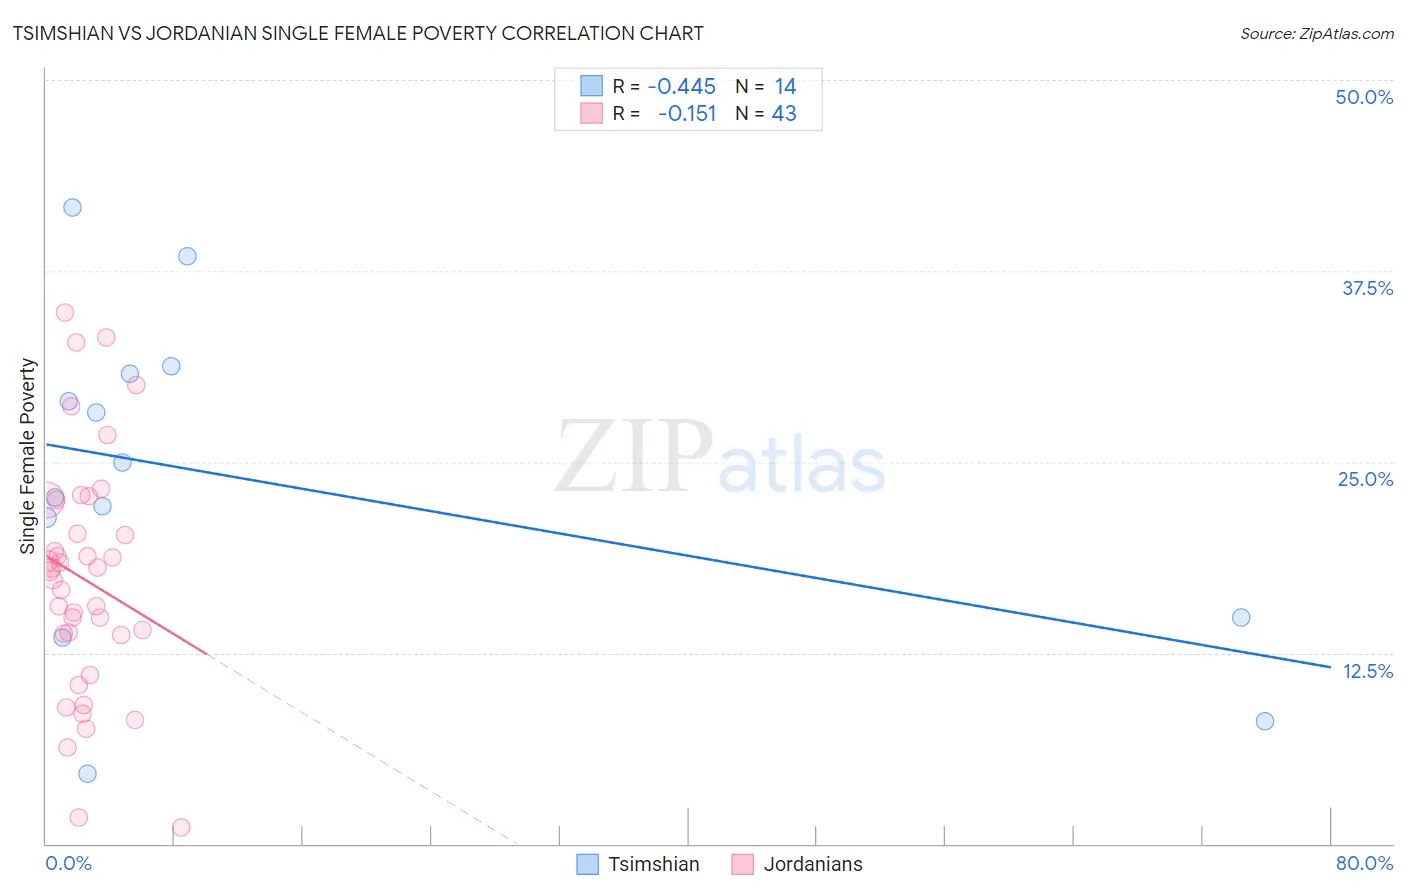
Tsimshian vs Jordanian Single Female Poverty Correlation Chart
The statistical analysis conducted on geographies consisting of 15,615,751 people shows a moderate negative correlation between the proportion of Tsimshian and poverty level among single females in the United States with a correlation coefficient (R) of -0.445 and weighted average of 19.1%. Similarly, the statistical analysis conducted on geographies consisting of 165,541,615 people shows a poor negative correlation between the proportion of Jordanians and poverty level among single females in the United States with a correlation coefficient (R) of -0.151 and weighted average of 18.8%, a difference of 1.5%.
Single Female Poverty Correlation Summary
| Measurement | Tsimshian | Jordanian |
| Minimum | 4.5% | 1.0% |
| Maximum | 41.7% | 34.8% |
| Range | 37.1% | 33.7% |
| Mean | 23.7% | 17.3% |
| Median | 23.8% | 17.8% |
| Interquartile 25% (IQ1) | 14.8% | 13.7% |
| Interquartile 75% (IQ3) | 30.8% | 22.5% |
| Interquartile Range (IQR) | 16.0% | 8.8% |
| Standard Deviation (Sample) | 10.7% | 7.8% |
| Standard Deviation (Population) | 10.4% | 7.7% |
Demographics Similar to Tsimshian and Jordanians by Single Female Poverty
In terms of single female poverty, the demographic groups most similar to Tsimshian are Argentinean (19.1%, a difference of 0.010%), Immigrants from Vietnam (19.1%, a difference of 0.050%), Immigrants from Fiji (19.1%, a difference of 0.10%), Eastern European (19.1%, a difference of 0.16%), and Egyptian (19.1%, a difference of 0.21%). Similarly, the demographic groups most similar to Jordanians are Immigrants from Serbia (18.8%, a difference of 0.080%), Okinawan (18.8%, a difference of 0.090%), Bulgarian (18.8%, a difference of 0.13%), Immigrants from Romania (18.8%, a difference of 0.15%), and Tongan (18.8%, a difference of 0.16%).
| Demographics | Rating | Rank | Single Female Poverty |
| Immigrants | Armenia | 99.9 /100 | #37 | Exceptional 18.7% |
| Tongans | 99.9 /100 | #38 | Exceptional 18.8% |
| Bulgarians | 99.9 /100 | #39 | Exceptional 18.8% |
| Okinawans | 99.9 /100 | #40 | Exceptional 18.8% |
| Immigrants | Serbia | 99.9 /100 | #41 | Exceptional 18.8% |
| Jordanians | 99.9 /100 | #42 | Exceptional 18.8% |
| Immigrants | Romania | 99.9 /100 | #43 | Exceptional 18.8% |
| Immigrants | Croatia | 99.9 /100 | #44 | Exceptional 18.9% |
| Immigrants | Indonesia | 99.8 /100 | #45 | Exceptional 18.9% |
| Macedonians | 99.8 /100 | #46 | Exceptional 18.9% |
| Latvians | 99.8 /100 | #47 | Exceptional 19.0% |
| Immigrants | Argentina | 99.8 /100 | #48 | Exceptional 19.0% |
| Immigrants | Czechoslovakia | 99.8 /100 | #49 | Exceptional 19.0% |
| Immigrants | Eastern Europe | 99.8 /100 | #50 | Exceptional 19.0% |
| Immigrants | Italy | 99.8 /100 | #51 | Exceptional 19.0% |
| Egyptians | 99.7 /100 | #52 | Exceptional 19.1% |
| Tsimshian | 99.7 /100 | #53 | Exceptional 19.1% |
| Argentineans | 99.7 /100 | #54 | Exceptional 19.1% |
| Immigrants | Vietnam | 99.7 /100 | #55 | Exceptional 19.1% |
| Immigrants | Fiji | 99.7 /100 | #56 | Exceptional 19.1% |
| Eastern Europeans | 99.7 /100 | #57 | Exceptional 19.1% |