Tsimshian vs Inupiat Single Female Poverty
COMPARE
Tsimshian
Inupiat
Single Female Poverty
Single Female Poverty Comparison
Tsimshian
Inupiat
19.1%
SINGLE FEMALE POVERTY
99.7/ 100
METRIC RATING
53rd/ 347
METRIC RANK
23.1%
SINGLE FEMALE POVERTY
0.2/ 100
METRIC RATING
270th/ 347
METRIC RANK
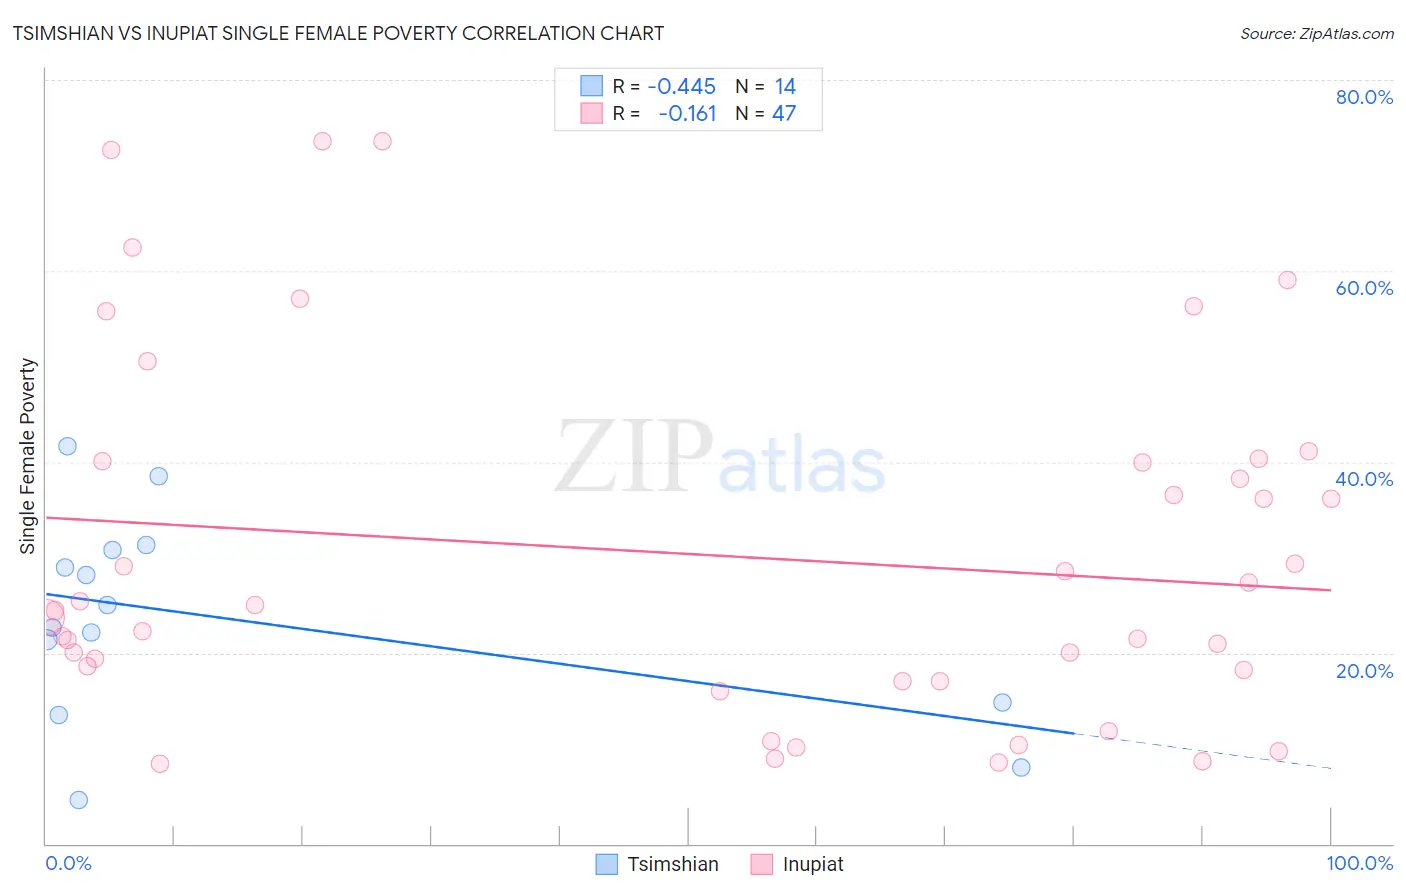
Tsimshian vs Inupiat Single Female Poverty Correlation Chart
The statistical analysis conducted on geographies consisting of 15,615,751 people shows a moderate negative correlation between the proportion of Tsimshian and poverty level among single females in the United States with a correlation coefficient (R) of -0.445 and weighted average of 19.1%. Similarly, the statistical analysis conducted on geographies consisting of 95,986,972 people shows a poor negative correlation between the proportion of Inupiat and poverty level among single females in the United States with a correlation coefficient (R) of -0.161 and weighted average of 23.1%, a difference of 21.1%.
Single Female Poverty Correlation Summary
| Measurement | Tsimshian | Inupiat |
| Minimum | 4.5% | 8.3% |
| Maximum | 41.7% | 73.6% |
| Range | 37.1% | 65.3% |
| Mean | 23.7% | 30.3% |
| Median | 23.8% | 24.4% |
| Interquartile 25% (IQ1) | 14.8% | 17.1% |
| Interquartile 75% (IQ3) | 30.8% | 40.1% |
| Interquartile Range (IQR) | 16.0% | 23.1% |
| Standard Deviation (Sample) | 10.7% | 18.6% |
| Standard Deviation (Population) | 10.4% | 18.4% |
Similar Demographics by Single Female Poverty
Demographics Similar to Tsimshian by Single Female Poverty
In terms of single female poverty, the demographic groups most similar to Tsimshian are Argentinean (19.1%, a difference of 0.010%), Immigrants from Vietnam (19.1%, a difference of 0.050%), Immigrants from Fiji (19.1%, a difference of 0.10%), Eastern European (19.1%, a difference of 0.16%), and Egyptian (19.1%, a difference of 0.21%).
| Demographics | Rating | Rank | Single Female Poverty |
| Macedonians | 99.8 /100 | #46 | Exceptional 18.9% |
| Latvians | 99.8 /100 | #47 | Exceptional 19.0% |
| Immigrants | Argentina | 99.8 /100 | #48 | Exceptional 19.0% |
| Immigrants | Czechoslovakia | 99.8 /100 | #49 | Exceptional 19.0% |
| Immigrants | Eastern Europe | 99.8 /100 | #50 | Exceptional 19.0% |
| Immigrants | Italy | 99.8 /100 | #51 | Exceptional 19.0% |
| Egyptians | 99.7 /100 | #52 | Exceptional 19.1% |
| Tsimshian | 99.7 /100 | #53 | Exceptional 19.1% |
| Argentineans | 99.7 /100 | #54 | Exceptional 19.1% |
| Immigrants | Vietnam | 99.7 /100 | #55 | Exceptional 19.1% |
| Immigrants | Fiji | 99.7 /100 | #56 | Exceptional 19.1% |
| Eastern Europeans | 99.7 /100 | #57 | Exceptional 19.1% |
| Immigrants | Bulgaria | 99.7 /100 | #58 | Exceptional 19.1% |
| Sri Lankans | 99.6 /100 | #59 | Exceptional 19.2% |
| Russians | 99.6 /100 | #60 | Exceptional 19.2% |
Demographics Similar to Inupiat by Single Female Poverty
In terms of single female poverty, the demographic groups most similar to Inupiat are Subsaharan African (23.2%, a difference of 0.25%), Hmong (23.1%, a difference of 0.26%), Fijian (23.1%, a difference of 0.28%), Senegalese (23.0%, a difference of 0.35%), and Immigrants from Micronesia (23.0%, a difference of 0.41%).
| Demographics | Rating | Rank | Single Female Poverty |
| Scotch-Irish | 0.3 /100 | #263 | Tragic 22.9% |
| Immigrants | Laos | 0.3 /100 | #264 | Tragic 22.9% |
| Central Americans | 0.2 /100 | #265 | Tragic 23.0% |
| Immigrants | Micronesia | 0.2 /100 | #266 | Tragic 23.0% |
| Senegalese | 0.2 /100 | #267 | Tragic 23.0% |
| Fijians | 0.2 /100 | #268 | Tragic 23.1% |
| Hmong | 0.2 /100 | #269 | Tragic 23.1% |
| Inupiat | 0.2 /100 | #270 | Tragic 23.1% |
| Sub-Saharan Africans | 0.1 /100 | #271 | Tragic 23.2% |
| Immigrants | Senegal | 0.1 /100 | #272 | Tragic 23.2% |
| Alaska Natives | 0.1 /100 | #273 | Tragic 23.3% |
| Marshallese | 0.1 /100 | #274 | Tragic 23.3% |
| Mexican American Indians | 0.1 /100 | #275 | Tragic 23.4% |
| Immigrants | Azores | 0.0 /100 | #276 | Tragic 23.5% |
| Pennsylvania Germans | 0.0 /100 | #277 | Tragic 23.6% |