Immigrants from Guyana vs Sri Lankan Married-Couple Family Poverty

COMPARE

Immigrants from Guyana
Race
Ancestry
AfghanAfricanAlaska NativeAlaskan AthabascanAlbanianAleutAlsatianAmericanApacheArabArapahoArgentineanArmenianAssyrian/Chaldean/SyriacAustralianAustrianBahamianBangladeshiBarbadianBasqueBelgianBelizeanBermudanBhutaneseBlackfeetBolivianBrazilianBritishBritish West IndianBulgarianBurmeseCajunCambodianCanadianCape VerdeanCarpatho RusynCelticCentral AmericanCentral American IndianCherokeeCheyenneChickasawChileanChineseChippewaChoctawColombianColvilleComancheCosta RicanCreeCreekCroatianCrowCubanCypriotCzechCzechoslovakianDanishDelawareDominicanDutchDutch West IndianEastern EuropeanEcuadorianEgyptianEnglishEstonianEthiopianEuropeanFijianFilipinoFinnishFrenchFrench American IndianFrench CanadianGermanGerman RussianGhanaianGreekGuamanian/ChamorroGuatemalanGuyaneseHaitianHmongHonduranHopiHoumaHungarianIcelanderIndian (Asian)IndonesianInupiatIranianIraqiIrishIroquoisIsraeliItalianJamaicanJapaneseJordanianKenyanKiowaKoreanLaotianLatvianLebaneseLiberianLithuanianLumbeeLuxembourgerMacedonianMalaysianMalteseMarshalleseMenomineeMexicanMexican American IndianMongolianMoroccanNative HawaiianNavajoNepaleseNew ZealanderNicaraguanNigerianNorthern EuropeanNorwegianOkinawanOsageOttawaPaiutePakistaniPalestinianPanamanianParaguayanPennsylvania GermanPeruvianPimaPolishPortuguesePotawatomiPuebloPuerto RicanPuget Sound SalishRomanianRussianSalvadoranSamoanScandinavianScotch-IrishScottishSeminoleSenegaleseSerbianShoshoneSierra LeoneanSiouxSlavicSlovakSloveneSomaliSouth AfricanSouth AmericanSouth American IndianSoviet UnionSpaniardSpanishSpanish AmericanSpanish American IndianSubsaharan AfricanSudaneseSwedishSwissSyrianTaiwaneseThaiTlingit-HaidaTohono O'OdhamTonganTrinidadian and TobagonianTsimshianTurkishU.S. Virgin IslanderUgandanUkrainianUruguayanUteVenezuelanVietnameseWelshWest IndianYakamaYaquiYugoslavianYumanYup'ikZimbabwean
Immigration
NonimmigrantsImmigrantsAfghanistanAfricaAlbaniaArgentinaArmeniaAsiaAustraliaAustriaBahamasBangladeshBarbadosBelarusBelgiumBelizeBoliviaBosnia and HerzegovinaBrazilBulgariaBurma/MyanmarCabo VerdeCambodiaCameroonCanadaCaribbeanCentral AmericaChileChinaColombiaCongoCosta RicaCroatiaCubaCzechoslovakiaDenmarkDominicaDominican RepublicEastern AfricaEastern AsiaEastern EuropeEcuadorEgyptEl SalvadorEnglandEritreaEthiopiaEuropeFijiFranceGermanyGhanaGreeceGrenadaGuatemalaGuyanaHaitiHondurasHong KongHungaryIndiaIndonesiaIranIraqIrelandIsraelItalyJamaicaJapanJordanKazakhstanKenyaKoreaKuwaitLaosLatin AmericaLatviaLebanonLiberiaLithuaniaMalaysiaMexicoMicronesiaMiddle AfricaMoldovaMoroccoNepalNetherlandsNicaraguaNigeriaNorth AmericaNorth MacedoniaNorthern AfricaNorthern EuropeNorwayOceaniaPakistanPanamaPeruPhilippinesPolandPortugalRomaniaRussiaSaudi ArabiaScotlandSenegalSerbiaSierra LeoneSingaporeSomaliaSouth AfricaSouth AmericaSouth Central AsiaSouth Eastern AsiaSouthern EuropeSpainSri LankaSt. Vincent and the GrenadinesSudanSwedenSwitzerlandSyriaTaiwanThailandTrinidad and TobagoTurkeyUgandaUkraineUruguayUzbekistanVenezuelaVietnamWest IndiesWestern AfricaWestern AsiaWestern EuropeYemenZaireZimbabweAzores
Sri Lankan
Race
Ancestry
AfghanAfricanAlaska NativeAlaskan AthabascanAlbanianAleutAlsatianAmericanApacheArabArapahoArgentineanArmenianAssyrian/Chaldean/SyriacAustralianAustrianBahamianBangladeshiBarbadianBasqueBelgianBelizeanBermudanBhutaneseBlackfeetBolivianBrazilianBritishBritish West IndianBulgarianBurmeseCajunCambodianCanadianCape VerdeanCarpatho RusynCelticCentral AmericanCentral American IndianCherokeeCheyenneChickasawChileanChineseChippewaChoctawColombianColvilleComancheCosta RicanCreeCreekCroatianCrowCubanCypriotCzechCzechoslovakianDanishDelawareDominicanDutchDutch West IndianEastern EuropeanEcuadorianEgyptianEnglishEstonianEthiopianEuropeanFijianFilipinoFinnishFrenchFrench American IndianFrench CanadianGermanGerman RussianGhanaianGreekGuamanian/ChamorroGuatemalanGuyaneseHaitianHmongHonduranHopiHoumaHungarianIcelanderIndian (Asian)IndonesianInupiatIranianIraqiIrishIroquoisIsraeliItalianJamaicanJapaneseJordanianKenyanKiowaKoreanLaotianLatvianLebaneseLiberianLithuanianLumbeeLuxembourgerMacedonianMalaysianMalteseMarshalleseMenomineeMexicanMexican American IndianMongolianMoroccanNative HawaiianNavajoNepaleseNew ZealanderNicaraguanNigerianNorthern EuropeanNorwegianOkinawanOsageOttawaPaiutePakistaniPalestinianPanamanianParaguayanPennsylvania GermanPeruvianPimaPolishPortuguesePotawatomiPuebloPuerto RicanPuget Sound SalishRomanianRussianSalvadoranSamoanScandinavianScotch-IrishScottishSeminoleSenegaleseSerbianShoshoneSierra LeoneanSiouxSlavicSlovakSloveneSomaliSouth AfricanSouth AmericanSouth American IndianSoviet UnionSpaniardSpanishSpanish AmericanSpanish American IndianSri LankanSubsaharan AfricanSudaneseSwedishSwissSyrianTaiwaneseThaiTlingit-HaidaTohono O'OdhamTonganTrinidadian and TobagonianTsimshianTurkishU.S. Virgin IslanderUgandanUkrainianUruguayanUteVenezuelanVietnameseWelshWest IndianYakamaYaquiYugoslavianYumanYup'ikZimbabwean
Immigration
NonimmigrantsImmigrantsAfghanistanAfricaAlbaniaArgentinaArmeniaAsiaAustraliaAustriaBahamasBangladeshBarbadosBelarusBelgiumBelizeBoliviaBosnia and HerzegovinaBrazilBulgariaBurma/MyanmarCabo VerdeCambodiaCameroonCanadaCaribbeanCentral AmericaChileChinaColombiaCongoCosta RicaCroatiaCubaCzechoslovakiaDenmarkDominicaDominican RepublicEastern AfricaEastern AsiaEastern EuropeEcuadorEgyptEl SalvadorEnglandEritreaEthiopiaEuropeFijiFranceGermanyGhanaGreeceGrenadaGuatemalaHaitiHondurasHong KongHungaryIndiaIndonesiaIranIraqIrelandIsraelItalyJamaicaJapanJordanKazakhstanKenyaKoreaKuwaitLaosLatin AmericaLatviaLebanonLiberiaLithuaniaMalaysiaMexicoMicronesiaMiddle AfricaMoldovaMoroccoNepalNetherlandsNicaraguaNigeriaNorth AmericaNorth MacedoniaNorthern AfricaNorthern EuropeNorwayOceaniaPakistanPanamaPeruPhilippinesPolandPortugalRomaniaRussiaSaudi ArabiaScotlandSenegalSerbiaSierra LeoneSingaporeSomaliaSouth AfricaSouth AmericaSouth Central AsiaSouth Eastern AsiaSouthern EuropeSpainSri LankaSt. Vincent and the GrenadinesSudanSwedenSwitzerlandSyriaTaiwanThailandTrinidad and TobagoTurkeyUgandaUkraineUruguayUzbekistanVenezuelaVietnamWest IndiesWestern AfricaWestern AsiaWestern EuropeYemenZaireZimbabweAzores
Married-Couple Family Poverty
Income
Poverty
Unemployment
Labor Participation
Family Structure
Vehicle Availability
Education Level
Disability

Married-Couple Family Poverty Comparison

Immigrants from Guyana

Sri Lankans

Tragic
Good
6.7%
MARRIED-COUPLE FAMILY POVERTY
0.0/ 100
METRIC RATING
298th/ 347
METRIC RANK
5.1%
MARRIED-COUPLE FAMILY POVERTY
72.2/ 100
METRIC RATING
156th/ 347
METRIC RANK

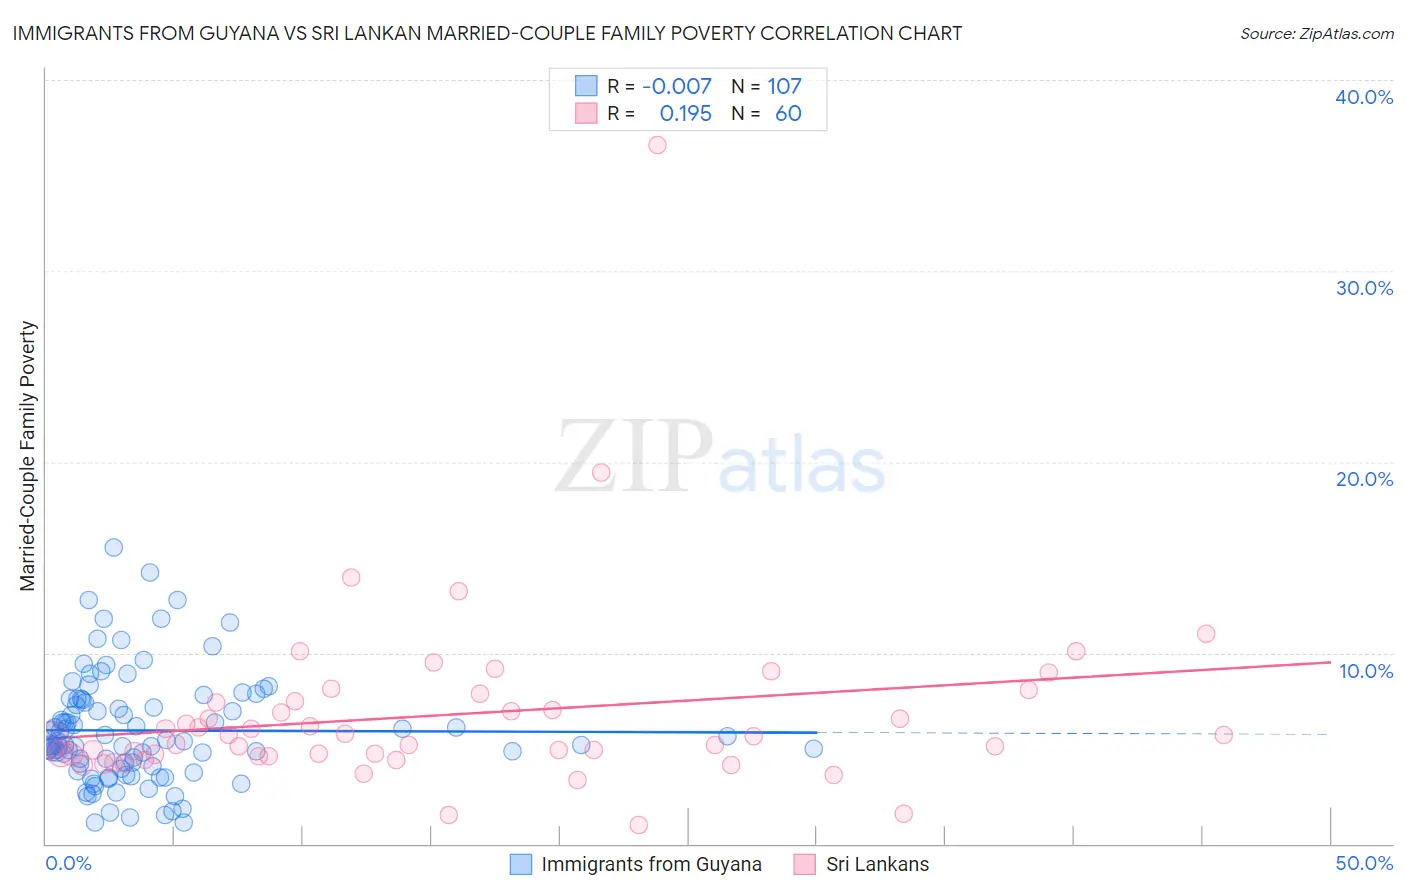
Immigrants from Guyana vs Sri Lankan Married-Couple Family Poverty Correlation Chart

The statistical analysis conducted on geographies consisting of 182,855,108 people shows no correlation between the proportion of Immigrants from Guyana and poverty level among married-couple families in the United States with a correlation coefficient (R) of -0.007 and weighted average of 6.7%. Similarly, the statistical analysis conducted on geographies consisting of 436,204,277 people shows a poor positive correlation between the proportion of Sri Lankans and poverty level among married-couple families in the United States with a correlation coefficient (R) of 0.195 and weighted average of 5.1%, a difference of 31.1%.
Immigrants from Guyana vs Sri Lankan Married-Couple Family Poverty

Married-Couple Family Poverty Correlation Summary

MeasurementImmigrants from GuyanaSri Lankan
Minimum1.1%0.96%
Maximum15.5%36.6%
Range14.4%35.6%
Mean5.9%6.8%
Median5.3%5.5%
Interquartile 25% (IQ1)4.1%4.6%
Interquartile 75% (IQ3)7.6%7.4%
Interquartile Range (IQR)3.5%2.8%
Standard Deviation (Sample)2.9%4.9%
Standard Deviation (Population)2.8%4.9%

Similar Demographics by Married-Couple Family Poverty

Demographics Similar to Immigrants from Guyana by Married-Couple Family Poverty

In terms of married-couple family poverty, the demographic groups most similar to Immigrants from Guyana are U.S. Virgin Islander (6.6%, a difference of 0.070%), Kiowa (6.6%, a difference of 0.070%), Immigrants from Uzbekistan (6.6%, a difference of 0.18%), Bahamian (6.6%, a difference of 0.47%), and Nicaraguan (6.7%, a difference of 0.55%).
DemographicsRating | RankMarried-Couple Family Poverty
Belizeans
0.0
/100
|
#291
Tragic
6.5%
Immigrants | Lebanon
0.0
/100
|
#292
Tragic
6.6%
Arapaho
0.0
/100
|
#293
Tragic
6.6%
Bahamians
0.0
/100
|
#294
Tragic
6.6%
Immigrants | Uzbekistan
0.0
/100
|
#295
Tragic
6.6%
U.S. Virgin Islanders
0.0
/100
|
#296
Tragic
6.6%
Kiowa
0.0
/100
|
#297
Tragic
6.6%
Immigrants | Guyana
0.0
/100
|
#298
Tragic
6.7%
Nicaraguans
0.0
/100
|
#299
Tragic
6.7%
Immigrants | Belize
0.0
/100
|
#300
Tragic
6.7%
Central Americans
0.0
/100
|
#301
Tragic
6.7%
Immigrants | Ecuador
0.0
/100
|
#302
Tragic
6.7%
Immigrants | El Salvador
0.0
/100
|
#303
Tragic
6.8%
Cubans
0.0
/100
|
#304
Tragic
6.8%
Haitians
0.0
/100
|
#305
Tragic
6.8%

Demographics Similar to Sri Lankans by Married-Couple Family Poverty

In terms of married-couple family poverty, the demographic groups most similar to Sri Lankans are Immigrants from Ethiopia (5.1%, a difference of 0.040%), Argentinean (5.1%, a difference of 0.22%), Delaware (5.1%, a difference of 0.23%), Immigrants from South Eastern Asia (5.1%, a difference of 0.27%), and Immigrants from Saudi Arabia (5.1%, a difference of 0.27%).
DemographicsRating | RankMarried-Couple Family Poverty
Immigrants | Oceania
78.6
/100
|
#149
Good
5.0%
Brazilians
78.3
/100
|
#150
Good
5.0%
Immigrants | Cameroon
77.3
/100
|
#151
Good
5.0%
Albanians
77.2
/100
|
#152
Good
5.0%
Immigrants | Kuwait
76.3
/100
|
#153
Good
5.0%
Delaware
73.7
/100
|
#154
Good
5.1%
Immigrants | Ethiopia
72.4
/100
|
#155
Good
5.1%
Sri Lankans
72.2
/100
|
#156
Good
5.1%
Argentineans
70.7
/100
|
#157
Good
5.1%
Immigrants | South Eastern Asia
70.4
/100
|
#158
Good
5.1%
Immigrants | Saudi Arabia
70.3
/100
|
#159
Good
5.1%
Pennsylvania Germans
68.5
/100
|
#160
Good
5.1%
Ethiopians
68.1
/100
|
#161
Good
5.1%
Immigrants | Jordan
66.5
/100
|
#162
Good
5.1%
Sierra Leoneans
64.1
/100
|
#163
Good
5.1%