Salvadoran vs Sri Lankan Female Poverty
COMPARE
Salvadoran
Sri Lankan
Female Poverty
Female Poverty Comparison
Salvadorans
Sri Lankans
15.3%
FEMALE POVERTY
0.3/ 100
METRIC RATING
249th/ 347
METRIC RANK
12.7%
FEMALE POVERTY
90.9/ 100
METRIC RATING
118th/ 347
METRIC RANK
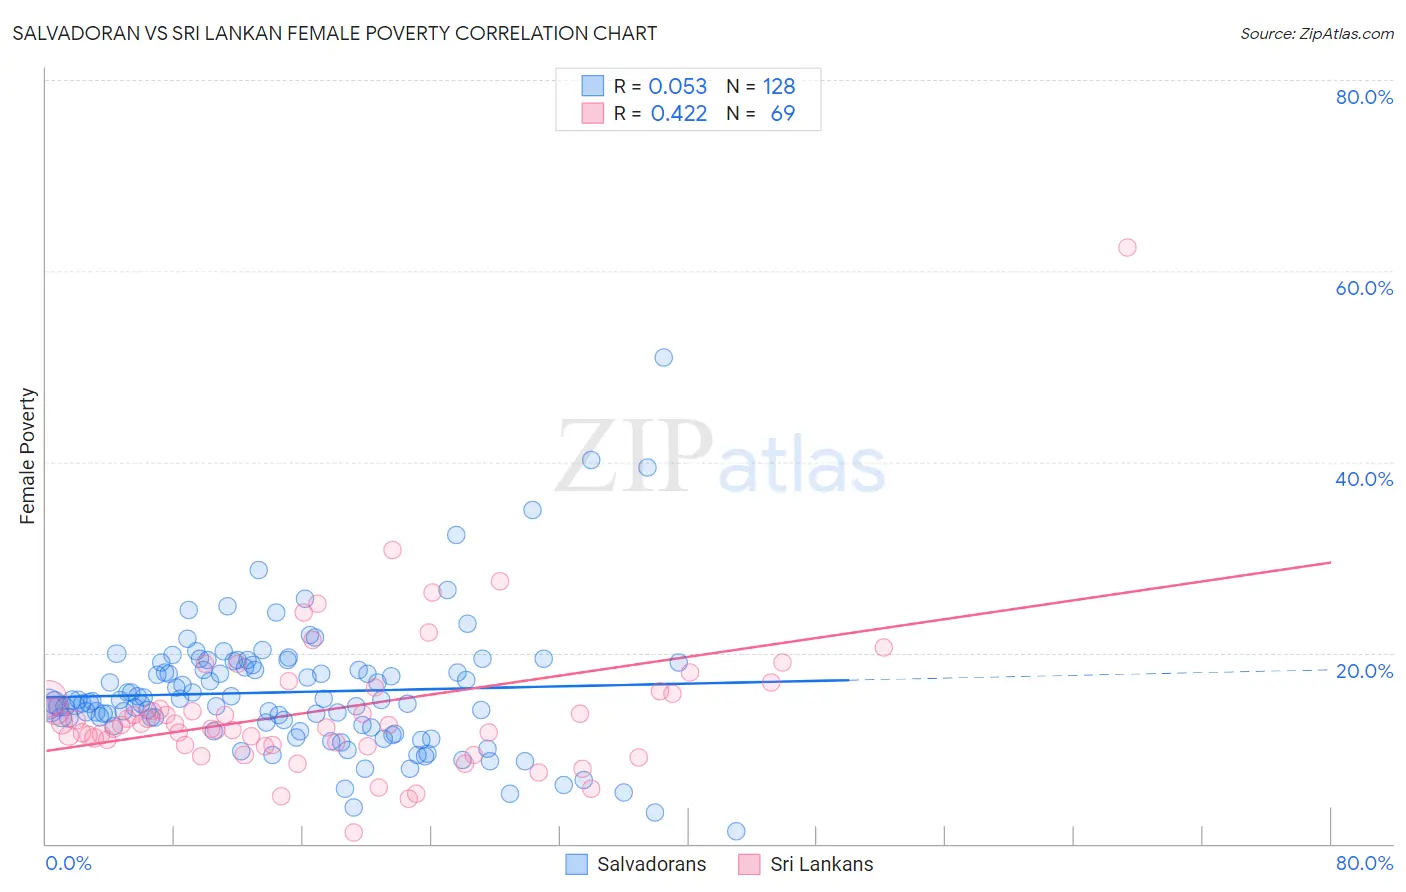
Salvadoran vs Sri Lankan Female Poverty Correlation Chart
The statistical analysis conducted on geographies consisting of 398,655,447 people shows a slight positive correlation between the proportion of Salvadorans and poverty level among females in the United States with a correlation coefficient (R) of 0.053 and weighted average of 15.3%. Similarly, the statistical analysis conducted on geographies consisting of 440,042,655 people shows a moderate positive correlation between the proportion of Sri Lankans and poverty level among females in the United States with a correlation coefficient (R) of 0.422 and weighted average of 12.7%, a difference of 20.7%.
Female Poverty Correlation Summary
| Measurement | Salvadoran | Sri Lankan |
| Minimum | 1.3% | 1.2% |
| Maximum | 50.9% | 62.5% |
| Range | 49.7% | 61.3% |
| Mean | 15.9% | 14.0% |
| Median | 14.9% | 12.5% |
| Interquartile 25% (IQ1) | 12.3% | 10.3% |
| Interquartile 75% (IQ3) | 18.6% | 15.8% |
| Interquartile Range (IQR) | 6.3% | 5.5% |
| Standard Deviation (Sample) | 6.9% | 8.1% |
| Standard Deviation (Population) | 6.9% | 8.0% |
Similar Demographics by Female Poverty
Demographics Similar to Salvadorans by Female Poverty
In terms of female poverty, the demographic groups most similar to Salvadorans are Immigrants from Western Africa (15.3%, a difference of 0.040%), Potawatomi (15.3%, a difference of 0.14%), Immigrants from Ghana (15.3%, a difference of 0.14%), Cuban (15.3%, a difference of 0.15%), and Spanish American Indian (15.3%, a difference of 0.20%).
| Demographics | Rating | Rank | Female Poverty |
| Nepalese | 0.4 /100 | #242 | Tragic 15.2% |
| Nicaraguans | 0.3 /100 | #243 | Tragic 15.3% |
| Ecuadorians | 0.3 /100 | #244 | Tragic 15.3% |
| Spanish American Indians | 0.3 /100 | #245 | Tragic 15.3% |
| Cubans | 0.3 /100 | #246 | Tragic 15.3% |
| Potawatomi | 0.3 /100 | #247 | Tragic 15.3% |
| Immigrants | Ghana | 0.3 /100 | #248 | Tragic 15.3% |
| Salvadorans | 0.3 /100 | #249 | Tragic 15.3% |
| Immigrants | Western Africa | 0.3 /100 | #250 | Tragic 15.3% |
| Immigrants | Trinidad and Tobago | 0.3 /100 | #251 | Tragic 15.4% |
| Immigrants | Burma/Myanmar | 0.3 /100 | #252 | Tragic 15.4% |
| Liberians | 0.2 /100 | #253 | Tragic 15.4% |
| Trinidadians and Tobagonians | 0.2 /100 | #254 | Tragic 15.4% |
| Ottawa | 0.2 /100 | #255 | Tragic 15.5% |
| Jamaicans | 0.2 /100 | #256 | Tragic 15.5% |
Demographics Similar to Sri Lankans by Female Poverty
In terms of female poverty, the demographic groups most similar to Sri Lankans are Albanian (12.7%, a difference of 0.010%), Immigrants from Southern Europe (12.7%, a difference of 0.020%), New Zealander (12.7%, a difference of 0.070%), Immigrants from Russia (12.7%, a difference of 0.090%), and Immigrants from Hungary (12.7%, a difference of 0.17%).
| Demographics | Rating | Rank | Female Poverty |
| Soviet Union | 92.4 /100 | #111 | Exceptional 12.6% |
| Immigrants | Israel | 92.0 /100 | #112 | Exceptional 12.6% |
| Canadians | 92.0 /100 | #113 | Exceptional 12.7% |
| Welsh | 91.6 /100 | #114 | Exceptional 12.7% |
| Puget Sound Salish | 91.5 /100 | #115 | Exceptional 12.7% |
| Immigrants | Russia | 91.2 /100 | #116 | Exceptional 12.7% |
| Immigrants | Southern Europe | 90.9 /100 | #117 | Exceptional 12.7% |
| Sri Lankans | 90.9 /100 | #118 | Exceptional 12.7% |
| Albanians | 90.8 /100 | #119 | Exceptional 12.7% |
| New Zealanders | 90.6 /100 | #120 | Exceptional 12.7% |
| Immigrants | Hungary | 90.3 /100 | #121 | Exceptional 12.7% |
| French Canadians | 90.2 /100 | #122 | Exceptional 12.7% |
| Immigrants | South Eastern Asia | 89.9 /100 | #123 | Excellent 12.7% |
| Immigrants | Norway | 89.3 /100 | #124 | Excellent 12.8% |
| Argentineans | 89.1 /100 | #125 | Excellent 12.8% |