Salvadoran vs Sri Lankan Disability Age Over 75
COMPARE
Salvadoran
Sri Lankan
Disability Age Over 75
Disability Age Over 75 Comparison
Salvadorans
Sri Lankans
48.9%
DISABILITY AGE OVER 75
0.3/ 100
METRIC RATING
263rd/ 347
METRIC RANK
48.5%
DISABILITY AGE OVER 75
1.4/ 100
METRIC RATING
248th/ 347
METRIC RANK
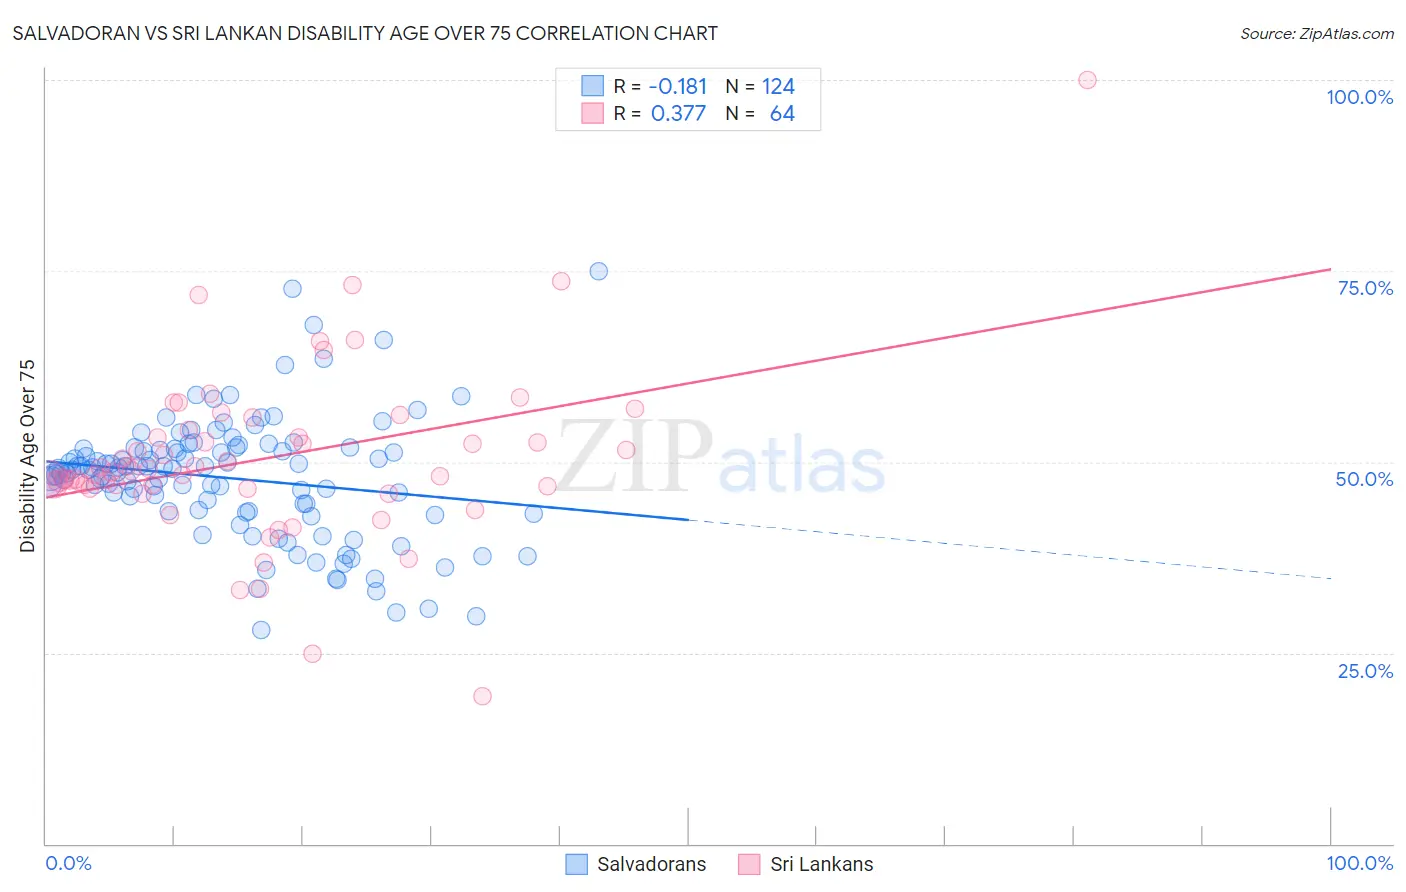
Salvadoran vs Sri Lankan Disability Age Over 75 Correlation Chart
The statistical analysis conducted on geographies consisting of 398,055,900 people shows a poor negative correlation between the proportion of Salvadorans and percentage of population with a disability over the age of 75 in the United States with a correlation coefficient (R) of -0.181 and weighted average of 48.9%. Similarly, the statistical analysis conducted on geographies consisting of 439,378,477 people shows a mild positive correlation between the proportion of Sri Lankans and percentage of population with a disability over the age of 75 in the United States with a correlation coefficient (R) of 0.377 and weighted average of 48.5%, a difference of 0.88%.
Disability Age Over 75 Correlation Summary
| Measurement | Salvadoran | Sri Lankan |
| Minimum | 28.0% | 19.3% |
| Maximum | 75.0% | 100.0% |
| Range | 47.0% | 80.7% |
| Mean | 47.8% | 50.4% |
| Median | 49.0% | 48.8% |
| Interquartile 25% (IQ1) | 43.5% | 46.6% |
| Interquartile 75% (IQ3) | 51.7% | 53.7% |
| Interquartile Range (IQR) | 8.2% | 7.0% |
| Standard Deviation (Sample) | 8.1% | 11.5% |
| Standard Deviation (Population) | 8.0% | 11.4% |
Demographics Similar to Salvadorans and Sri Lankans by Disability Age Over 75
In terms of disability age over 75, the demographic groups most similar to Salvadorans are Immigrants from West Indies (48.9%, a difference of 0.020%), Immigrants from Honduras (48.9%, a difference of 0.050%), Honduran (48.9%, a difference of 0.060%), African (48.9%, a difference of 0.080%), and Immigrants from Afghanistan (48.8%, a difference of 0.13%). Similarly, the demographic groups most similar to Sri Lankans are Iroquois (48.4%, a difference of 0.060%), Chippewa (48.4%, a difference of 0.080%), American (48.4%, a difference of 0.11%), Iraqi (48.6%, a difference of 0.21%), and West Indian (48.6%, a difference of 0.29%).
| Demographics | Rating | Rank | Disability Age Over 75 |
| Americans | 1.7 /100 | #245 | Tragic 48.4% |
| Chippewa | 1.6 /100 | #246 | Tragic 48.4% |
| Iroquois | 1.6 /100 | #247 | Tragic 48.4% |
| Sri Lankans | 1.4 /100 | #248 | Tragic 48.5% |
| Iraqis | 1.0 /100 | #249 | Tragic 48.6% |
| West Indians | 0.8 /100 | #250 | Tragic 48.6% |
| Koreans | 0.8 /100 | #251 | Tragic 48.6% |
| Immigrants | South Eastern Asia | 0.7 /100 | #252 | Tragic 48.7% |
| British West Indians | 0.6 /100 | #253 | Tragic 48.7% |
| Immigrants | Vietnam | 0.6 /100 | #254 | Tragic 48.7% |
| Chinese | 0.5 /100 | #255 | Tragic 48.7% |
| Immigrants | Congo | 0.5 /100 | #256 | Tragic 48.7% |
| Blackfeet | 0.5 /100 | #257 | Tragic 48.8% |
| Immigrants | Philippines | 0.4 /100 | #258 | Tragic 48.8% |
| Central Americans | 0.4 /100 | #259 | Tragic 48.8% |
| Immigrants | Afghanistan | 0.4 /100 | #260 | Tragic 48.8% |
| Africans | 0.3 /100 | #261 | Tragic 48.9% |
| Immigrants | West Indies | 0.3 /100 | #262 | Tragic 48.9% |
| Salvadorans | 0.3 /100 | #263 | Tragic 48.9% |
| Immigrants | Honduras | 0.3 /100 | #264 | Tragic 48.9% |
| Hondurans | 0.3 /100 | #265 | Tragic 48.9% |